A Coordinated Electric System Interconnection Review—the utility’s deep-dive on technical and cost impacts of your project.
Challenge: Frequent false tripping using conventional electromechanical relays
Solution: SEL-487E integration with multi-terminal differential protection and dynamic inrush restraint
Result: 90% reduction in false trips, saving over $250,000 in downtime
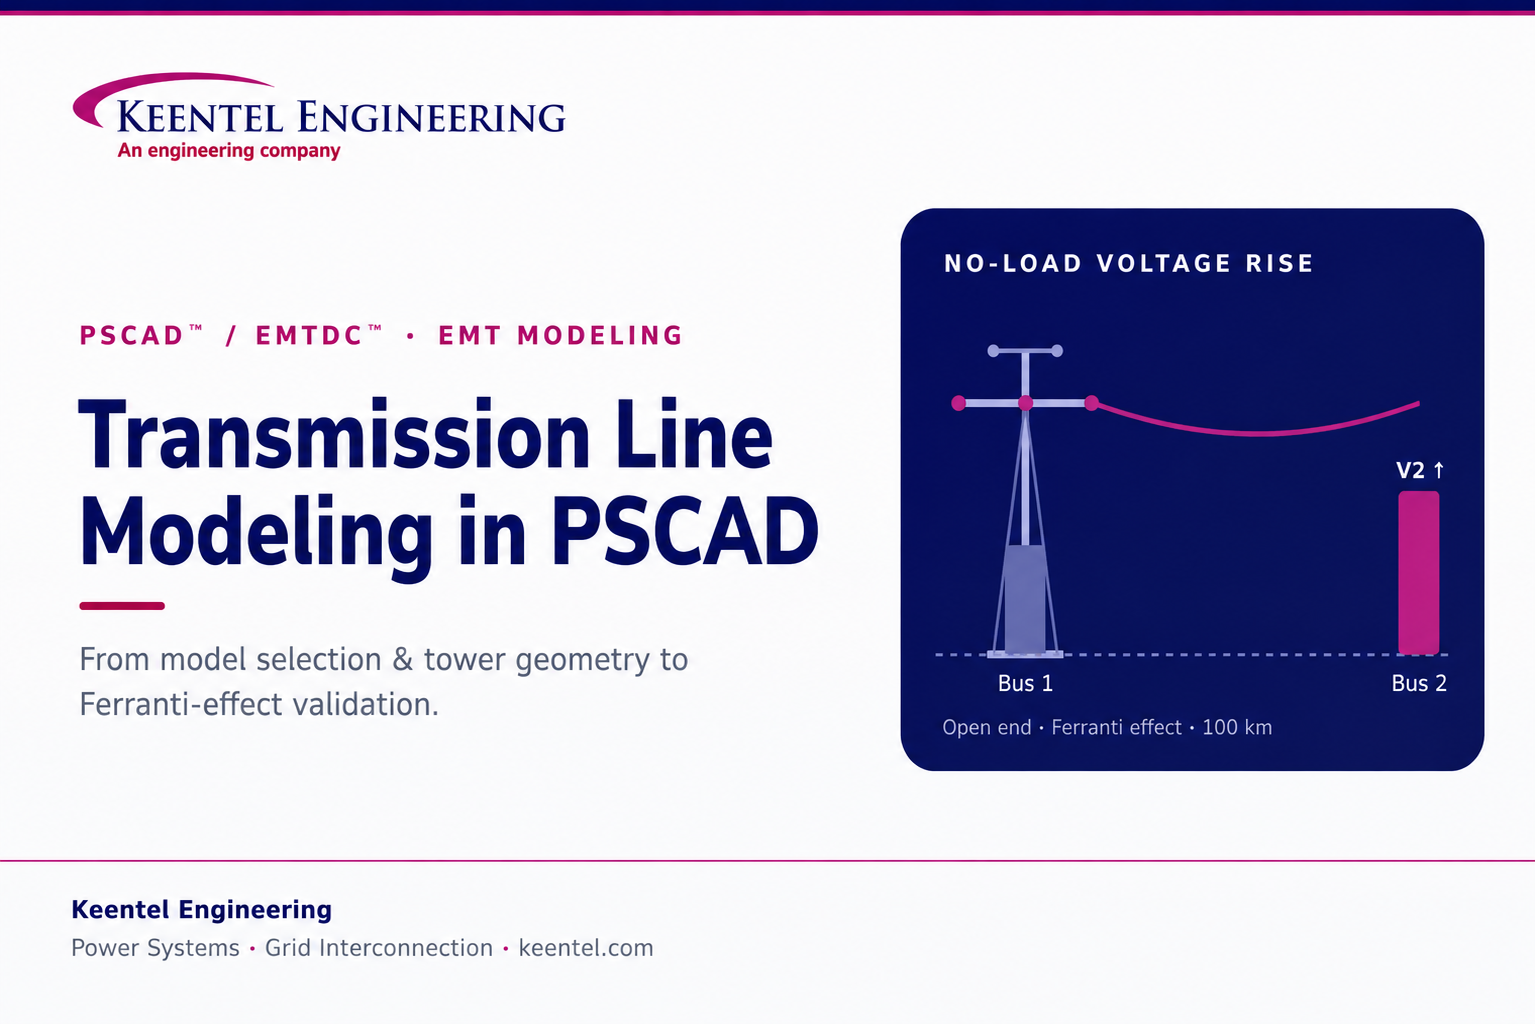
Transmission Line Modeling
in PSCAD
From Model Selection and Tower Geometry to
Ferranti-Effect Validation
Jun 20, 2026 | Blog
A practical guide to building a distributed line model in PSCAD—choosing between PI, Bergeron, and frequency-dependent representations, configuring tower geometry, and validating no-load voltage rise.
Why Line-Model Fidelity Decides the Study
A transmission line is never just an impedance between two buses. It is a distributed network of inductance, capacitance, and resistance whose behavior changes with frequency, geometry, and length—and the way you represent it in PSCAD™/EMTDC™ directly determines whether your study results mean anything. Choose too simple a model and you miss the travelling-wave behavior that drives switching surges and temporary overvoltages. Choose the right one, configure its geometry correctly, and a single line model can tell you whether an EHV circuit will overstress equipment at no load, how a breaker will see recovery voltage, or how a corridor will interact with nearby inverter-based resources.
This guide walks through how we build and sanity-check a distributed line model in PSCAD—starting from the choice of representation, moving through the transmission segment, tower geometry, interfaces, and source, and finishing with a classic validation: the Ferranti effect at no load. We use a Bergeron build as the worked example because it is the cleanest way to see every part of the workflow, and because the Ferranti effect is a fundamental-frequency phenomenon that a single-frequency model captures well.
Three Ways PSCAD Represents a Line
PSCAD offers three families of transmission-line representation. They are not interchangeable; the requirements of the study decide which is appropriate.
PI section
A lumped-parameter model. It gives the correct fundamental-frequency impedance, but it cannot represent other frequencies accurately unless many sections are cascaded—which is computationally inefficient—and it does not capture the frequency dependence of line parameters such as skin effect. It is reserved for very short lines, where travelling-wave models cannot be used because the wave would cross the line in less than a single time step.
Bergeron model
A distributed travelling-wave model that represents the line’s L and C in a distributed manner (effectively an infinite number of PI sections), with resistance lumped at the ends. Critically, it is a single-frequency model: all parameters are computed at one specified frequency—typically 50 or 60 Hz for AC lines—so only results at that steady-state frequency are strictly meaningful. That makes it well suited to fundamental-frequency work such as load-flow matching, relay studies, and power-frequency overvoltage checks like the Ferranti effect.
Frequency-Dependent (Phase) model
The most accurate time-domain line model available. Like Bergeron it is a distributed travelling-wave model, but it distributes resistance along with L and C and, decisively, solves the line parameters at many frequency points—so it captures frequency dependence and attenuation across a wide band, including unbalanced geometries. PSCAD’s own guidance is that this should be the model of choice for new line and cable studies unless there is a specific reason to use another. It costs more solve time than Bergeron, which is the trade-off for broadband accuracy.
How we choose
For broadband transient work—switching surges, lightning, harmonic interaction, IBR/EMT interconnection studies—we default to the Frequency-Dependent (Phase) model. For fundamental-frequency phenomena where a single-frequency representation is exact enough—load flow, relay reach, and the no-load Ferranti check that follows—the Bergeron model is appropriate and faster. The PI section we keep for very short segments only.
| Model | Captures frequency dependence? | Best used for |
|---|---|---|
| PI section | No (fundamental only) | Very short lines below the travelling-wave time-step limit |
| Bergeron | No (single specified frequency) | Load flow, relay studies, power-frequency overvoltage (Ferranti) |
| Freq-Dependent (Phase) | Yes (solved at many frequencies) | Switching/lightning transients, harmonics, EMT interconnection studies |
Building the Line, Step by Step
The worked example below builds a 100 km, three-phase, single-circuit overhead line as a Bergeron model and prepares it for a no-load validation.
1. Place the transmission segment
From the component wizard, drop in a transmission segment. PSCAD distinguishes between an overhead T-Line segment and a Cable segment; choose the T-Line for an overhead corridor. Rename the segment something descriptive—here, simply T line—and create it. The name matters later, because it is the key PSCAD uses to tie the segment to its interfaces.
2. Edit the segment parameters
Open Edit Parameters and set the electrical and physical basics:
- Segment name — must match the name used by the interfaces you will place at each end (see step 5).
- Frequency — the steady-state frequency at which the model is solved (50 Hz or 60 Hz depending on the system).
- Segment length — 100 km in this example.
- Number of conductors — for a three-phase single-circuit line this is 3 (phase conductors only). A double-circuit line is 6; add ground/shield wires and the count rises accordingly—e.g. 7 or 8 with one or two ground wires.
Termination style determines how the segment connects to the rest of the network, and changing it updates the segment symbol:
| Termination style | Meaning |
|---|---|
| Local connections | Connect directly to a bus at both ends within the same schematic |
| Remote ends | Connections are made remotely (used in this example); the symbol changes to reflect it |
| Foreign ends | Reference the segment from another workspace/file |
| Alien ends | Reference the segment from a different system study file |
Coupling and tandem options are left unset for a standalone single corridor.
3. Select the Bergeron model in the definition
Open Edit Definition. The same frequency, length, and conductor count appear here. By default the segment carries a Frequency-Dependent model object; to build a Bergeron line, delete that default object, right-click, choose Transmission Model, and select Bergeron. (The same menu is where you would instead choose Frequency-Dependent for a broadband study.) The Bergeron model options require no further configuration for a standard build.
4. Define the tower cross-section and conductor geometry
With the model selected, PSCAD prompts for a tower cross-section. The available configurations cover the common structures—flat, vertical, horizontal, single- and double-circuit, a universal tower, and manual data entry—because the physical arrangement of the conductors is what sets the line’s electrical parameters. Using the universal tower with default parameters, the geometry in this example is:
- Conductor type — Chukar (a standard ACSR conductor).
- Tower center — 0 m defines the structure’s centerline; conductor horizontal positions (x) are measured from it, and vertical positions (y) from the ground.
- Phase conductors — Y-phase on the centerline (x = 0), R-phase 5 m to the left (x = −5 m), B-phase 5 m to the right (x = +5 m), all at 30 m above ground. Because all three sit at the same height, this is a horizontal configuration.
- Ground (shield) wires — two conductors at x = −2.5 m and x = +2.5 m, each at 40 m above ground—above the phase conductors, as expected for lightning shielding.
Why geometry is not a detail
Conductor spacing and height set the series inductance and shunt capacitance of every phase, and therefore the surge impedance, the charging current, and the no-load voltage rise you are about to validate. Two lines of identical length and voltage but different tower geometry will not behave the same. Getting the cross-section right is getting the physics right.
5. Add the T-Line interfaces and match the name
Place a T-Line interface at each end of the corridor and give both interfaces the same segment name you assigned in step 2 (T line). Set the number of equivalent conductors to 3 to match the build. PSCAD links the two interfaces to the single 100 km segment by name—not by physical proximity—so the interfaces can sit anywhere on the schematic and the result is identical. Mirror the second interface so its ports face the opposite bus.
6. Convert three-phase to single-line and connect the buses
The interface exposes three individual phase conductors. To land them on a single-line bus, insert a three-phase-to-single-line converter at each end and wire it through in wire mode, mirroring on the receiving side. The corridor now runs cleanly from Bus 1 (sending end) to Bus 2 (receiving end) as a single 100 km, three-phase line.
7. Add and configure the source
Add a voltage source at the sending end. Starting from a default three-phase source, set it to the study voltage (230 kV in this example, behind a typical 100 MVA rating), set the frequency to match the segment, and configure it as an infinite (ideal) bus so the sending-end voltage is held firm while you observe what the line does to the receiving end. The model is now ready to validate.
Validating with the Ferranti Effect
The Ferranti effect is the canonical no-load check for a long line or cable. With the receiving end (Bus 2) open—no load connected—the line’s distributed capacitance draws a leading charging current through its series inductance, and that current raises the receiving-end voltage above the sending-end voltage. The longer the line and the higher its capacitance, the larger the rise; cables, with far greater capacitance per kilometer than overhead lines, show the effect even at modest lengths.
To observe it, meter the RMS voltage at both ends—call them Ea1 at Bus 1 and Ea2 at Bus 2—run the case at no load, and compare. A correctly built model will show Ea2 > Ea1, with the magnitude of the rise tracking the line length and geometry. Because this is a steady-state, fundamental-frequency phenomenon, the single-frequency Bergeron model represents it faithfully; you do not need the broadband Frequency-Dependent model to get a trustworthy answer here.
Why this matters beyond the textbook
No-load and light-load voltage rise is not an academic curiosity—it drives real engineering decisions: sizing shunt reactors to absorb the line’s charging reactive power, setting temporary-overvoltage (TOV) withstand for insulation coordination, defining energization and switching sequences, and confirming that equipment at the open end is not overstressed. The same model that demonstrates the Ferranti effect becomes the basis for the compensation and overvoltage studies that follow.
From here the workflow extends naturally: plot Ea1 and Ea2 over time, quantify the per-unit rise, then iterate—adding shunt compensation, testing energization transients with the Frequency-Dependent model, or sweeping line length—to turn a single validated corridor into a full overvoltage and compensation study.
How Keentel Applies This
Transmission-line modeling sits underneath almost everything we do in EMT-domain work. The same disciplined workflow—right model for the phenomenon, correct tower geometry, name-matched interfaces, a firm source, and a deliberate validation case—supports our insulation-coordination and TOV studies, switching and energization analysis, shunt-reactor sizing, protection and relay studies, and the point-of-interconnection EMT studies that increasingly govern renewable, BESS, and large-load projects. A line model is only as good as the choices behind it, and those choices are where study credibility is won or lost.
Talk to Keentel
Need EHV/HV line or cable modeling, energization and TOV studies, shunt-compensation sizing, or interconnection-grade EMT analysis?
Keentel Engineering provides power-system studies, POI interconnection engineering, substation and transmission-line design, and owner’s-engineer services across utility-scale renewables, BESS, and large-load projects. Reach us at keentel.com.
About Keentel Engineering & Disclaimers
Keentel Engineering is a power systems and grid-interconnection firm with offices in Tampa, Florida and Austin, Texas. Our services span power-system studies (EHV/HV/MV), point-of-interconnection engineering, substation and transmission-line design, utility-scale renewables and BESS engineering, owner’s-engineer services, and NERC O&P compliance, with deep EMT-modeling capability across interconnection workflows.
Non-affiliation and trademark notice
This document is an independent technical commentary prepared by Keentel Engineering for educational purposes. Keentel Engineering is not affiliated with, authorized by, sponsored by, or endorsed by Manitoba Hydro International Ltd. PSCAD™ and EMTDC™ are trademarks of Manitoba Hydro International Ltd. Conductor names and all other trademarks referenced are the property of their respective owners and are used for identification and descriptive purposes only.
Software behavior, model options, and default settings may change across PSCAD versions; always confirm against the official PSCAD documentation and the vendor’s current guidance. Example values (voltage, length, frequency, geometry) are illustrative and not design recommendations. This material does not constitute professional engineering advice for any specific project; engagement of a licensed engineer is recommended for project-specific application.
Technical FAQ
Common questions on transmission-line modeling in PSCAD, answered from a study-engineering perspective.
Choosing and configuring the model
Q. What are the three line-model types, and how do I choose?
A. PSCAD offers PI sections, the Bergeron model, and frequency-dependent models. PI sections are lumped-parameter and only correct at the fundamental frequency—reserved for very short lines. Bergeron is a distributed travelling-wave model solved at one specified frequency, good for load flow, relay studies, and power-frequency overvoltages. The Frequency-Dependent (Phase) model solves the line at many frequencies and is the most accurate; it is the recommended default for new broadband or transient studies. Match the model to the phenomenon you are studying.
Q. Why does PSCAD recommend the Frequency-Dependent (Phase) model for new studies?
A. Because it distributes resistance along with inductance and capacitance and solves the line parameters across a wide frequency range, capturing frequency dependence, attenuation, and unbalanced geometries that single-frequency models cannot. It is more computationally expensive than Bergeron, but for switching surges, lightning, harmonics, and EMT interconnection work that accuracy is necessary.
Q. Is the Bergeron model good enough for a Ferranti-effect study?
A. Yes. The Ferranti effect is a steady-state, fundamental-frequency phenomenon, and the Bergeron model computes its parameters exactly at the specified power frequency. For no-load voltage rise at 50 or 60 Hz, Bergeron gives a trustworthy result and solves faster than the frequency-dependent model. Reserve the Frequency-Dependent (Phase) model for cases where broadband behavior matters, such as energization transients.
Q. Do I always need a tower cross-section?
A. Not for every case. With the Bergeron model you can substitute a manual entry of impedance/admittance (Y, Z) data in place of a tower component if you already have the line constants for a three-phase system—the manual-entry component takes the tower’s place while the Bergeron model itself remains. For geometry-driven studies, though, defining the actual tower cross-section is the more rigorous approach.
Segment parameters and geometry
Q. How do I set the number of conductors?
A. Count the physical conductors the model represents. A three-phase single-circuit line uses 3 (phase conductors only). A double-circuit line uses 6. Add ground/shield wires and the number rises—typically 7 or 8 for one or two ground wires on a single-circuit line. The conductor count must match the tower geometry you define.
Q. What do the termination styles (local, remote, foreign, alien) mean?
A. They describe how the segment connects to the rest of the model. Local connections wire directly to buses at both ends in the same schematic. Remote ends connect remotely (the symbol changes to indicate it). Foreign ends let you reference the segment from another workspace or file. Alien ends reference it from a different system study file. Pick the style that matches how your project is organized.
Q. Why must the T-Line interface name match the segment name?
A. PSCAD links the interfaces at each end to the underlying segment by name, not by where they sit on the page. If the names match, the interfaces and the segment are the same line; if they don’t, the link breaks. This is also why you can place the segment and its interfaces anywhere on the schematic—the result depends on the name, not the layout.
Q. How does tower geometry affect the results?
A. Directly. Conductor spacing and height determine each phase’s series inductance and shunt capacitance, which set the surge impedance, charging current, and no-load voltage rise. In the worked example, the three phases sit at one height (a horizontal configuration) with two ground wires above them. Change the geometry and the electrical behavior changes—so the cross-section is a core input, not a formality.
Q. What is a horizontal configuration?
A. It simply means all three phase conductors are mounted at the same height above ground, spread horizontally across the tower. In the example, the phases sit at 30 m with the centerline phase at x = 0 and the outer phases at ±5 m, while the two ground wires are higher, at 40 m. Vertical and other configurations stack the phases differently and yield different parameters.
Q. What is the difference between a T-Line and a Cable segment?
A. They are different segment types for different physical assets: T-Line for overhead transmission lines and Cable for underground or submarine cables. The modeling workflow is similar, but cables have very different geometry and far higher capacitance per unit length, which makes effects like Ferranti voltage rise appear at much shorter lengths.
Connections, source, and validation
Q. Why insert a three-phase-to-single-line converter?
A. The line interface exposes three separate phase conductors, but you often want to connect to a single-line bus. The three-phase-to-single-line converter bundles the three conductors so they land cleanly on one bus. You place one at each end (mirrored) and connect through in wire mode.
Q. Does it matter where I place the segment on the schematic?
A. No. Because PSCAD identifies the line by its segment name, the segment and its interfaces can be placed anywhere on the page—the simulation result is the same. Layout is for readability, not for electrical behavior.
Q. How should I configure the source for a no-load validation?
A. Use an ideal/infinite bus at the sending end set to the study voltage and frequency (for example, 230 kV at 50 or 60 Hz behind a representative rating). Holding the sending-end voltage firm lets you isolate what the line itself does to the open receiving end—which is exactly what the Ferranti check measures.
Q. What is the Ferranti effect and why does it matter?
A. It is the rise of receiving-end voltage above sending-end voltage on a lightly loaded or open line, caused by the line’s distributed capacitance drawing charging current through its inductance. It matters because it sizes shunt reactors, sets temporary-overvoltage withstand for insulation coordination, and informs energization and switching plans. It grows with line length and is pronounced on cables.
Q. How do I confirm the model is behaving correctly?
A. Meter RMS voltage at both ends (e.g., Ea1 at the sending bus and Ea2 at the open receiving bus), run at no load, and compare. A correct long-line model shows the receiving-end voltage higher than the sending-end voltage, with the rise scaling sensibly with length and geometry. Plotting both voltages over time and computing the per-unit rise quantifies it.
Q. Should I model at 50 Hz or 60 Hz?
A. Use the system frequency of the network you are studying—60 Hz across North America, 50 Hz in much of Europe and Asia. For a single-frequency Bergeron model this matters, because all parameters are computed at that one frequency; set it to the actual operating frequency so the results are meaningful.
Q. How long does a line need to be before a travelling-wave model is appropriate?
A. Long enough that a wave travelling at roughly the speed of light does not cross the entire line within a single simulation time step. As a rule of thumb at a 50 µs time step, lines beyond roughly 15 km are good candidates for distributed (Bergeron or frequency-dependent) models; shorter segments may need a PI representation.
Q. How does this feed into interconnection and EMT studies?
A. A validated line model is the foundation for the studies that govern interconnection: switching and energization transients, temporary overvoltage and insulation coordination, shunt-compensation sizing, protection and relay performance, and the point-of-interconnection EMT analysis required for renewable, BESS, and large-load projects. Build the corridor correctly and the downstream studies inherit its credibility.

About the Author:
Sonny Patel P.E. EC
IEEE Senior Member
In 1995, Sandip (Sonny) R. Patel earned his Electrical Engineering degree from the University of Illinois, specializing in Electrical Engineering . But degrees don’t build legacies—action does. For three decades, he’s been shaping the future of engineering, not just as a licensed Professional Engineer across multiple states (Florida, California, New York, West Virginia, and Minnesota), but as a doer. A builder. A leader. Not just an engineer. A Licensed Electrical Contractor in Florida with an Unlimited EC license. Not just an executive. The founder and CEO of KEENTEL LLC—where expertise meets execution. Three decades. Multiple states. Endless impact.
Services

Let's Discuss Your Project
Let's book a call to discuss your electrical engineering project that we can help you with.
About the Author:
Sonny Patel P.E. EC
IEEE Senior Member
In 1995, Sandip (Sonny) R. Patel earned his Electrical Engineering degree from the University of Illinois, specializing in Electrical Engineering . But degrees don’t build legacies—action does. For three decades, he’s been shaping the future of engineering, not just as a licensed Professional Engineer across multiple states (Florida, California, New York, West Virginia, and Minnesota), but as a doer. A builder. A leader. Not just an engineer. A Licensed Electrical Contractor in Florida with an Unlimited EC license. Not just an executive. The founder and CEO of KEENTEL LLC—where expertise meets execution. Three decades. Multiple states. Endless impact.
Leave a Comment
We will get back to you as soon as possible.
Please try again later.
Related Posts