
A Coordinated Electric System Interconnection Review—the utility’s deep-dive on technical and cost impacts of your project.
Challenge: Frequent false tripping using conventional electromechanical relays
Solution: SEL-487E integration with multi-terminal differential protection and dynamic inrush restraint
Result: 90% reduction in false trips, saving over $250,000 in downtime
ERCOT enforces all of the above through simulation, which means your model is your compliance case. The bar is now high:
- Whole-facility scope. The model must represent everything the IT load, the UPS and power conversion, the cooling plant, the protection and control systems in formats compatible with ERCOT's study platforms (PSS/E, PSCAD, TSAT).
- Real control loops, not approximations. Generic textbook representations are unacceptable. The model must capture the actual inner control behavior of your power electronics.
- Hardware-validated converter models. For electronic loads, the PSCAD model must be benchmarked against actual hardware testing including voltage ride-through and subsynchronous response. A model assembled from standard PSCAD library blocks fails by definition, because a generic block has never been tested against your vendor's hardware. The good news: validation is a hardware-type test, so results for a given converter product are reusable across every facility that uses it.
- Format migration. Facilities that previously submitted the older composite load model (CMLD) format must transition to EPRI's PERC1 format.
- Three checkpoints. Models are reviewed before the stability study begins (no model, no study), before each quarterly stability assessment, and for electronic loads one final time before energization, when you must submit as-built models with a documented comparison against the previously studied data and a sworn attestation that the model matches actual field settings. ERCOT's review takes 10 business days, extendable by 20 put it on your critical path.
- A living obligation. Change your technology, controls, or relay settings in a way that affects ride-through including converting a crypto mining site to an AI data center — and you've triggered a new interconnection study, even if your megawatts don't change.
| Parameter | Detail |
|---|---|
| System | 230 kV / 138 kV transmission corridors, wind and wet-snow icing exposure |
| Data basis | 15 years of minute-resolution forced-outage records + regional weather observations |
| Core methods | Event grouping, MVA performance curves, time-to-95%-restore, area outage rate curves, fragility modeling, rerun-history benefits, exceedance and log-domain risk metrics |
| Headline result | ≈85% of maximum resilience benefit at 60% of original capital; worst-event restoration window cut from 11 days to 5 in rerun-history terms |
| Decision supported | Capital portfolio selection; resilience plan filing; post-investment verification framework |
| System / Topic | Governing Standard(s) | What It Controls |
|---|---|---|
| Overall plant electrical distribution | IEEE 141 (Red Book); IEEE 666 | Distribution architecture, voltage selection, design of generating station auxiliary service systems |
| Power system studies | IEEE 399 (Brown Book); IEEE 551 | Load flow, symmetrical/asymmetrical short circuit, motor starting methodologies down to the lowest LV panelboard |
| Protection & coordination | IEEE 242 (Buff Book); IEEE 3004.5; IEEE C37 series | Generator relaying (21, 59N, 87G), time-current coordination, selective clearing between LV and MV tiers |
| GSU / UAT / SST transformers | IEEE C57.12.00 and C57 family | Transformer ratings, impedance, testing, loading |
| HV switchyard breakers | IEEE C37.06 | AC high-voltage circuit breaker preferred ratings |
| MV switchgear (13.8 kV) | IEEE C37.20.2; IEEE C37.20.7 | Metal-clad construction, compartmentalization, vacuum breakers; arc-resistant design with plenum venting |
| MV cable | UL 1072; ICEA S-93-639 (NEMA WC 74) | Type MV-105 shielded cable, 133% insulation level for HRG systems |
| LV switchgear (480 V) | IEEE C37.13; UL 1558 | Metal-enclosed LV power circuit breaker switchgear to 635 V, draw-out ACBs with electronic trip units |
| Motor control centers | UL 845; NEMA ICS 18 | LV-MCC construction, MCCB/MCP protection for motors under ~200 HP |
| Motors | NEMA MG-1 | Motor performance, starting characteristics, service factors |
| DC & battery systems | IEEE 485; IEEE 946 | Lead-acid battery sizing (125/250 VDC), DC auxiliary system design |
| Grounding | IEEE 80; IEEE 142 (Green Book) | Ground grid step/touch potential limits; system grounding including high-resistance grounding |
| Lightning protection | IEEE 998 | Direct-stroke shielding of switchyard and outdoor generator structures |
| Arc flash & electrical safety | IEEE 1584; NFPA 70E | Incident energy calculation; worker safety boundaries and PPE |
| Fire protection | NFPA 850 | Fire protection and risk management for combustion turbine generating plants |
| Installation code | NEC (NFPA 70); NESC | Wiring methods inside the plant fence; overhead/outdoor clearances at the switchyard |
| Interconnection & compliance | FERC LGIP; NERC MOD-025/026/027, PRC-019/024/029, FAC-008 | Interconnection process, model validation, protection/ride-through coordination, facility ratings |
| IFC / Construction Deliverable | Purpose |
|---|---|
| Stamped IFC packages | Legal basis for construction; P.E. responsible charge |
| Final relay settings & TCCs | Protection as-installed matches the coordination study |
| Calculation archive | Owner records; NERC audit evidence trail |
| Commissioning procedures | Safe, sequenced energization; MOD field testing |
| Construction support | RFIs, field changes, FAT/SAT witness |
| As-builts & model handoff | Operating baseline; future study currency |
| Metric | Outcome |
|---|---|
| Defects found pre-occupancy | Three topology defects and one settings-mismatch family corrected before load migration; the shared-switchboard defect alone would have invalidated the concurrently-maintainable claim on day one |
| IST findings | Fourteen additional discrepancies surfaced under scenario testing (control logic, alarm mapping, one generator sequencing fault) — all closed before handover instead of during operations |
| Black-building test | Passed on second execution; the first attempt exposed the generator sequencing fault under true block load, exactly the failure the compressed plan would never have found |
| Handover quality | Operations team certified on the actual failure scenarios; corrected EOPs and settings documentation delivered as controlled documents |
| Business outcome | Occupancy proceeded three weeks behind the original date — against an independent estimate that the uncorrected sequencing fault carried a high probability of a full facility outage within the first year |
Part 2 — Frequently Asked Questions: Large Load Interconnection
| Contact | Details |
|---|---|
| Headquarters | 400 N Ashley Dr STE 2600, Tampa, FL 33602 |
| Phone | (813) 389-7871 |
| contact@keentelengineering.com | |
| Florida Firm Registration | No. 36853 |
| Additional Offices | Austin, TX • Sacramento, CA • Baltimore, MD |
| Who | Acronym | Plain-English Role |
|---|---|---|
| ERCOT | — | The grid's air traffic controller. It doesn't own power lines or plants; it directs the flow of electricity across most of Texas and referees the admission process for new generators. |
| Interconnecting Entity | IE | You — the developer or owner trying to connect a new plant (or significantly modify an existing one). You file the application and drive the process. |
| Resource Entity | RE | The registered owner/operator of the generator once it becomes an official market participant. Often the same company as the IE, wearing a different hat. |
| Qualified Scheduling Entity | QSE | Your plant's voice on the grid. The QSE handles round-the-clock communications with ERCOT — telemetry, schedules, dispatch instructions. Every generator must have one. |
| Transmission Service Provider | TSP | The utility that owns the wires and substation you'll connect to. The TSP runs your detailed study, builds the connection facilities, and signs your interconnection contract. |
| RIOO-IS | — | ERCOT's online portal where the whole process lives — applications, documents, status tracking, and checklists all flow through it. |
| Who | Acronym | Plain-English Role |
|---|---|---|
| ERCOT | — | The grid's air traffic controller. It doesn't own power lines or plants; it directs the flow of electricity across most of Texas and referees the admission process for new generators. |
| Interconnecting Entity | IE | You — the developer or owner trying to connect a new plant (or significantly modify an existing one). You file the application and drive the process. |
| Resource Entity | RE | The registered owner/operator of the generator once it becomes an official market participant. Often the same company as the IE, wearing a different hat. |
| Qualified Scheduling Entity | QSE | Your plant's voice on the grid. The QSE handles round-the-clock communications with ERCOT — telemetry, schedules, dispatch instructions. Every generator must have one. |
| Transmission Service Provider | TSP | The utility that owns the wires and substation you'll connect to. The TSP runs your detailed study, builds the connection facilities, and signs your interconnection contract. |
| RIOO-IS | — | ERCOT's online portal where the whole process lives — applications, documents, status tracking, and checklists all flow through it. |
| Who | Acronym | Plain-English Role |
|---|---|---|
| ERCOT | — | The grid's air traffic controller. It doesn't own power lines or plants; it directs the flow of electricity across most of Texas and referees the admission process for new generators. |
| Interconnecting Entity | IE | You — the developer or owner trying to connect a new plant (or significantly modify an existing one). You file the application and drive the process. |
| Resource Entity | RE | The registered owner/operator of the generator once it becomes an official market participant. Often the same company as the IE, wearing a different hat. |
| Qualified Scheduling Entity | QSE | Your plant's voice on the grid. The QSE handles round-the-clock communications with ERCOT — telemetry, schedules, dispatch instructions. Every generator must have one. |
| Transmission Service Provider | TSP | The utility that owns the wires and substation you'll connect to. The TSP runs your detailed study, builds the connection facilities, and signs your interconnection contract. |
| RIOO-IS | — | ERCOT's online portal where the whole process lives — applications, documents, status tracking, and checklists all flow through it. |
| Who | Acronym | Plain-English Role |
|---|---|---|
| ERCOT | — | The grid's air traffic controller. It doesn't own power lines or plants; it directs the flow of electricity across most of Texas and referees the admission process for new generators. |
| Interconnecting Entity | IE | You — the developer or owner trying to connect a new plant (or significantly modify an existing one). You file the application and drive the process. |
| Resource Entity | RE | The registered owner/operator of the generator once it becomes an official market participant. Often the same company as the IE, wearing a different hat. |
| Qualified Scheduling Entity | QSE | Your plant's voice on the grid. The QSE handles round-the-clock communications with ERCOT — telemetry, schedules, dispatch instructions. Every generator must have one. |
| Transmission Service Provider | TSP | The utility that owns the wires and substation you'll connect to. The TSP runs your detailed study, builds the connection facilities, and signs your interconnection contract. |
| RIOO-IS | — | ERCOT's online portal where the whole process lives — applications, documents, status tracking, and checklists all flow through it. |
| Who | Acronym | Plain-English Role |
|---|---|---|
| ERCOT | — | The grid's air traffic controller. It doesn't own power lines or plants; it directs the flow of electricity across most of Texas and referees the admission process for new generators. |
| Interconnecting Entity | IE | You — the developer or owner trying to connect a new plant (or significantly modify an existing one). You file the application and drive the process. |
| Resource Entity | RE | The registered owner/operator of the generator once it becomes an official market participant. Often the same company as the IE, wearing a different hat. |
| Qualified Scheduling Entity | QSE | Your plant's voice on the grid. The QSE handles round-the-clock communications with ERCOT — telemetry, schedules, dispatch instructions. Every generator must have one. |
| Transmission Service Provider | TSP | The utility that owns the wires and substation you'll connect to. The TSP runs your detailed study, builds the connection facilities, and signs your interconnection contract. |
| RIOO-IS | — | ERCOT's online portal where the whole process lives — applications, documents, status tracking, and checklists all flow through it. |
| Who | Acronym | Plain-English Role |
|---|---|---|
| ERCOT | — | The grid's air traffic controller. It doesn't own power lines or plants; it directs the flow of electricity across most of Texas and referees the admission process for new generators. |
| Interconnecting Entity | IE | You — the developer or owner trying to connect a new plant (or significantly modify an existing one). You file the application and drive the process. |
| Resource Entity | RE | The registered owner/operator of the generator once it becomes an official market participant. Often the same company as the IE, wearing a different hat. |
| Qualified Scheduling Entity | QSE | Your plant's voice on the grid. The QSE handles round-the-clock communications with ERCOT — telemetry, schedules, dispatch instructions. Every generator must have one. |
| Transmission Service Provider | TSP | The utility that owns the wires and substation you'll connect to. The TSP runs your detailed study, builds the connection facilities, and signs your interconnection contract. |
| RIOO-IS | — | ERCOT's online portal where the whole process lives — applications, documents, status tracking, and checklists all flow through it. |
| Who | Acronym | Plain-English Role |
|---|---|---|
| ERCOT | — | The grid's air traffic controller. It doesn't own power lines or plants; it directs the flow of electricity across most of Texas and referees the admission process for new generators. |
| Interconnecting Entity | IE | You — the developer or owner trying to connect a new plant (or significantly modify an existing one). You file the application and drive the process. |
| Resource Entity | RE | The registered owner/operator of the generator once it becomes an official market participant. Often the same company as the IE, wearing a different hat. |
| Qualified Scheduling Entity | QSE | Your plant's voice on the grid. The QSE handles round-the-clock communications with ERCOT — telemetry, schedules, dispatch instructions. Every generator must have one. |
| Transmission Service Provider | TSP | The utility that owns the wires and substation you'll connect to. The TSP runs your detailed study, builds the connection facilities, and signs your interconnection contract. |
| RIOO-IS | — | ERCOT's online portal where the whole process lives — applications, documents, status tracking, and checklists all flow through it. |
Protection Design
| Parameter | Detail |
|---|---|
| Facility type | Mixed commercial campus with mechanical plant |
| Service | 480 V, 3-phase, multiple sub-boards |
| Problem | Chillers, AHUs, pumps, lighting |
| Solution | Distributed automatic banks at the sub-boards feeding mechanical loads |
| Installed rating | Sized to lift PF to ~0.97 across metered feeders Sized to lift PF to ~0.97 across metered feeders |
| Protection | NEC 460.8 sizing; bonded and discharge-verified NEC 460.8 sizing; bonded and discharge-verified |
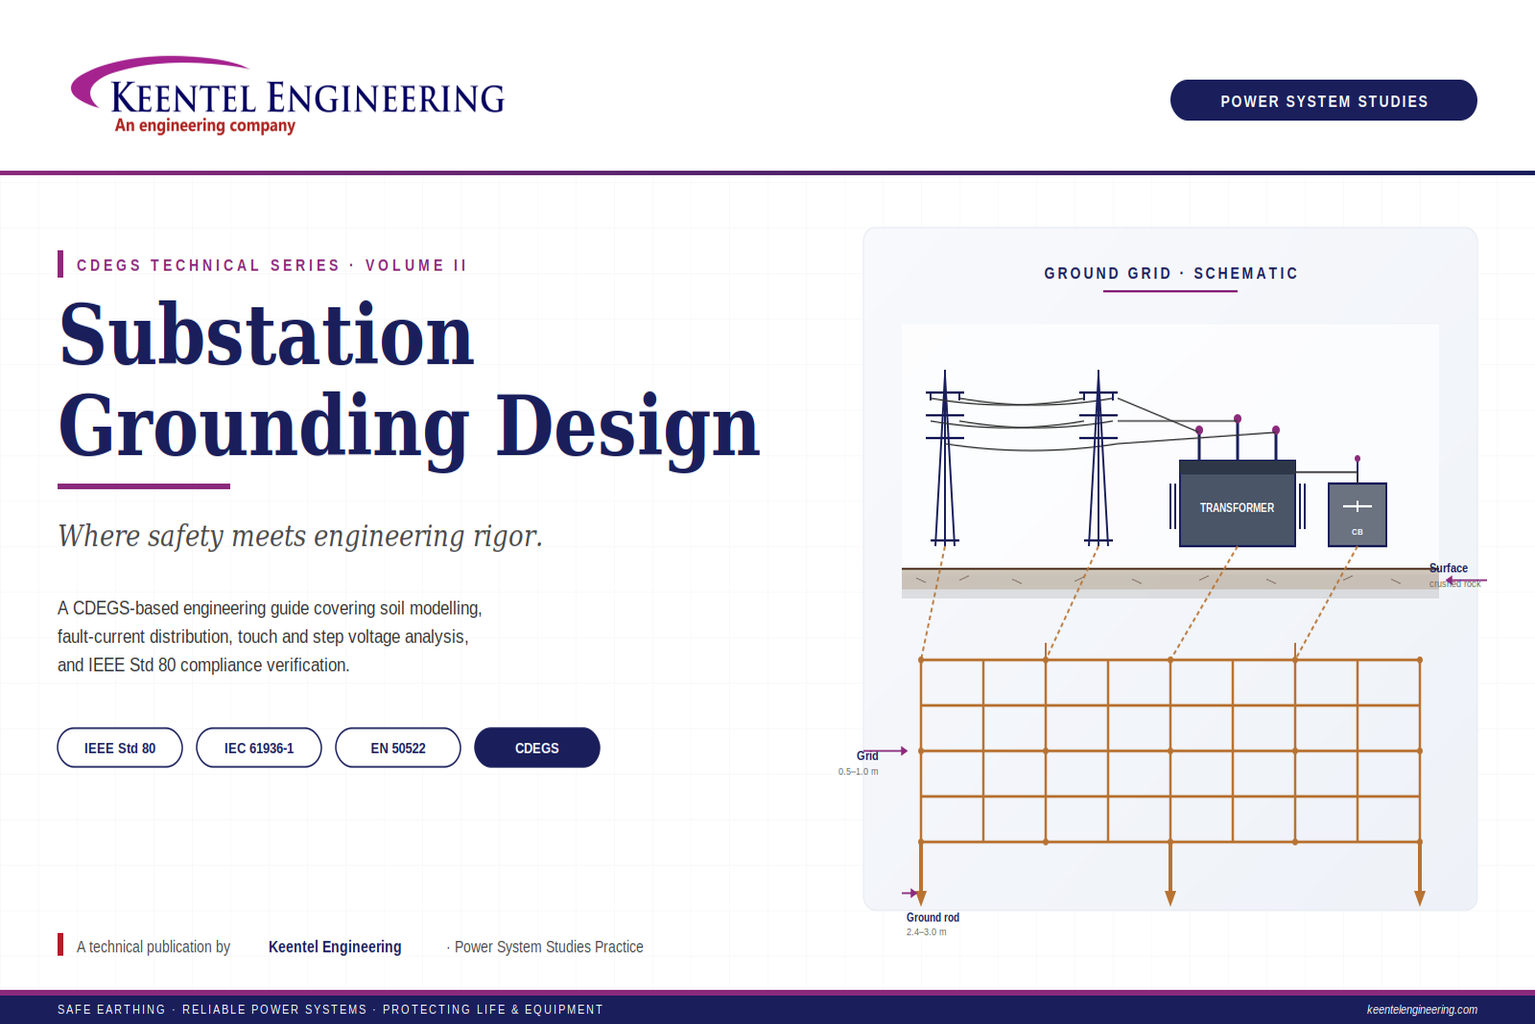
Substation Grounding Design: Where Safety Meets Engineering Rigor
Jul 31, 2026 | Blog
A well-designed ground grid is not a line item on a bill of materials — it is the invisible safety infrastructure that keeps personnel alive, equipment intact, and a utility's operating licence valid. When a fault occurs on a substation bus, tens of thousands of amperes must be safely dispersed into the earth within a fraction of a second, while touch and step voltages at every point where a human foot might land remain within limits that the human body can survive. This is a physics problem, a geometry problem, and a design-optimization problem all at once — and it is exactly where the CDEGS suite proves its value on every Keentel Engineering substation project.
This blog is the second in the Keentel Engineering technical series and takes substation grounding design from the field measurement to the final report. It draws on IEEE Std 80, IEC 61936-1, and EN 50522, and walks through the analytical workflow we apply on every substation study — utility transmission, industrial, or renewable grid-connection.
What a Ground Grid Actually Is
A ground grid — also called an earthing grid — is a network of buried conductors installed beneath the surface of a substation or power plant, forming a horizontal mesh interconnected with vertical ground rods. Its function is straightforward to state and demanding to deliver: provide a low-impedance path for fault current to disperse into the earth, and simultaneously ensure that touch and step voltages at the ground surface remain within safe limits during the worst-case fault.
Every energized structure inside the substation — transformer tanks, switchgear enclosures, structural steel, fence posts, control building steelwork, cable trays — is bonded to this buried grid. When a fault occurs, the entire grid rises in potential together relative to remote earth. The design job is to make sure that rise, and the voltage gradients it produces at the surface, remain within limits that a person standing on the ground can survive if they happen to touch an energized structure at the moment of the fault.
Why this design discipline exists
A ground grid does not simply 'earth' the substation. It orchestrates the flow of fault current so that no accessible point on the substation surface — whether at a fence corner, a transformer base, an operator's walkway, or a gate handle — presents a lethal touch or step voltage during a fault event. Every technical decision in the design chain, from soil model to conductor spacing, serves that end.
The Five Objectives of a Ground Grid
Every substation grounding design must satisfy five objectives simultaneously. Failure on any one of them makes the design unfit for purpose regardless of how well the others are met.
- Ensure personnel safety by limiting step and touch voltages to values below the human fibrillation threshold under the specified fault clearing time.
- Provide a low resistance path for fault current so that ground potential rise remains manageable and protective relays operate reliably.
- Protect equipment and sensitive control systems from the transient overvoltages that accompany power-frequency faults and lightning events.
- Improve lightning performance by providing multiple parallel paths to disperse lightning energy without producing damaging transient potential rise.
- Maintain a stable earth potential reference for the whole substation — a single, well-defined electrical zero against which every equipment case, cable shield, and instrument return is measured.
Anatomy of a Substation Ground Grid
A typical utility substation grounding installation includes seven elements, each with a specific electrical or mechanical role:
- Bare copper conductor — the horizontal grid mesh, typically 70 to 120 mm² cross-section (or larger for high fault duty), buried at 0.5 to 1.0 m depth. Copper is chosen for its low resistivity, high current-carrying capacity, and long service life in soil.
- Ground rods / electrodes — vertical driven rods, typically 2.4 to 3.0 m in length, of copper-bonded steel construction. Rods reach deeper soil layers (usually more conductive) and dominate the grid's resistance when the deeper soil is significantly more conductive than the surface.
- Equipment earthing connections — bonded jumpers from every metallic structure, equipment case, and enclosure to the buried grid, typically via visible above-ground pigtails to permit inspection and testing.
- Bonding conductors — the internal interconnections between the buried mesh, ground rods, and above-ground earthing risers, sized for the fault current they must carry without excessive temperature rise.
- Inspection pits / test links — accessible chambers with disconnectable links, allowing periodic resistance measurement of individual electrodes without dismantling the installation.
- Crushed rock surface layer — a 100 to 150 mm layer of high-resistivity crushed rock (typically 2000 to 5000 Ω·m dry, 1000 to 3000 Ω·m wet) placed over the whole substation yard. This insulating layer dramatically raises the tolerable touch and step voltages and is one of the most cost-effective grounding-safety interventions available.
- Above-ground risers — visible copper straps connecting the buried grid to fence-line, transformer neutrals, surge arrester bases, and lightning down-conductors.
The Design Process Step by Step
Step 1: Measure Soil Resistivity (Wenner 4-Pin Method)
Everything starts with the soil. The Wenner four-pin method drives four electrodes into the ground at equal spacing (a) and measures the resistance between the outer two current electrodes and the inner two potential electrodes. Apparent soil resistivity ρₐ = 2πaR, where R is the measured resistance. The measurement is repeated at multiple spacings — typically 0.5, 1, 2, 5, 10, 20, 50, and 100 m — to sample the resistivity at progressively greater depths. Multiple traverses across the site (typically two perpendicular, plus a diagonal check) confirm the soil is laterally homogeneous.
The raw data is then inverted into a layered soil model using CDEGS RESAP. Two-layer models are adequate for most sites; multilayer models are essential where the geology is stratified (alluvial floodplains, weathered bedrock, mining-impacted terrain). The RMS curve-fit error is the objective measure of model quality — anything below 5% is typically acceptable; higher errors signal that additional data or more layers are needed.
Step 2: Determine Maximum Earth Fault Current (Iₑ)
The design fault current is the single-line-to-ground fault current at the substation, calculated from utility source impedances and the substation's own transformer impedances. But not all of that current flows through the grid — a significant portion returns via overhead shield wires, transmission line neutrals, distribution feeders, and other metallic paths. The fraction that does flow through the grid — the split factor — is what actually drives EPR and touch/step voltages.
CDEGS FCDIST calculates this split factor rigorously by modelling the complete fault current return circuit. The result is a defensible grid current value, typically far lower than the total fault current, based on physics rather than rule-of-thumb assumptions.
Step 3: Select Conductor Material and Size
Copper is the near-universal choice for buried grid conductors: low resistivity, high current-carrying capacity, robust corrosion resistance in most soils. The conductor cross-section is sized by fault current, fault duration, and the maximum permissible temperature rise (typically 250 °C for hard-drawn copper with brazed joints, 450 °C for welded joints). IEEE Std 80 provides the Onderdonk equation and the Sverak equation for this calculation; CDEGS's Output Toolbox performs it automatically.
Typical conductor sizes fall in the 70 to 120 mm² range for standard utility substations, rising to 240 mm² or larger for high-fault-duty transmission substations. Ground rods are typically 2.4 to 3.0 m in length, 16 to 19 mm diameter, copper-bonded steel construction.
Step 4: Design the Grid Layout
The grid geometry — rectangular perimeter with an internal mesh — is sized by the substation footprint, with mesh spacing typically 3 to 7 m. Denser mesh (smaller spacing) produces lower touch voltages at the cost of more conductor; the design balances safety compliance against material cost. Perimeter conductors are extended beyond the fence line where possible to reduce edge-of-grid touch voltages, which are typically the worst case.
Step 5: Add Vertical Ground Rods Where Necessary
Ground rods are added at perimeter corners (where surface voltage gradients concentrate), around surge arrester bases and transformer neutrals (where high-frequency lightning currents need dispersal), and distributed through the grid where deeper conductive soil layers make rods effective at lowering grid resistance.
Step 6: Calculate and Verify
With the geometry defined, CDEGS MALT computes the four critical outputs: grid resistance R_g, ground potential rise GPR = I_f × R_g (where I_f is the grid current from Step 2), touch voltage E_t at every accessible point, and step voltage E_s across the substation surface and beyond the fence line.
Step 7: Verify Against IEEE Std 80 Limits and Optimize
The calculated touch and step voltages are compared against IEEE Std 80 permissible limits, which depend on fault clearing time, body weight assumption (50 kg or 70 kg), surface layer properties, and asymmetry decrement factor. If any point exceeds its limit, the design is modified — added rods, densified mesh, extended perimeter, or thicker crushed rock — and the analysis is repeated until compliance is achieved throughout the site.
CDEGS AutoGroundDesign automates this iteration, systematically modifying grid geometry to reach a defensibly optimal design at minimum material cost.
Key Design Calculations
Ground Potential Rise (GPR)
GPR = I_f × R_g. GPR is the voltage of the entire grid relative to remote earth during the fault. It is the reference potential against which touch and step voltages are measured.
Touch Voltage (E_t)
E_t = GPR × K_t / (1 + K_t), where K_t is the touch voltage coefficient. In physical terms, touch voltage is the voltage a person would experience between their hand (on an energized metallic structure) and their feet (on the soil surface). It is the most common source of grounding-related fatality risk in substations.
Step Voltage (E_s)
E_s = GPR × K_s, where K_s is the step voltage coefficient. Step voltage is the voltage between a person's two feet standing on the ground surface. Step voltages are typically less severe than touch voltages inside a substation but can be significant at the perimeter and near ground rods.
Typical Design Parameters
| Parameter | Typical Value |
|---|---|
| Burial depth | 0.5 – 1.0 m |
| Conductor material | Bare copper (hard-drawn) |
| Conductor size | 70 – 120 mm² (larger for high fault duty) |
| Ground rod length | 2.4 – 3.0 m |
| Ground rod construction | Copper-bonded steel, 16 – 19 mm diameter |
| Surface layer thickness | 100 – 150 mm crushed rock |
| Surface layer resistivity (typical) | 2000 – 5000 Ω·m dry; 1000 – 3000 Ω·m wet |
| Soil resistivity | As measured (site-specific) |
Typical Safety Limits (IEEE Std 80)
The permissible touch and step voltages depend on fault clearing time, body weight, and surface layer conditions. For a 0.25-second fault with a 100 mm crushed rock surface layer at 3000 Ω·m and 100 Ω·m top soil:
| Parameter | Permissible Limit (IEEE 80) | Notes |
|---|---|---|
| Touch voltage E_t | ≤ approx. 720 V | 50 kg body, 0.25 s clearing, crushed rock surface |
| Step voltage E_s | ≤ approx. 2340 V | Same conditions as above |
| Grid resistance R_g | As low as practicable | Typical target: <1 Ω transmission, <5 Ω distribution |
These values are illustrative; the actual limits are recalculated for each project's specific fault clearing time, soil model, and surface layer configuration. CDEGS's Output Toolbox computes them automatically.
The Applicable Standards
- IEEE Std 80 — Guide for Safety in AC Substation Grounding. The most widely used reference worldwide; provides the fibrillation current relationship, foot resistance series expansion, mesh voltage equations, and safety-limit calculation methodology.
- IEC 61936-1 — Power installations exceeding 1 kV AC. Provides European/international framework for substation safety including grounding requirements.
- EN 50522 — Earthing of power installations exceeding 1 kV AC. The European harmonized standard giving touch voltage limits as a function of fault duration.
- AS 2067 / AS/NZS 3000 — Australian/New Zealand equivalents.
- IEEE Std 81 — Guide for measuring earth resistivity, ground impedance, and earth surface potentials of a
grounding system.
Why the CDEGS Workflow Matters
Hand calculations and screening tools can produce results — the question is whether those results are defensible. On a homogeneous site with simple geometry and a modest fault current, a spreadsheet can give reasonable answers. But every real substation has some combination of layered soil, complex geometry, high fault current, sensitive touch-voltage requirements at fence corners, and interaction with adjacent metallic infrastructure. CDEGS handles all of these together in one analytical framework — the same framework recognized by utility engineering departments, regulators, and independent reviewers worldwide.
A Keentel Engineering substation grounding study is not merely a compliance exercise; it is documentation that will be relied upon for the operational life of the asset, referenced during expansion planning, and produced in the event of an incident investigation. Getting the analysis right the first time is our practice.
Benefits of a Well-Designed Ground Grid
- Reduces electric shock hazards to personnel and the public.
- Improves equipment reliability and reduces damage during faults and lightning strikes.
- Provides effective lightning current dissipation.
- Protects control and protection systems from transient overvoltages.
- Meets international safety requirements, protecting the asset owner from regulatory and legal exposure.
A closing principle
A well-designed ground grid is an investment in safety, reliability, and peace of mind. Safety is not expensive — an inadequate grounding design is. Every dollar spent on rigorous analysis and appropriate conductor material is orders of magnitude cheaper than the cost of a single serious incident.
Case Study
Case Study 1: 138/34 kV Utility Transmission Substation Grounding Design
Client and Project Profile
Client: Confidential transmission utility, sub-tropical service region. Asset: New 138/34 kV bulk-supply substation, 2 × 50 MVA transformers, 25 kA symmetrical fault duty at 138 kV bus. Scope: Full grounding grid design, EPR study, touch/step voltage verification, transferred potential analysis. Tools: CDEGS — RESAP, FCDIST, MALT, AutoGroundDesign. Standards: IEEE Std 80, IEEE Std 81, and jurisdictional utility grounding standard.
Background
A transmission utility commissioned a new 138/34 kV bulk-supply substation to relieve loading on an adjacent legacy substation and to accommodate projected demand growth from a nearby industrial estate. The site was located on cleared agricultural land with historical rainfall records showing significant seasonal soil moisture variation. The utility's internal engineering standard required grounding design certified against IEEE Std 80 with the jurisdictional utility grounding standard as an overlay, plus post-installation resistance verification within ±20% of the design prediction.
The design fault current was substantial — 25 kA symmetrical at the 138 kV bus, driven by strong utility source impedance from a nearby generation hub. Preliminary uniform-soil hand calculations, using a single averaged apparent resistivity, suggested that grid resistance would be around 0.7 Ω and EPR around 17.5 kV — a level at which transferred potential onto outgoing 34 kV distribution feeders and telecommunications infrastructure would demand explicit analysis. Before accepting these preliminary numbers, Keentel Engineering was engaged for a rigorous CDEGS-based study.
Engineering Challenge
Three technical issues required careful treatment:
- The site's soil showed significant vertical layering (surface clay over weathered granite over fresh granite bedrock), meaning a uniform-soil approximation would misrepresent both grid resistance and voltage distribution.
- Six incoming and outgoing transmission and distribution circuits meant a substantial portion of the fault current would return via shield wires and neutrals rather than through the local grid. Quantifying this split factor accurately was essential to avoid over-design.
- The high fault current and consequent high GPR made transferred potential onto outgoing 33 kV feeders and telecommunications cables a design driver requiring dedicated analysis.
Approach
Step 1: Soil Investigation and Modelling
A Wenner four-pin survey was conducted across three traverses (two perpendicular, one diagonal) with electrode spacings from 1 m to 100 m. Apparent resistivity ranged from 55 Ω·m at 1 m spacing to 620 Ω·m at 100 m spacing, confirming significant vertical stratification. RESAP fitted a three-layer soil model: 1.5 m surface clay at 78 Ω·m, 12 m weathered granite at 240 Ω·m, and deep fresh granite bedrock at 1,850 Ω·m. RMS curve-fit error was 3.2%, well within acceptance.
Step 2: Fault Current Distribution Analysis
FCDIST modelled the two incoming 132 kV lines (both with double shield wires), the four outgoing 33 kV feeders (single earth-continuity conductors), and the remote source impedances derived from the utility's fault-level letter. The split factor calculation returned a grid current of 9.4 kA — 37.6% of the total 25 kA fault current. This was significantly lower than the 100% conservative assumption used in the preliminary hand calculation and drove a proportional reduction in the required grid design severity.
Step 3: Initial MALT Analysis
An initial grid design used a 6 m × 6 m mesh over the 65 m × 80 m substation footprint, 32 perimeter ground rods of 3.0 m length, 0.6 m burial depth, and a 100 mm crushed rock surface layer at 3,000 Ω·m dry resistivity. MALT results:
| Parameter | Result | IEEE Std 80 Limit | Status |
|---|---|---|---|
| Grid resistance R_g | 0.52 Ω | As low as practicable | Acceptable |
| Earth potential rise | 4,890 V | N/A | Reference for transferred potential |
| Peak touch voltage E_t | 684 V | 720 V (0.20 s clearing) | Marginal (95% of limit) |
| Peak step voltage E_s | 218 V | 2,340 V | Well within limit |
The initial design met all limits but had only a 5% touch-voltage margin at the worst fence corner — insufficient safety margin against the ±20% resistivity uncertainty expected from seasonal soil moisture variation. Optimization was needed.
Step 4: AutoGroundDesign Optimization
AutoGroundDesign iterated the grid geometry to improve the touch voltage margin without increasing footprint. The optimized configuration densified mesh to 4 m × 4 m in the two worst-affected corner zones, added eight 4.5 m ground rods at the corners, added six ground rods around the two transformer bases where fault current injection was concentrated, and extended two perimeter conductors 1.2 m outside the fence line to smooth edge gradients. The optimized MALT results returned a peak touch voltage of 542 V — 25% below the limit, with corresponding margin against soil parameter uncertainty.
Step 5: Transferred Potential Analysis
With the 4,890 V EPR, transferred potential onto outgoing 33 kV feeder shield wires and telecommunications cables was assessed. SPLITS modelling of each outgoing circuit calculated the transferred voltage at feeder end points and telecom termination points. Two of the four 33 kV feeders showed transferred potentials above 430 V at their first tee-off point — a level requiring either isolation transformers on any customer-connected metallic services or fiber-optic conversion for telecommunications. The recommendation to the client was fiber-optic conversion for the telecommunications link (already planned for other reasons), and a supplementary earth mat at the tee-off point of the two affected feeders to reduce transferred potential to acceptable levels.
Step 6: Sensitivity Analysis
A ±20% variation in each soil layer resistivity, a ±15% variation in fault current, and a ±25% variation in fault clearing time were applied. The optimized design remained within touch and step voltage limits under all sensitivity cases, with the worst-case combined scenario still leaving 12% margin against the touch voltage limit.
Outcome
The certified grounding design was submitted with the substation commissioning documentation and accepted by the utility's engineering standards group on the first review. Post-installation fall-of-potential measurement returned a grid resistance of 0.48 Ω — 8% below the CDEGS-predicted 0.52 Ω, within the ±20% acceptance band and consistent with typical soil moisture at the time of test. The transferred potential mitigations were implemented in coordination with the feeder commissioning schedule.
Key technical lessons
1. The three-layer soil model produced touch voltage predictions substantially different from a uniform-soil approximation — critical for both design safety and cost.
2. The 37.6% fault current split (versus the 100% conservative assumption) directly translated into material savings while preserving safety margins.
3. Transferred potential analysis for high-EPR transmission substations is not an optional add-on; it is integral to the study and often drives design decisions on outgoing infrastructure that were not initially in the client's scope.
Case Study 2: Grounding Study for a Copper Concentrator Plant 66/11 kV Substation
Client and Project Profile
Client: Confidential base-metals mining operator. Asset: 66/11 kV primary intake substation for a copper concentrator plant, 2 × 25 MVA transformers, 18 kA symmetrical fault duty at 66 kV bus. Scope: Grounding design accounting for extensive interconnected metallic infrastructure (mill motors, process piping, overhead crane rails, rebar in reinforced concrete plant floor); integration with plant-wide equipotential bonding. Tools: CDEGS — RESAP, FCDIST, MALT, MALZ. Standards: IEEE Std 80, IEC 61936-1, and mining-industry earthing code.
Background
The client operated a copper concentrator plant in a semi-arid inland region. The plant electrical intake substation was located adjacent to the primary mill building, which housed two 8 MW ball-mill motors, a SAG mill, thickeners, flotation cells, and extensive process piping. The mill building's structural steel, concrete floor rebar, and equipment enclosures formed a dense metallic mesh electrically continuous with the substation grounding grid via multiple bonding paths — a classic 'extended grounding system' problem where the substation grid alone was not the complete earthing system.
Two years earlier, the plant had experienced a phase-to-earth fault on a mill motor cable that produced an unexpectedly high touch voltage measurement at a plant equipment operator station approximately 40 m from the substation. Investigation had traced the incident to inadequate bonding between the mill building's steel and the substation grid; no injury had occurred, but the incident report had recommended a complete grounding redesign. The redesign scope was awarded to Keentel Engineering following a competitive tender.
Engineering Challenge
The technical problem set was unusually rich:
- The substation grid alone was not the effective earthing system. The mill building's structural steel, concrete rebar, and equipment forming a continuous metallic system extending 60 m × 90 m adjacent to the substation had to be modelled as part of the earthing system.
- Very-high-conductance process water piping (large-bore steel, wet interior) further extended the effective grid to several hundred metres, providing paths for fault current dispersion that were beneficial for grid resistance but confusing for touch voltage distribution.
- Semi-arid soil conditions produced very high dry-season resistivity (site measurements returned surface layer resistivity in excess of 2,400 Ω·m), making standard grid rod effectiveness poor and driving the need for deeper electrodes or conductive backfill.
- The mining industry's earthing code required documented equipotential bonding between the substation, the plant, and all worker access points — a scope substantially wider than a conventional substation grounding study.
Approach
Step 1: Soil and Site Characterization
Wenner surveys were conducted at four locations spanning the substation, the mill building floor, the pump-house, and the tailings pipeline access track. Surface layer resistivities ranged from 2,400 to 3,800 Ω·m in dry conditions; a distinct conductive layer at 25 to 40 m depth (attributed to a shallow water table below fresh volcanic bedrock) offered resistivities in the 40 to 90 Ω·m range. RESAP fitted three-layer models at each location, with the deep conductive layer as the critical feature — no economic grid design could achieve acceptable resistance without reaching this layer via deep electrodes.
Step 2: Extended Earthing System Model
The MALT model was built to include: the substation grid (60 m × 45 m rectangular mesh, 5 m × 5 m spacing, 24 perimeter rods); the mill building floor rebar (represented as an equivalent buried mesh at 0.2 m depth with equivalent conductor spacing based on the documented rebar layout); the mill building structural steel (represented as vertical conductors connecting the roof-level bonding ring to the floor slab); the process water piping (represented as horizontal conductors at the actual pipe burial depth); and the interconnecting bonding conductors between substation grid and mill building at their four documented bond points.
The bonding audit as the first step
Before any computational modelling, a physical bonding audit was conducted at the site. The audit found that only two of the four documented substation-to-mill bond connections were electrically continuous — the other two had failed due to bolt corrosion at above-ground connection points. The measured bond resistance at the failed points was 4.7 Ω and 6.2 Ω respectively, effectively open-circuit for fault-current purposes. This finding, made before any CDEGS work, was the direct explanation for the two-year-old incident: the fault current had been forced through fewer paths, producing higher local voltage rise at the operator station. The audit finding was documented as an immediate remediation item, independent of the redesign scope.
Step 3: Deep Electrode Design
With conventional 3 m ground rods effective only in the poor surface soil, a deep electrode strategy was developed. Four 30 m deep-driven copper-bonded steel electrodes were specified, distributed at the corners of the substation grid to reach the conductive layer at 25 to 40 m depth. Modelling confirmed that these deep electrodes would carry approximately 62% of the total fault current dispersion despite representing less than 3% of the total buried conductor length — a highly effective use of material given the site's soil profile.
Step 4: Grid Analysis Results
The complete extended earthing model was analyzed for the design fault current of 18 kA at 66 kV, with FCDIST-derived grid current of 11.2 kA (62.2% split factor — higher than typical because the plant offered fewer alternative return paths than a utility substation with multiple shield-wired incoming lines):
| Parameter | Result | IEEE Std 80 Limit | Status |
|---|---|---|---|
| Grid resistance R_g (extended system) | 0.34 Ω | As low as practicable | Excellent (deep electrode contribution) |
| Earth potential rise | 3,808 V | N/A | Reference |
| Peak touch voltage (substation) | 486 V | 720 V (0.25 s) | Within limit |
| Peak touch voltage (mill building floor) | 412 V | 720 V | Within limit |
| Peak touch voltage (previously affected operator station) | 398 V | 720 V | Compliant |
| Step voltage (worst case, fence perimeter) | 298 V | 2,340 V | Within limit |
The redesigned system demonstrated compliance across all worker-accessible locations, including the previously affected operator station.
Step 5: Equipotential Bonding Specification
A dedicated equipotential bonding specification was developed as part of the deliverable, covering: mandatory bonding of every metallic penetration between the substation and the plant (piping, cable trays, structural connections), specification of bolted connections with anti-corrosion measures and annual inspection requirements, dedicated bonding of all worker-access platforms, gates, and handrails to the extended grid via visible above-ground bonds, and periodic testing intervals (initially six-monthly, transitioning to annual once stability was demonstrated).
Outcome
The redesign was implemented in a phased 14-month program, coordinated with planned plant shutdown windows. Post-installation testing at three reference locations returned grid resistances within 12% of CDEGS predictions. The equipotential bonding specification was adopted as a plant standard document and became part of the client's process safety management system. Three years after commissioning, no earthing-related incident has been reported.
Key technical lessons
1. Industrial substation grounding is not just about the grid — it is about the extended earthing system formed by all electrically continuous metallic infrastructure. Modelling the substation grid in isolation is systematically wrong on plant sites.
2. Physical bonding audit before any modelling is essential; the model's assumption of continuity between components must be verified in the field.
3. Deep electrodes reaching a conductive strata below poor surface soil can transform grid effectiveness and are often the highest-leverage design intervention on high-resistivity sites.
4. On industrial sites, the earthing study deliverable must extend beyond substation compliance to include a plant-wide equipotential bonding specification integrated into the operator's safety management framework.
Case Study 3: Solar Farm Grid-Connection Substation and Tracker Field Grounding
Client and Project Profile
Client: Confidential renewable energy developer. Asset: 180 MW single-axis-tracking utility-scale solar farm with 132 kV grid-connection substation, spanning approximately 380 hectares. Scope: Grounding design for the 132/33 kV grid-connection substation, plus interconnection with the tracker-field earthing system spanning the full solar array. Tools: CDEGS — RESAP, FCDIST, MALT, HIFREQ (for lightning transient analysis of tracker fields). Standards: IEEE Std 80, IEC 61936-1, IEC 62305 (lightning protection), and jurisdictional grid connection code.
Background
A renewable energy developer commissioned a 180 MW utility-scale solar farm with single-axis tracking, spread over 380 hectares of former grazing land. The plant featured approximately 380,000 PV modules organized in tracker rows, 78 MV inverter-transformer skid units, an internal 33 kV collector network, and a single 132/33 kV grid-connection substation at the point of common coupling with the utility transmission network.
The grounding scope was unusual for a utility engagement. The grid-connection substation itself required conventional IEEE Std 80 treatment — but the site also required an integrated earthing design for the tracker field: approximately 4,300 tracker piles driven into the ground across the array, each a potential lightning strike attachment point and each electrically bonded to its adjacent tracker row and ultimately to the collector network's neutral system. The utility's grid connection code required that the substation ground grid, the collector network earthing, and the tracker-field earthing form a coherent, verified earthing system.
Engineering Challenge
Three interlocking design problems:
- The 132/33 kV substation required standard grounding design for the utility-side fault current, but had to account for the tracker-field earthing contribution to overall grid resistance — potentially reducing required substation grid material substantially.
- The tracker field, spread over 380 hectares, required lightning attachment and dispersion analysis. Each tracker pile is a potential attachment point; each strike must disperse without producing dangerous voltages at adjacent modules or personnel access points.
- Site soil resistivity varied significantly across the 380 hectare footprint (ranging from 220 Ω·m in a low-lying section to 1,800 Ω·m on a raised ridge), requiring zonal treatment of the earthing design rather than a single-model approach.
Approach
Step 1: Zonal Soil Characterization
Wenner surveys were conducted at nine locations distributed across the 380 hectare site, chosen to sample each identifiable geological zone plus the substation footprint. Three-layer soil models were fitted at each location; results were interpolated to produce a zone map with four distinct soil regions:
- Zone A (low-lying, alluvial): surface layer 180 Ω·m, deep layer 90 Ω·m — most conductive.
- Zone B (agricultural loam, majority of site): surface 350 Ω·m, deep layer 220 Ω·m — moderate.
- Zone C (weathered ridge soils): surface 780 Ω·m, deep layer 650 Ω·m — poor.
- Zone D (substation site, mixed): surface 240 Ω·m, deep layer 180 Ω·m — good conditions for substation grid.
Step 2: Substation Grid Design
The 132/33 kV substation grid was designed following the standard process: FCDIST split-factor analysis with the utility-side network returned a grid current of 8.7 kA (from a total fault current of 22 kA), and MALT analysis with a 5 m × 5 m mesh, 24 perimeter rods, and 100 mm crushed rock surface layer achieved 0.42 Ω grid resistance, 3,654 V EPR, and 524 V peak touch voltage — comfortably within limits.
Step 3: Tracker-Field Earthing Contribution
The tracker piles form a distributed earthing system of roughly 4,300 electrodes spread over 380 hectares. Each tracker pile is a driven H-section steel pile 2 to 3 m deep, bonded via the tracker torque tube to the row-level earthing conductor, then to the collector network's earthing system, and ultimately to the substation grid via the 33 kV cable armour and equipment earthing risers at each inverter skid.
Modelling all 4,300 piles individually would exceed practical model size limits. An equivalent-conductor approach was used: each tracker row (typically 90 piles) was represented as an equivalent horizontal conductor with the row's actual footprint, and the interconnection to the collector network was represented explicitly. The equivalent-conductor characteristics were calibrated against a fine-detail model of a single representative row, ensuring the aggregate effect was correctly captured.
The result was striking. When the tracker-field earthing was included in the overall system, the effective grid resistance seen from the substation was 0.11 Ω — approximately one-quarter of the substation-grid-alone value. The tracker field, though its individual pile resistances were poor, added so much distributed earthing surface area that its aggregate contribution dominated the system's resistance.
Step 4: Lightning Attachment and Dispersion Analysis
For lightning protection analysis, HIFREQ was used to model the transient response of a representative tracker row to a direct 100 kA lightning strike per IEC 62305 Class II. The analysis produced the transient voltage rise at the struck pile, at adjacent piles, at nearby module frames (touch-voltage relevant for maintenance personnel), and at the collector-network termination:
| Location | Peak Transient Voltage | Time to Peak | Assessment |
|---|---|---|---|
| Struck pile (attachment point) | 78 kV | 1.2 μs | Local flashover expected; managed by insulator design |
| Adjacent tracker pile (row-mate) | 42 kV | 1.8 μs | Within cable insulation withstand |
| Module frame (2 m from strike) | 6.4 kV | 2.4 μs | Within maintenance-access safety threshold with grounding wristband use |
| Collector network termination (worst inverter skid) | 1,240 V | 8.7 μs | Within LV equipment withstand |
The tracker-field earthing distributed the lightning energy effectively; no design changes to the pile earthing were required. A recommendation was documented that maintenance personnel wear grounding wristbands during work within 5 m of any tracker pile during electrical storm warnings — a low-cost operational control appropriate to the residual risk.
Step 5: Integrated System Verification
With the substation, tracker-field, and collector network models integrated, the overall system was verified for a 132 kV substation-bus fault (worst-case power-frequency event) and for a 100 kA lightning strike at various points across the tracker field. Touch and step voltages remained within limits throughout, and no additional design interventions were required beyond the base configuration.
Outcome
The integrated earthing design was submitted with the grid connection application and accepted without amendment by the utility's grid connection engineering group. Post-installation testing of the substation grid resistance returned 0.09 Ω (with the tracker field connected), compared with the CDEGS prediction of 0.11 Ω — well within acceptance and demonstrating that the aggregate tracker-field earthing contribution was accurately captured by the equivalent-conductor modelling approach. The developer commissioned the plant on schedule.
Key technical lessons
1. Solar-farm grounding is not a substation grounding problem in isolation; it is an integrated system spanning tens or hundreds of hectares of tracker-field earthing plus the grid-connection substation, and the two interact strongly. Modelling the substation alone systematically overstates the required substation grid material.
2. Zonal soil characterization is essential on large-footprint renewable sites; a single soil model averaged across the whole plant leads to misdesign in the outlying zones.
3. Equivalent-conductor representation of large regular electrode fields (tracker piles, wind turbine foundations) is a practical alternative to explicit modelling of every electrode, and correctly calibrated it produces excellent aggregate results.
4. Lightning protection analysis of tracker fields is a required — not optional — part of solar farm grounding scope; the exposed area, the metallic mass, and the field-crew access patterns all combine to make lightning a first-order safety concern.
10 In-Depth Technical Questions on Substation Grounding Design
Q1. How Do I Know If a Two-Layer Soil Model Is Sufficient, or If I Need Multilayer?
The RMS curve-fit error produced by CDEGS RESAP is the direct indicator. If a two-layer model fits the Wenner measurements with an RMS error below approximately 5%, it is generally adequate for grounding design. Errors of 5 to 10% suggest the two-layer approximation is stretching; errors above 10% indicate that additional layers are required to represent the true soil structure.
Geological context also matters. Sites with weathered bedrock underlain by fresh rock, alluvial deposits with distinct layers, frozen or permafrost zones, and mining-affected ground almost always require three or more layers. Coastal sites with brackish groundwater at shallow depth also demand explicit modelling of the salinity discontinuity. Where the geology is known to be complex, we default to multilayer from the outset — no engineering time saved by fighting the data.
The practical consequence of using an inadequate soil model is significant. A two-layer approximation to a genuinely three-layer soil can produce touch voltage predictions off by 30% or more, in either direction. A predicted 'safe' design can be unsafe; a predicted 'unsafe' design can be over-engineered at the client's expense. Neither outcome is acceptable.
Q2. What Is the Grid Current, and Why Isn't It Just the Total Fault Current?
The grid current I_g is the portion of the total single-line-to-ground fault current that actually returns through the local grounding grid to the earth. It is what drives EPR, touch voltages, and step voltages — not the total fault current.
The rest of the fault current returns via alternative metallic paths: overhead shield wires on incoming transmission lines, transmission line neutrals, distribution feeder neutrals, cable sheaths, and adjacent metallic infrastructure. On a typical utility substation with two or three incoming lines with shield wires, only 20 to 50% of the fault current actually flows through the grid. Assuming 100% is a common conservative approximation that leads to substantial over-design.
CDEGS FCDIST calculates the split factor rigorously by building the complete return-circuit network: local grid, shield wires and their end-of-line grounding, remote source impedances, and any auxiliary return paths. The result is defensible and typically saves substantial conductor material compared to the 100% assumption. On projects where the site footprint is constrained, this analysis can also be the difference between a compliant design and an infeasible one.
Q3. Where Do the Worst Touch and Step Voltages Occur?
The worst touch voltages typically occur at the corners of the grid perimeter, at the interface between the grid and the substation fence, and immediately adjacent to structures with high fault-current contribution (transformer bases, surge arresters, main circuit-breaker structures). At the perimeter corners, the current density in the surface soil is highest and the equipotential lines are compressed, producing steep voltage gradients.
Step voltages are worst just outside the grid perimeter, where the ground potential rise decays rapidly with distance. This is why the fence line and the immediate exterior of the fence are focal points for touch and step voltage analysis — a member of the public standing at the fence during a fault event faces the highest exposure.
Standard mitigations for perimeter hot spots include extending perimeter conductors 0.5 to 1.5 m beyond the fence line, adding corner ground rods, densifying mesh at corners, and installing gradient-control conductors under the fence to smooth the voltage transition from inside to outside.
Q4. What Is the Role of the Crushed Rock Surface Layer, and How Much Does It Help?
The crushed rock surface layer is one of the highest-value grounding safety interventions available per unit cost. Its function is to insulate the soles of a person's feet from the underlying soil during a fault event. Because the human body's fault current path is body-plus-foot-resistance-to-earth, raising the foot resistance dramatically raises the permissible touch and step voltages.
A 100 mm layer of crushed rock at 3000 Ω·m dry resistivity typically raises the permissible touch voltage from around 267 V (bare soil at 100 Ω·m) to around 720 V — a 2.7× increase. The exact multiplier depends on the actual crushed rock resistivity (which drops significantly when wet), the underlying soil resistivity, and the layer thickness. CDEGS's Output Toolbox handles the series-expansion calculation of foot resistance in the presence of the layer automatically per IEEE Std 80.
Practical points: use clean, angular crushed rock with minimum fines (fines lower the resistivity); specify a minimum thickness of 100 mm, preferably 150 mm; maintain the layer over the substation's operational life (weathering and infiltration reduce effective resistivity); and take account of drainage — waterlogged crushed rock loses most of its resistivity benefit.
Q5. Do I Need to Model Reinforced Concrete Foundations Explicitly?
Generally no. Concrete embedded in soil takes on approximately the same resistivity as the surrounding soil, because both are dominated by moisture content. The rebar's contribution to grounding is essentially the same as if the concrete were replaced by soil of equivalent resistivity.
When the rebar is bonded to the grounding grid — which is standard practice for any concrete structure inside the substation — the foundation acts as an effective equipotential surface, and touch voltages above it are not a design concern. This is consistent with IEEE Std 80 Section 14.6.
For most designs, the foundation can be omitted from the CDEGS model without loss of accuracy. Where the foundation is very large (transformer plinths, control building slab), it can be represented approximately as a horizontal grid of conductors at the rebar depth, connected to the main grid at documented bond points. This adds fidelity but rarely changes the overall grounding result significantly.
Q6. How Do I Handle Conductive Backfill (Bentonite, GEM) Around Ground Rods?
Conductive backfill is used where local soil is high-resistivity and ground rod effectiveness needs boosting — the rod-to-earth contact is improved by surrounding the rod with a low-resistivity material like Bentonite (typically 2 to 3 Ω·m) or manufactured GEM (Ground Enhancement Material) products (often 0.1 to 1 Ω·m).
Two modelling approaches are used in CDEGS. In MALT, the conductor diameter is increased to represent the backfill volume — a 16 mm ground rod inside a 300 mm diameter backfilled hole is modelled as a 300 mm diameter conductor. This is valid when the backfill resistivity is at least an order of magnitude lower than the surrounding soil. In MALZ or HIFREQ, the backfill is modelled as an explicit coating on the rod, with its actual thickness and actual backfill resistivity — a more rigorous representation used when frequency-dependent analysis is required.
Practical caveat: conductive backfill materials degrade over time as they dry out, particularly in surface-drained soils. Bentonite requires stable moisture to maintain conductivity; manufactured GEM products have longer service life but are more expensive. The design should account for realistic long-term resistivity, not just the as-installed value.
Q7. What Fault Clearing Time Should Be Used in the Safety Calculation?
The fault clearing time T_f in the fibrillation current calculation I_f = 0.116 / √T_f is the total time from fault inception to fault current interruption at the substation — i.e., relay operating time plus circuit breaker operating time, including any intentional time delay for coordination with downstream protection.
For a modern transmission substation with distance protection and high-speed breakers, T_f is typically 100 to 150 ms for the primary protection zone (5 cycles + relay operating time). For backup protection zones or downstream distribution substations, T_f can extend to 500 ms or longer, and the safety limits are correspondingly stricter.
The design must consider both primary and backup clearing times. Best practice is to design to the primary clearing time (typically 100 to 250 ms) and verify that the design also meets acceptance criteria under backup clearing (typically 500 to 1000 ms). Where backup protection is significantly slower — as in some industrial and remote-terminal configurations — the backup case can become the design driver, and requires appropriate documentation
Q8. How Do I Handle a Site Where the Substation Footprint Is Constrained?
Constrained-footprint grounding is one of the more challenging design problems. The grid perimeter cannot be extended, the mesh can only be densified within the available space, and touch voltage limits at the fence line are typically the binding constraint.
The standard tool-set of interventions, in order of typical cost-effectiveness: increase the surface crushed rock layer resistivity (specify higher-quality rock) or thickness (up to 150 mm); densify mesh at fence corners and perimeter zones where voltage gradients are steep; add strategically placed ground rods around the perimeter and at surge arrester and transformer bases; install gradient-control conductors buried outside the fence line to smooth the transition from grid interior to remote earth; and — as a last resort — extend the electrical grid perimeter beyond the physical fence line via buried conductors, even if the fence itself cannot move.
Where the geology permits, deep-driven electrodes (10 to 30 m deep) that reach a conductive strata below the surface layer can dramatically reduce grid resistance without requiring additional footprint. CDEGS multilayer modelling is essential in this case — deep electrode effectiveness depends entirely on the layered soil model being accurate
Q9. What Post-Installation Testing Should Be Performed to Verify the Design?
Two categories of test are standard: grid resistance measurement, and touch/step voltage measurement.
Grid resistance is typically measured using the fall-of-potential method (per IEEE Std 81). A current is injected between the grid under test and a remote current electrode; the potential is measured at points along a line between the two. The measured resistance at the point where the potential curve is flattest — typically 61.8% of the distance to the current electrode for uniform soil — is the grid resistance. The measurement result should agree with the CDEGS prediction within approximately ±20%, allowing for soil moisture variation and unmodelled local factors.
Touch and step voltage verification requires energizing the grid at a controlled current (typically via a step-down transformer configured as a current source) and measuring the voltage at accessible surface points using a body-resistance-equivalent voltmeter. This is more involved and is typically reserved for high-risk installations or post-incident investigation. The measured touch voltage per unit of injected current, scaled up to the design fault current, should agree with the CDEGS prediction within ±25%.
Discrepancies larger than these thresholds warrant investigation — usually attributable to soil moisture at time of test, undocumented parallel metallic paths, or actual departures from the design as-built.
Q10. How Do I Handle High-Fault-Current Transmission Substations Where GPR May Exceed 5 kV?
Transmission substations at 132 kV and above can experience GPR values of 5 to 15 kV or more during fault events. At these levels, additional design considerations apply beyond the standard touch/step voltage analysis:
Transferred potential — GPR can appear at remote locations via cable shields, telecommunications lines, and other conductive paths leaving the substation. These transferred potentials can produce touch voltage hazards at remote endpoints (customer premises, telecom exchanges, etc.) and require explicit analysis and mitigation.
Insulation coordination — control cable insulation, instrument transformer secondary insulation, and equipment neutral insulation must withstand GPR without breakdown. This drives cable specification and requires coordination with the protection engineering team.
Isolation transformers and fiber-optic communication — high-GPR substations increasingly use fiber-optic communication for outgoing links to eliminate transferred potential risk on copper conductors.
Surge arrester coordination — surge arrester ground connections carry significant portions of lightning current, and their local grounding must handle transient GPR without producing damaging insulation stress on adjacent equipment. HIFREQ and FFTSES analysis is often applied to verify transient performance.
For substations in this class, Keentel Engineering typically extends the grounding study to include transferred potential analysis, transient GPR from lightning, and explicit coordination with the protection and control engineering scope. The base grounding grid design is the foundation, but the full study integrates several allied disciplines.
Closing Note — The Keentel Engineering Grounding Practice
Substation grounding is one of the disciplines where CDEGS-based analysis delivers its clearest value. The physics is unforgiving — get it right and the installation performs safely for decades; get it wrong and the consequences range from regulatory non-compliance through equipment damage to fatal accidents. Between those two outcomes sits engineering rigor, and the CDEGS suite is the analytical framework that puts that rigor within reach of every substation project we deliver.
Volume I of this technical series introduced the CDEGS suite and its computational modules. This Volume II has applied that framework to substation grounding design in depth: the workflow, the standards, the practical modelling considerations, and three case studies drawn from utility, industrial, and renewable-generation practice. Subsequent volumes will extend the treatment into AC interference on pipelines, lightning and transient studies, and specialized topics including HVDC grounding and post-incident forensic investigation.
For enquiries about Keentel Engineering's
power system studies services substation grounding, AC interference, protection, and allied disciplines — please contact our engineering practice.

About the Author:
Sandip "Sonny" R. Patel, P.E.
IEEE Senior Member · Founder & CEO, Keentel Engineering
In 1995, Sonny Patel earned his Electrical Engineering degree from the University of Illinois. But degrees don't build legacies — action does.
For three decades, he has worked the power industry from every side of the table: 16 years as a utility engineer at Exelon/Commonwealth Edison; generation leadership across hydroelectric, industrial steam turbine, and a 9 GW renewable fleet; NERC Regional Entity Senior Compliance Engineer and Audit Team Lead, auditing some of the nation's largest utilities; and testing and commissioning lead on equipment up to 765 kV — the very top of the North American grid.Utility. Generator. Regulator. Consultant. Few engineers have seen all four seats. Fewer still have sat in them.
His experience spans nuclear, hydro, conventional generation, renewables, oil and gas, mining — and today's data centers, where he is authoring a three-book series on data center design. He is a Licensed Professional Engineer in six states and a Licensed Electrical Contractor in Florida (Unlimited EC) — he doesn't just design the work; he's qualified to stand behind its execution.Today, as Founder and CEO of Keentel Engineering, Sonny leads a nationwide team of engineers delivering substation design, power system studies, NERC compliance, and commissioning — done right, coast to coast.Three decades. Every side of the table. One standard: accountable engineering.
Services

Let's Discuss Your Project
Let's book a call to discuss your electrical engineering project that we can help you with.
About the Author:
Sandip "Sonny" R. Patel, P.E.
IEEE Senior Member · Founder & CEO, Keentel Engineering
In 1995, Sonny Patel earned his Electrical Engineering degree from the University of Illinois. But degrees don't build legacies — action does.
For three decades, he has worked the power industry from every side of the table: 16 years as a utility engineer at Exelon/Commonwealth Edison; generation leadership across hydroelectric, industrial steam turbine, and a 9 GW renewable fleet; NERC Regional Entity Senior Compliance Engineer and Audit Team Lead, auditing some of the nation's largest utilities; and testing and commissioning lead on equipment up to 765 kV — the very top of the North American grid.
Utility. Generator. Regulator. Consultant. Few engineers have seen all four seats. Fewer still have sat in them.
His experience spans nuclear, hydro, conventional generation, renewables, oil and gas, mining — and today's data centers, where he is authoring a three-book series on data center design. He is a Licensed Professional Engineer in six states and a Licensed Electrical Contractor in Florida (Unlimited EC) — he doesn't just design the work; he's qualified to stand behind its execution.
Today, as Founder and CEO of Keentel Engineering, Sonny leads a nationwide team of engineers delivering substation design, power system studies, NERC compliance, and commissioning — done right, coast to coast.Three decades. Every side of the table. One standard: accountable engineering.
Leave a Comment
Thank you for contacting us.
We will get back to you as soon as possible.
We will get back to you as soon as possible.
Oops, there was an error sending your message.
Please try again later.
Please try again later.
Related Posts
By SANDIP R PATEL
•
September 9, 2026
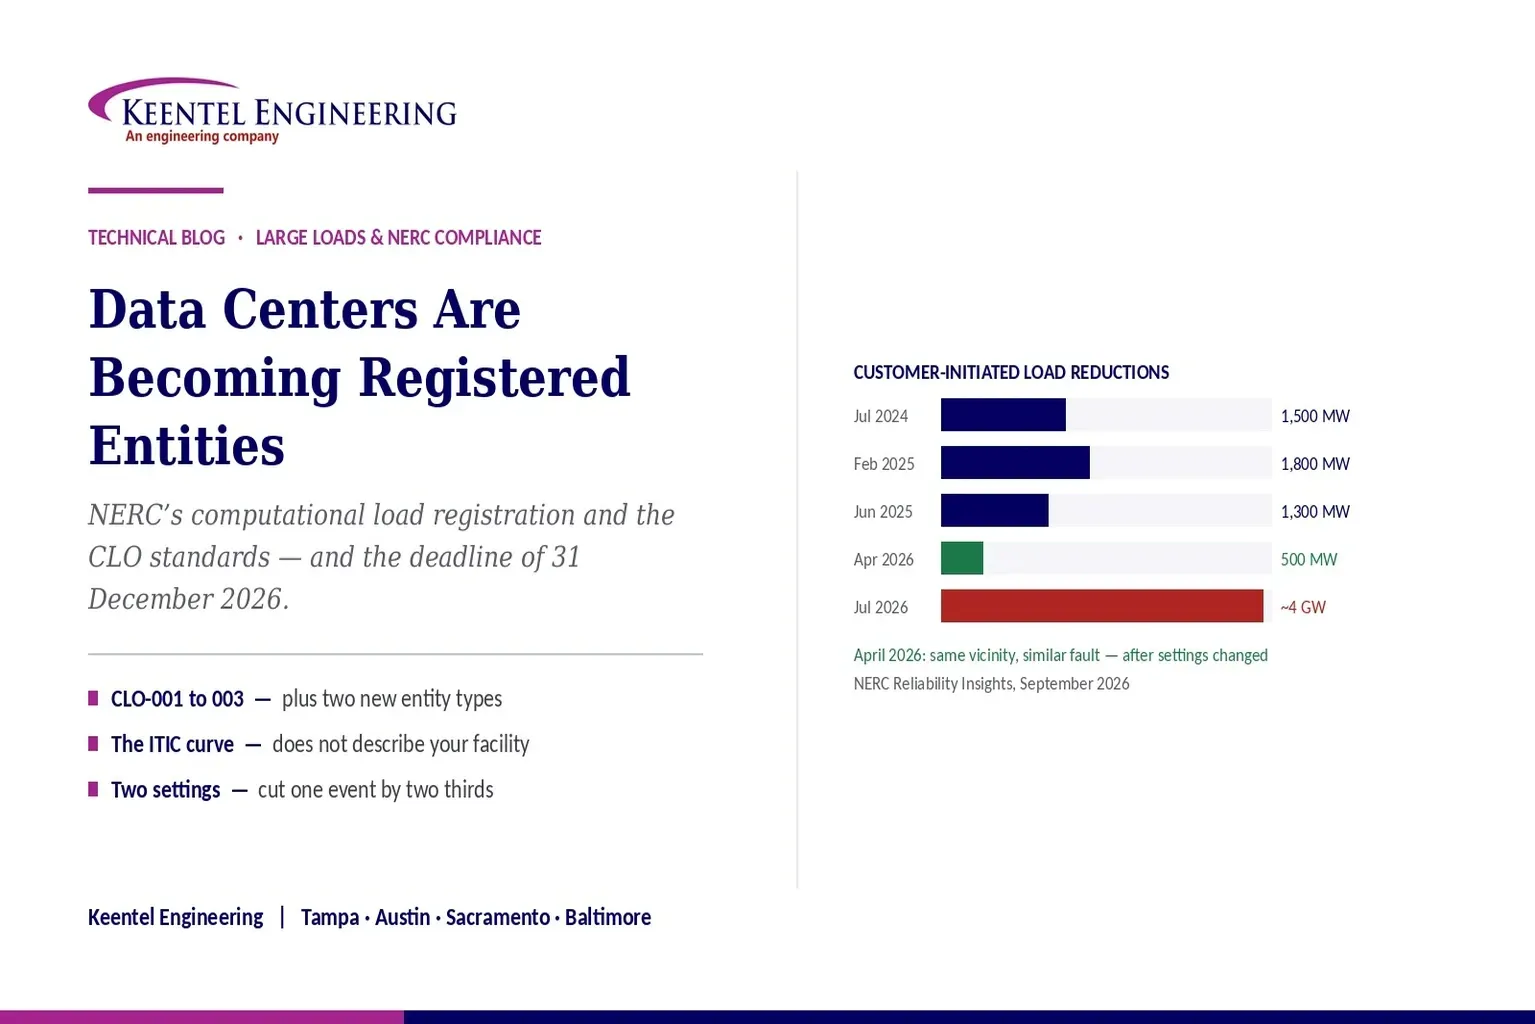
Learn how NERC computational load registration impacts data centers, CLO standards, ride-through requirements, modeling, and grid reliability compliance.
By SANDIP R PATEL
•
September 7, 2026
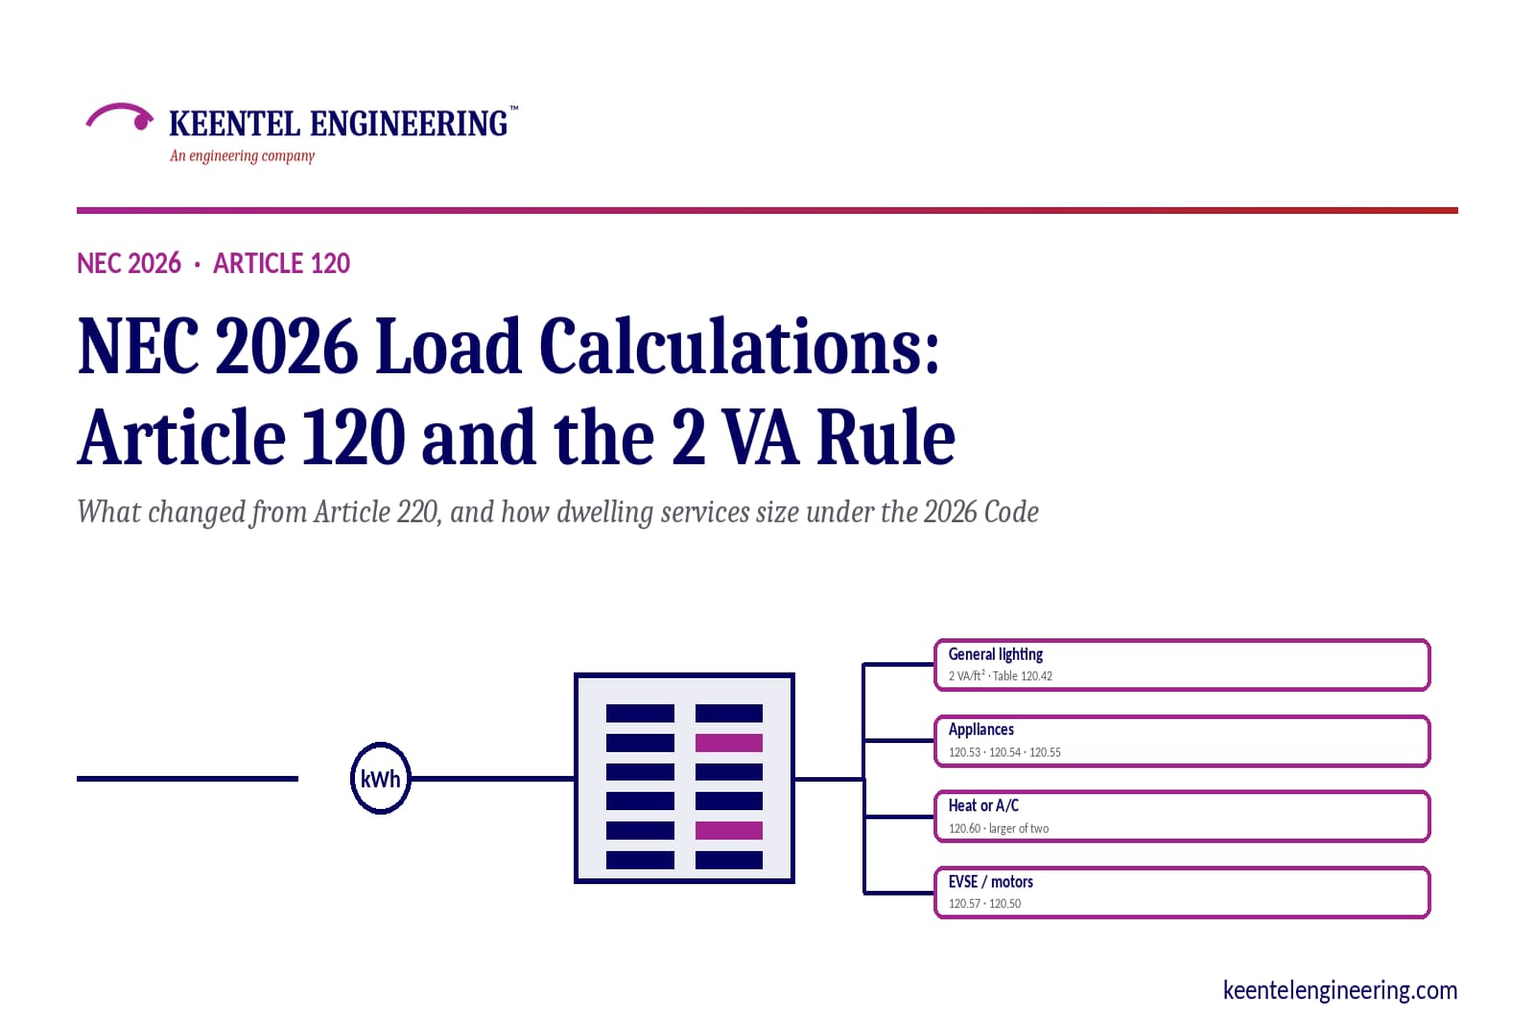
Learn NEC 2026 load calculations, Article 120 changes, the 2 VA rule, EV charging requirements, service sizing, and dwelling calculation methods.
By SANDIP R PATEL
•
September 7, 2026
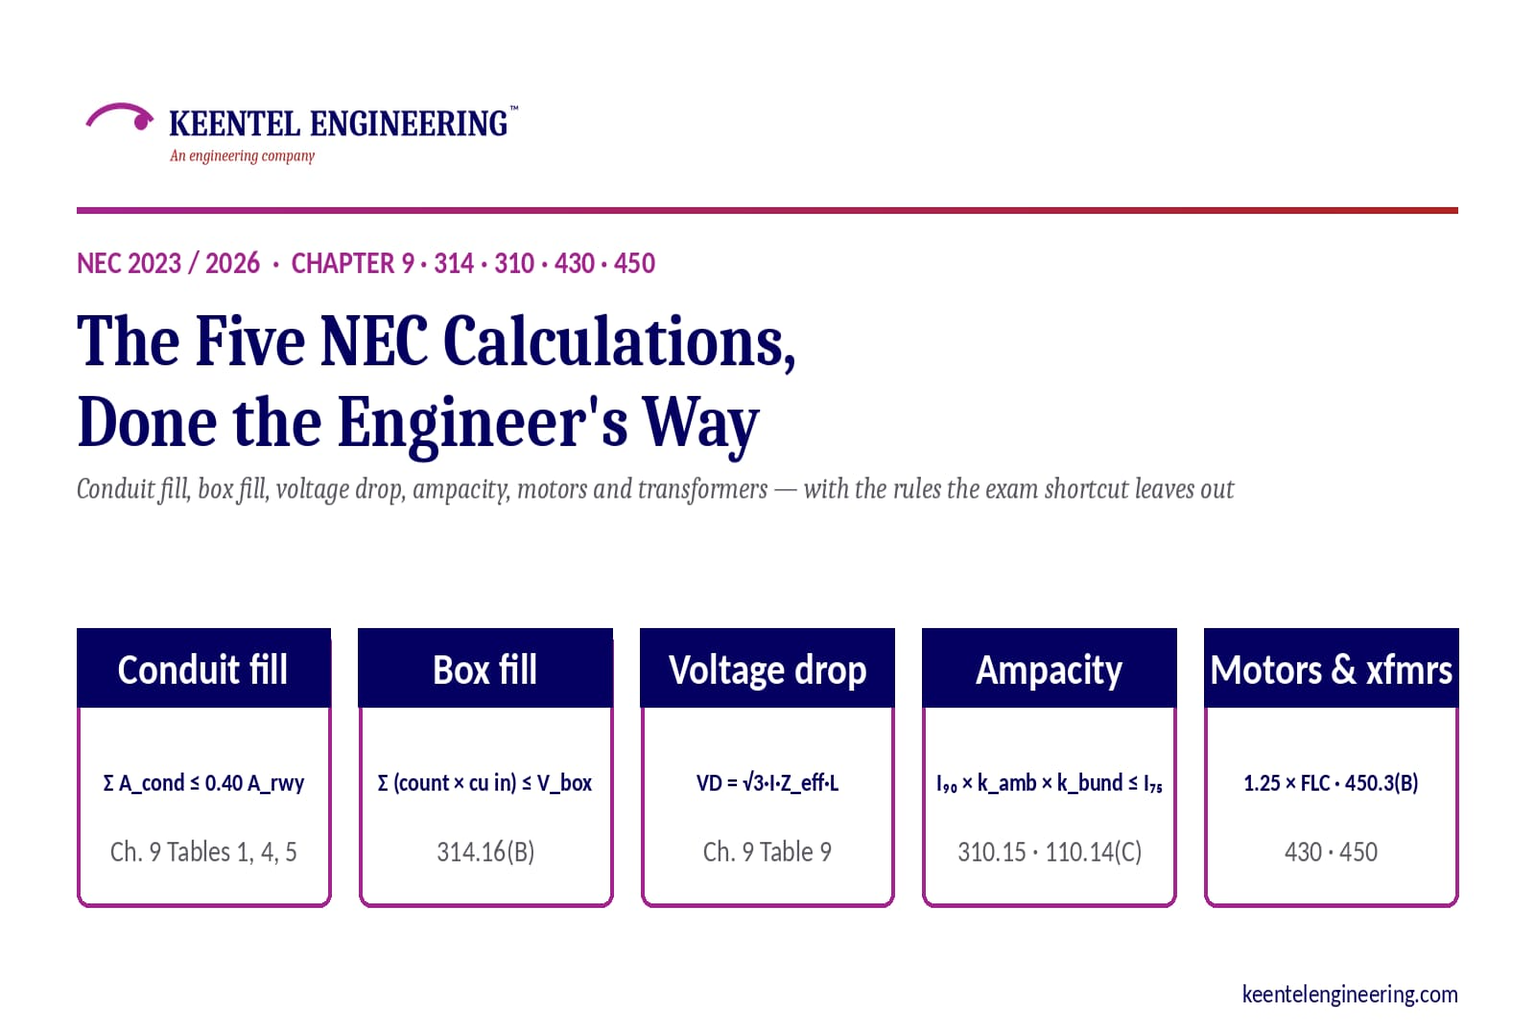
Learn five essential NEC calculations covering conduit fill, voltage drop, ampacity, motor circuits, and transformer protection with engineering examples.
By SANDIP R PATEL
•
September 7, 2026
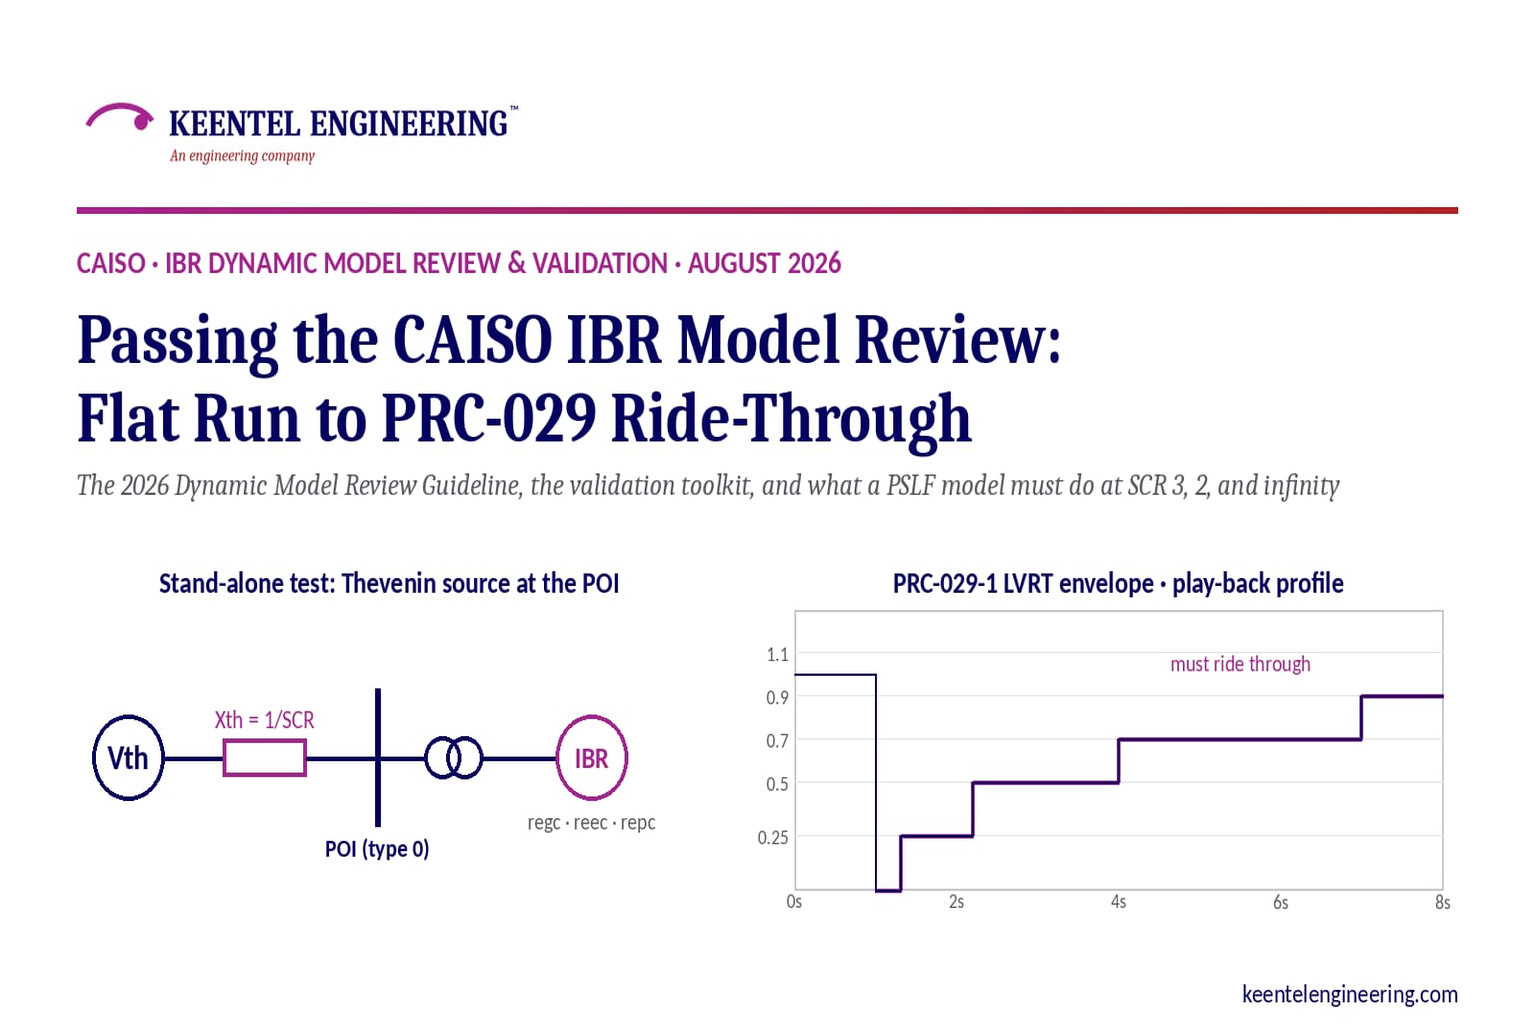
Learn how CAISO reviews IBR models using PSLF validation, PRC-029-1 ride-through requirements, WECC models, and inverter resource compliance testing.
By SANDIP R PATEL
•
September 7, 2026
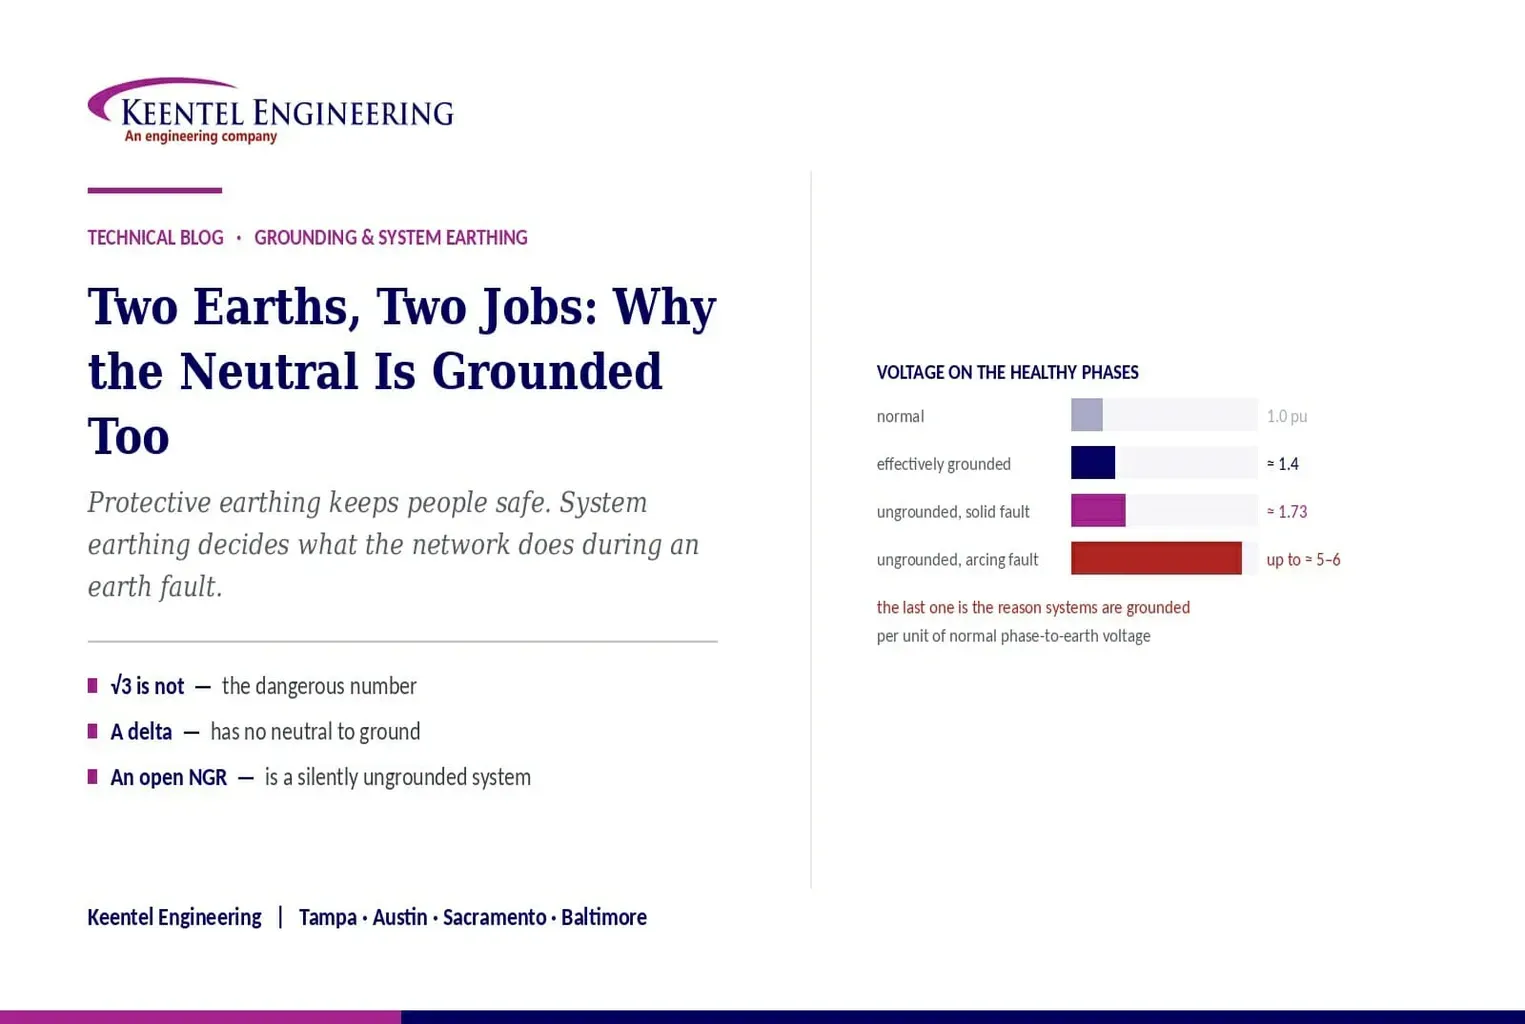
Understand system earthing and protective earthing, neutral grounding methods, effective grounding, ground grids, and insulation coordination for power systems
By SANDIP R PATEL
•
September 6, 2026
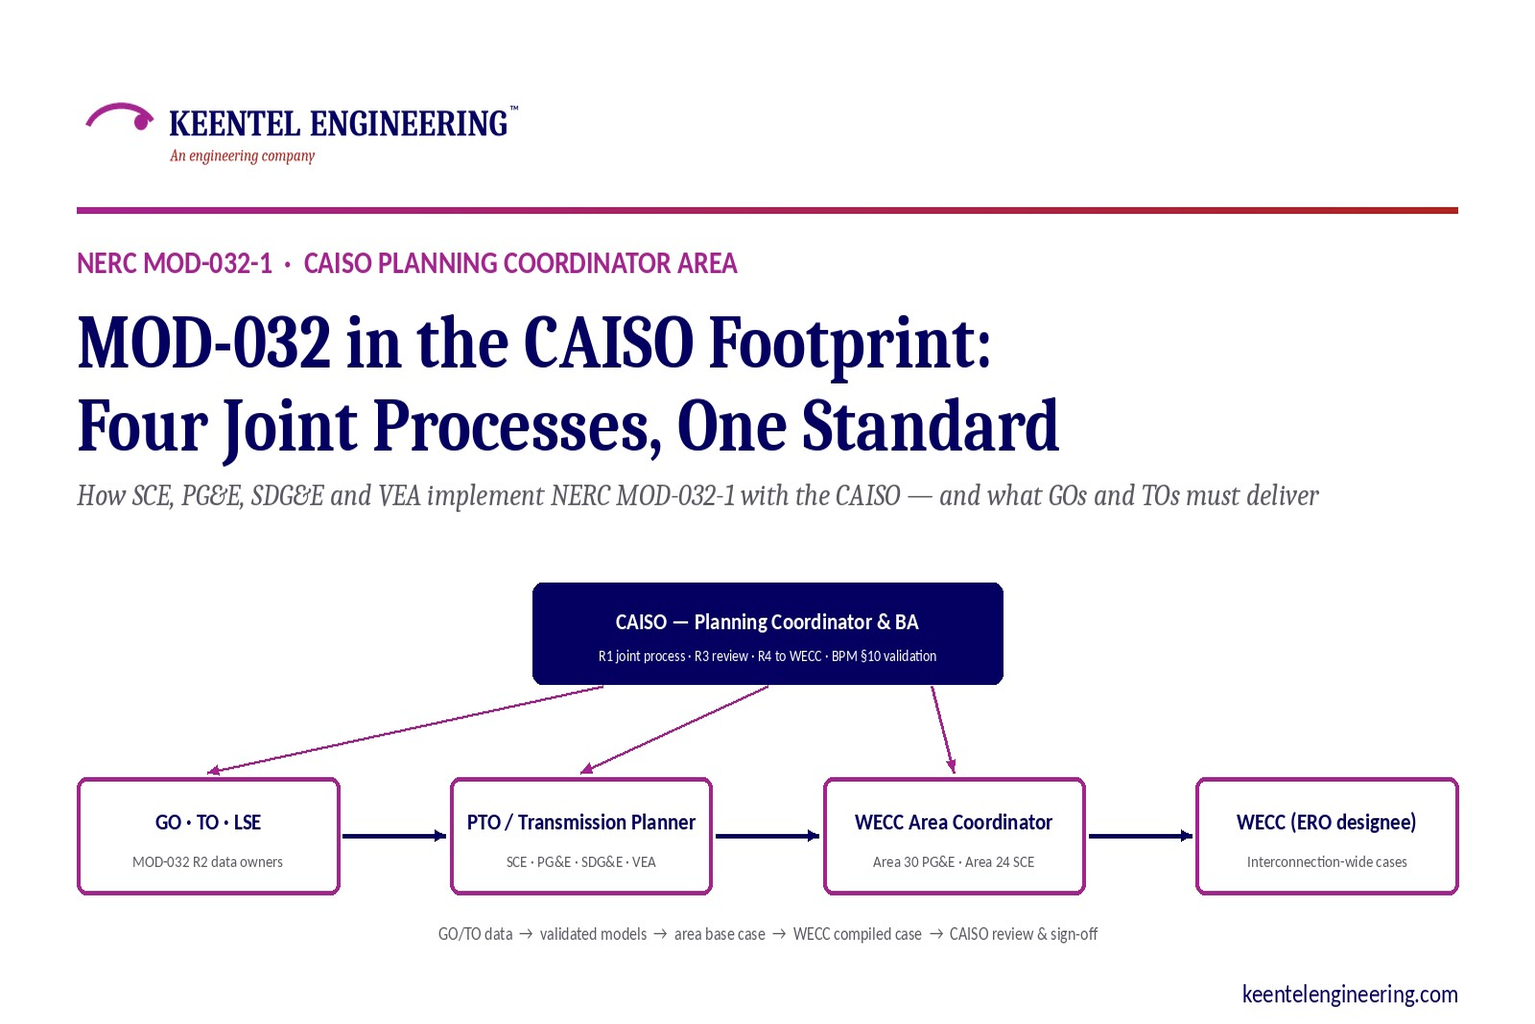
Learn how NERC MOD-032-1 applies across CAISO, SCE, PG&E, VEA and SDG&E, including generator data, PSLF models, EMT requirements and WECC submissions.
By SANDIP R PATEL
•
September 6, 2026
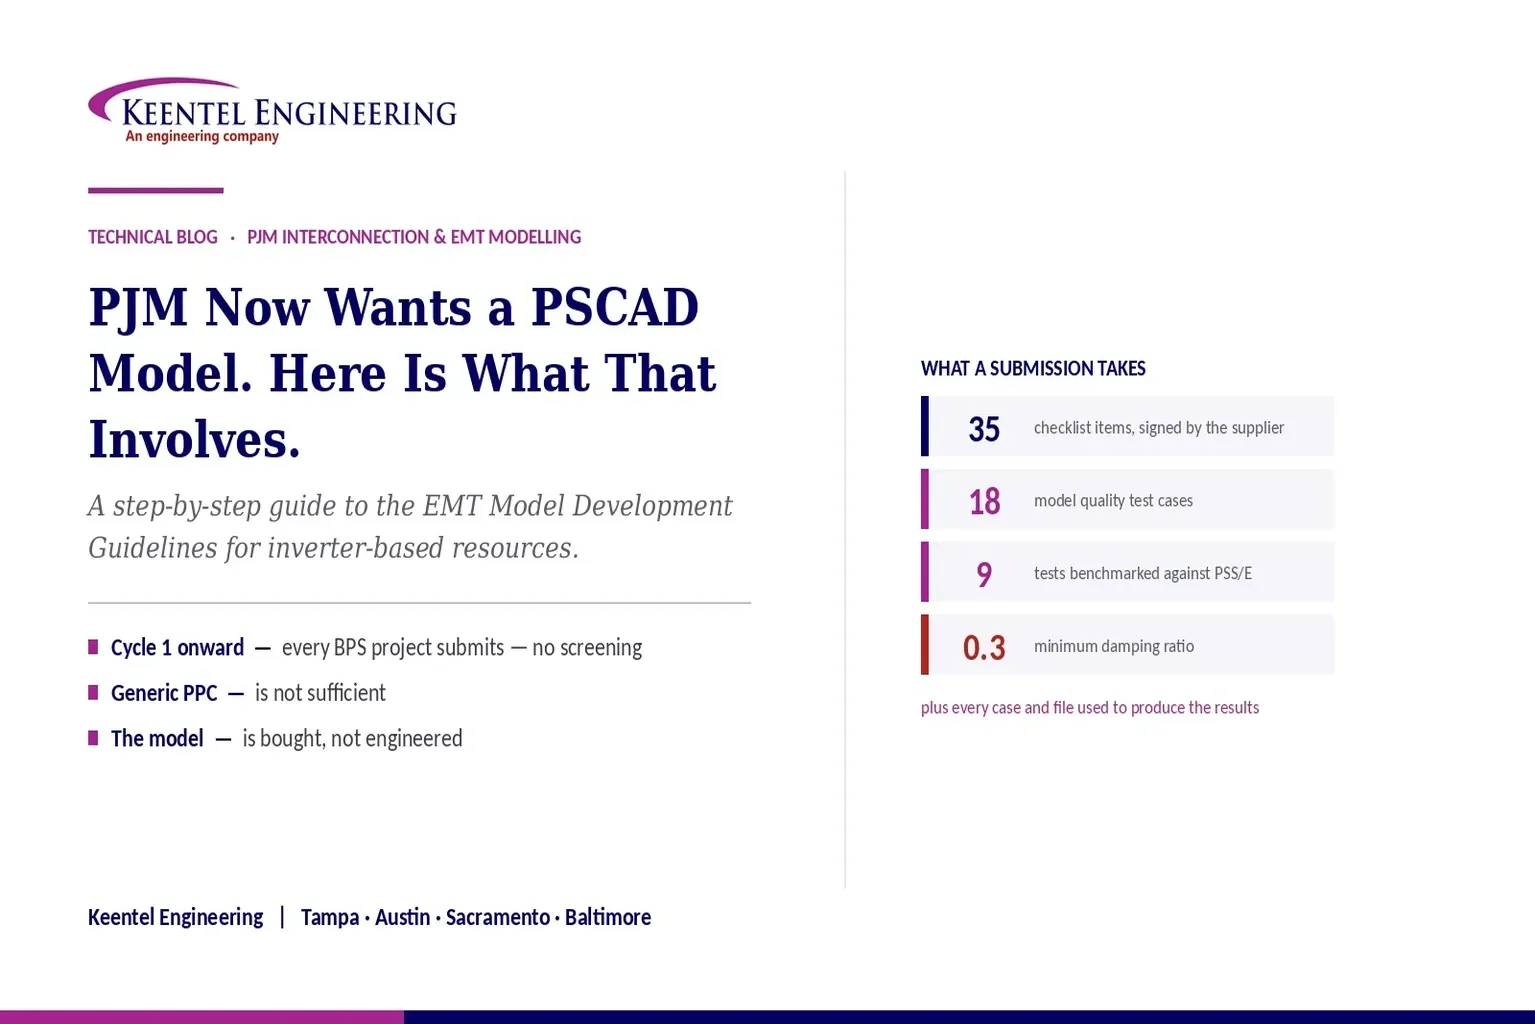
Learn PJM PSCAD model requirements for inverter-based resources, EMT testing, PSS/E benchmarking, ride-through studies, and compliance submissions
By SANDIP R PATEL
•
September 6, 2026
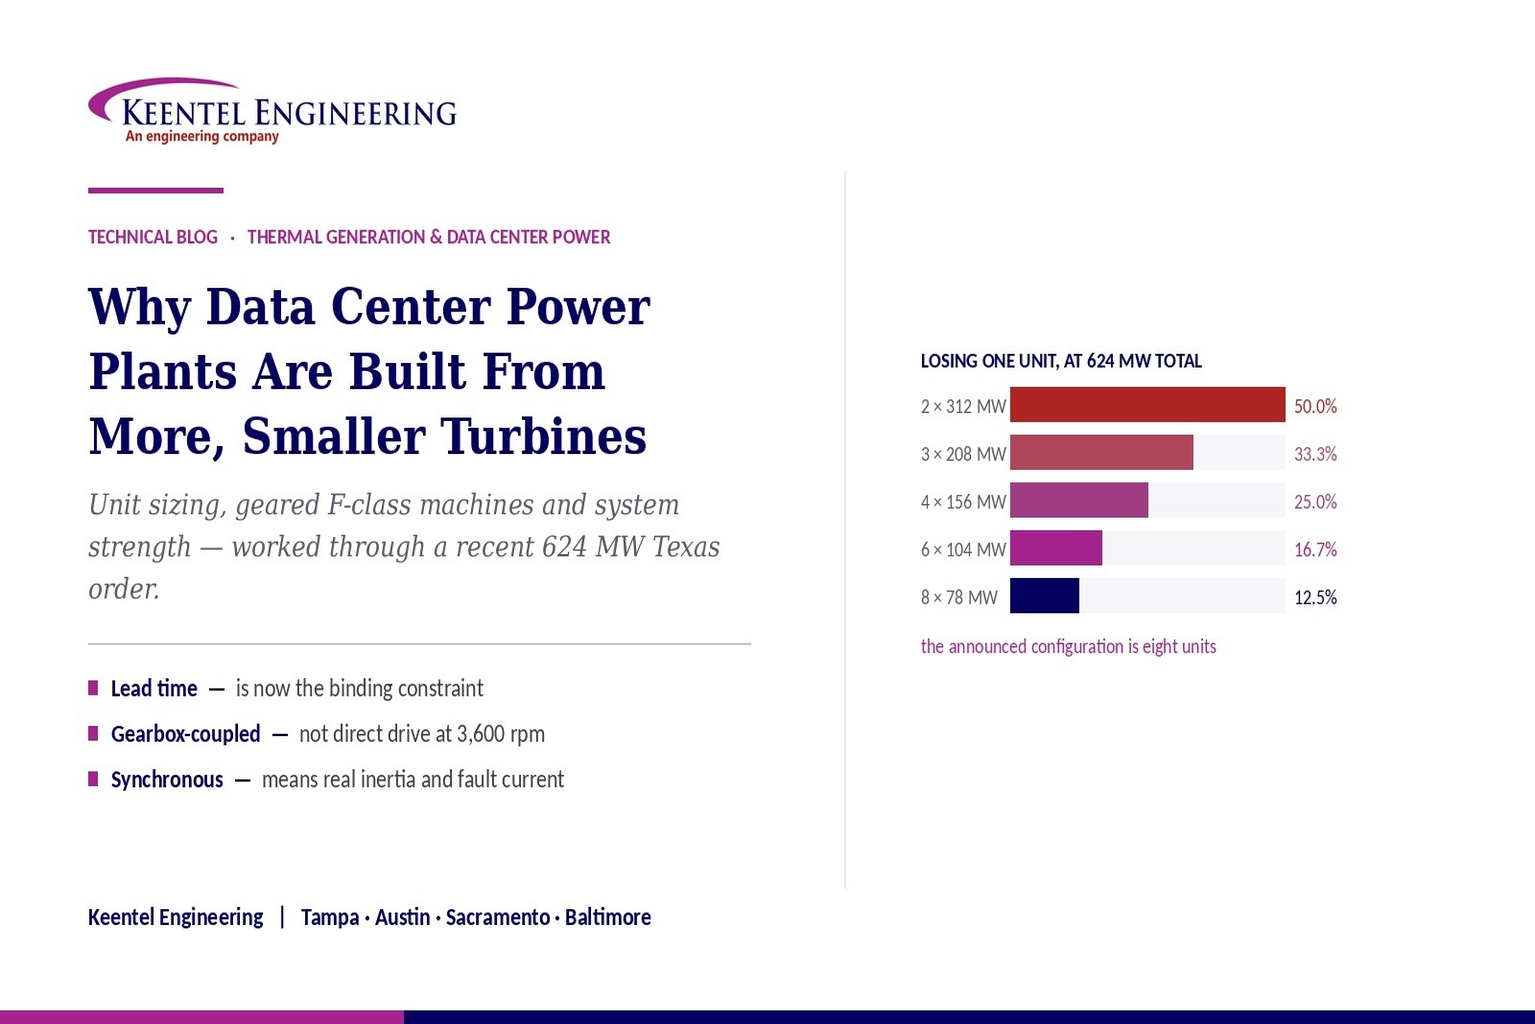
Learn why data center power plants use multiple smaller gas turbines, covering 624 MW capacity, redundancy, grid connection, system strength, and engineering.
By SANDIP R PATEL
•
September 5, 2026
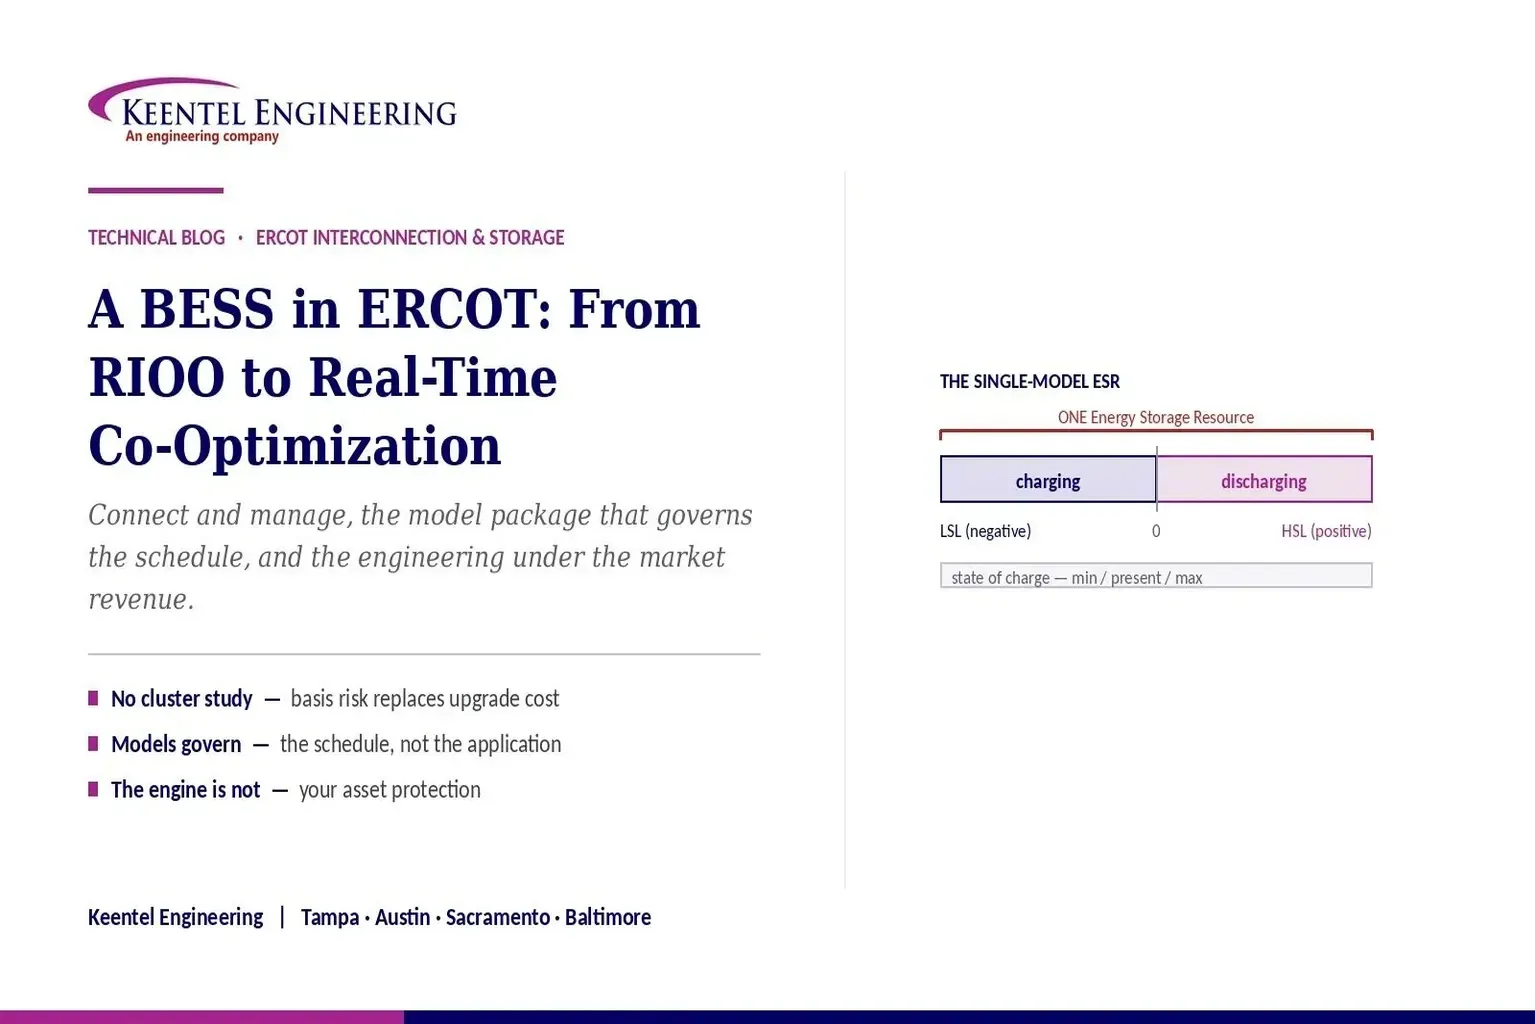
Understand ERCOT BESS interconnection requirements, including model packages, EMT studies, ride-through compliance, telemetry, and real-time co-optimization.





