A Coordinated Electric System Interconnection Review—the utility’s deep-dive on technical and cost impacts of your project.
Challenge: Frequent false tripping using conventional electromechanical relays
Solution: SEL-487E integration with multi-terminal differential protection and dynamic inrush restraint
Result: 90% reduction in false trips, saving over $250,000 in downtime
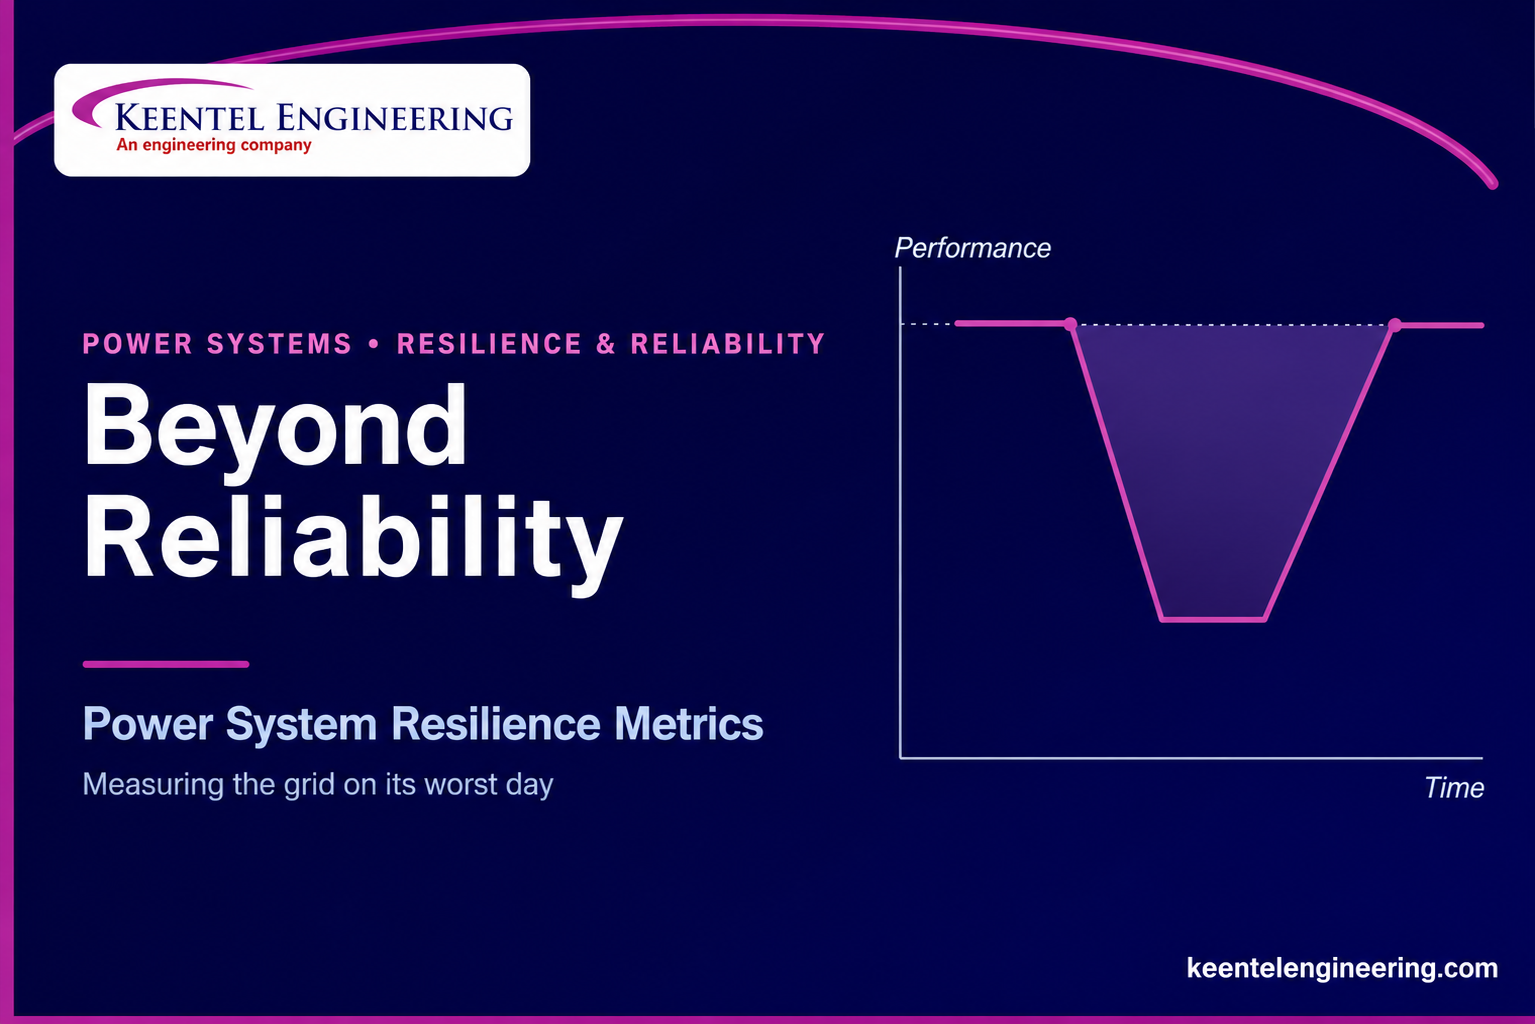
Measuring the Grid on Its Worst Day A Practical Guide to Power System Resilience Metrics
May 20, 2026 | Blog
Beyond Reliability: Why the Grid Needs to Be Measured on Its Worst Day
Ask most utilities how their grid is performing and they will hand you a SAIDI or SAIFI number — the familiar reliability indices that track how often the average customer loses power and for how long. Those numbers are useful, and they have driven real improvements for decades. But they share a quiet blind spot: by design, they look away from the worst days. Under the standard IEEE 1366 methodology, the days with the most extreme outages — the major-event days — are statistically excluded so that ordinary, blue-sky reliability can be compared fairly year over year. The hurricane, the ice storm, the multi-day heat dome, the cascading failure: precisely the events the public remembers, the regulator scrutinizes, and the data center worries about, are the events the headline reliability metric is built to ignore.
That gap is where resilience lives. Resilience is not a synonym for reliability — it is a different question. Reliability asks: under normal conditions and a short, pre-defined list of contingencies, can the system keep the lights on? Resilience asks: when a high-impact, low-probability event overwhelms that list, how far does the system fall, how long does it stay down, and how fast does it claw its way back? One is about avoiding interruptions; the other is about surviving and recovering from the interruptions you cannot avoid.
Three forces have moved this from an academic distinction to a board-level and rate-case priority. Extreme weather is now a planning assumption, not a tail risk — Winter Storms Uri and Elliott, repeated arctic events, and intensifying hurricane seasons have triggered successive federal performance reviews and, in late 2024, a new mandatory NERC standard (TPL-008-1) requiring transmission planners to study extreme heat and cold and develop mitigation plans. Load is exploding — data centers and AI campuses are driving forecasts of roughly a quarter more peak demand, and those loads demand a resilience case before they will site. And regulators want proof — public utility commissions increasingly expect comparative, reproducible metrics before they will let a utility recover the cost of a hardening or restoration-improvement program.
The trouble: everyone wants resilience, nobody agrees how to measure it
Robustness, redundancy, resourcefulness, response, recovery — the attributes of a resilient system are easy to list and hard to quantify. The result, across utilities and jurisdictions, is a patchwork: every program defines resilience slightly differently, so investments cannot be compared and value cannot be demonstrated to ratepayers. Closing that gap requires a shared, defensible way to put a number on resilience — one that works at the transmission level and the neighborhood level, in planning and in real time, and that a regulator can audit.
The performance curve: a number you can defend
The most durable way to quantify resilience is to track system performance — load served, customers up, critical facilities energized — through the full arc of an event, and measure the area of the dip. Two models dominate. The resilience triangle captures the simplest story: performance drops at the moment of impact, then recovers along a line back to normal; the triangular area of lost performance is the resilience penalty — smaller is better. The resilience trapezoid is the grown-up version: it separates the event into the disturbance phase (how far and how fast performance falls), a degraded plateau (how long the system sits at the bottom while crews assess damage and mobilize), and the restorative phase (how quickly it climbs back). Because real outage and restoration processes overlap in time, the same idea generalizes to cumulative outage and restore curves built directly from utility data.
The one-paragraph version
Reliability indices hide the worst days; resilience metrics are about exactly those days. The practical move is to draw the performance curve of an event — the triangle or, better, the trapezoid — and measure the area lost. From there you can attach a dollar value (avoided customer-minutes, energy not served, outage cost) and compare investments on equal footing: this is what turns “we should harden the coast” into “this project buys X fewer customer-hours of outage per dollar.”
That last step is what makes resilience metrics actionable rather than rhetorical. Once an event’s performance curve is quantified, you can re-run history: how much smaller would the triangle have been if a feeder had been undergrounded, if a substation had been flood-walled, if restoration crews had been pre-staged? The difference in area, multiplied by the value of lost load, is the benefit-cost case a commission can approve. Resilience stops being a slogan and becomes an engineering and economic argument.
The sections that follow lay out the framework Keentel uses — how resilience differs from reliability in scope and method, how to quantify it with the performance curve, how to classify metrics so the right one is used for the right decision, how to value resilience in dollars, and what data it takes. Three anonymized case studies then show the framework at work, from a coastal utility’s hardening rate case to a data-center interconnection and a community microgrid scorecard.
A Working Framework for Power System Resilience Metrics
This section is written for the planner, the rate-case witness, and the interconnection engineer who has to choose, compute, and defend a resilience metric. It draws on the established resilience literature and the frameworks published by DOE, NREL, PNNL, and the national labs, and aligns with the direction of NERC’s extreme-weather planning standard (TPL-008-1) and the FERC/NERC post-event reviews.
1. Resilience is not reliability — and the difference is methodological
The two disciplines diverge on almost every axis that matters for analysis. Reliability evaluates a fixed, experience-based list of contingencies (single and a few credible multiples) and demands that adequacy and security criteria be met for every one. Resilience deliberately reaches past that list to the high-impact, low-probability events that conventional design treats as out of scope — and accepts that, under those events, a controlled, temporary degradation of service is a legitimate outcome rather than a failure.
| Dimension | Reliability vs. resilience |
|---|---|
| Scope of analysis | Reliability models the power system; resilience also models the threat (weather, fire, flood, cyber) and its interaction with each component, plus the human and natural environment. |
| Events considered | Reliability: a predefined contingency set (e.g., NERC P0–P7; ENTSO-e ordinary/exceptional). Resilience: extreme, widespread, often multi-component N–k events selected by impact, probability, or risk. |
| Role of time | Reliability checks discrete system states. Resilience is inherently time-evolving — it tracks degradation, the degraded plateau, restoration, and operator/crew actions across the event lifecycle. |
| Acceptability | Reliability requires criteria to be strictly met. Resilience permits controlled degradation calibrated to event severity, duration, and spatial extent. |
| What is measured | Reliability measures quality of customer supply (interruption time, energy not served). Resilience measures both the supply-loss/recovery process and the infrastructure-damage/recovery process. |
| The blind spot | Reliability indices (IEEE 1366 SAIDI/SAIFI) exclude major-event days by design; resilience metrics target precisely those days. |
2. The resilience lifecycle and its attributes
Resilience is best understood as a sequence of capabilities exercised before, during, and after an event — conventionally grouped into a proactive set (anticipate, prepare, adapt) and a reactive set (withstand, respond, recover). Several attribute taxonomies map onto this lifecycle; the most widely cited is the 5Rs.
| Attribute (the 5Rs) | What it means for the grid |
|---|---|
| Robustness | Withstand the event with little performance loss — hardened lines, flood-walled substations, undergrounding, strong protection and controls. |
| Redundancy | Spare capacity and backup paths that hold core function when components fail — looped feeders, dual feeds, reserve generation. |
| Resourcefulness | Adapt under crisis — dynamic reconfiguration, demand-side management, DER and microgrid dispatch, mutual-aid mobilization. |
| Response | Mobilize fast — automatic load shedding, controlled islanding, backup-generation dispatch, crew pre-staging. |
| Recovery | Restore quickly and learn — automation and self-healing, mobile storage, prioritized critical-load reconnection, post-event improvement. |
3. Quantifying resilience: the performance curve
Resilience is quantified by tracking a performance measure (load served, customers energized, critical loads up) through an event and measuring the area of lost performance. Two canonical models and one data-driven generalization are used.
Resilience triangle
Performance sits at its nominal level, drops at the moment of impact, then recovers linearly to normal. The triangular area between the nominal line and the depressed performance trajectory is the resilience loss; a smaller triangle means a smaller drop and/or a faster recovery. It is intuitive and a good first cut, but it collapses the whole event into a single drop-and-recover.
Resilience trapezoid
The trapezoid resolves the event into three phases and is the more faithful model for utility decision-making: (I) the disturbance progress phase — from onset to the performance nadir, capturing depth and speed of the drop; (II) the post-disturbance degraded state — the plateau at the bottom while damage is assessed and crews mobilize, a phase the triangle ignores entirely; and (III) the restorative state — the climb back to normal. The area under the curve, phase by phase, is the metric, and each phase points to a different intervention: robustness flattens Phase I, logistics and pre-staging shorten Phase II, and automation/crews accelerate Phase III.
From models to data: outage and restore curves
In real utility records the phases overlap — restoration begins before the last customer goes out. So the trapezoid is generalized into two cumulative curves built directly from event data: the outage process (cumulative customers/load lost) and the restore process (cumulative restored). Every trapezoid metric — depth, duration, area — applies to these curves, and they can be assembled at scale from time-stamped outage management system data, which is what makes the framework practical rather than theoretical.
4. Classifying metrics so the right one fits the decision
No single number answers every resilience question. The practical skill is matching the metric to the decision context along a few axes.
- Planning vs. operations. Planning metrics are probabilistic and forward-looking (expected annual resilience loss across a hazard distribution); operational metrics are fast, scenario-specific, and support real-time response.
- Transmission vs. distribution. Transmission resilience is dominated by cascading and N–k events and bulk-system stability; distribution resilience is dominated by localized weather damage to overhead assets and feeder-level restoration.
- Grid vs. community. Community-scale metrics add microgrid islanding success, critical-facility service continuity, and socio-economic and public-health impact — dimensions that pure grid metrics miss.
- Performance, consequence, and non-performance. Performance metrics measure load/duration/frequency of loss; consequence metrics measure the downstream economic and social cost; non-performance metrics score inherent attributes (hardening level, redundancy, crew readiness). Composite indices blend them — but the aggregation must stay transparent and auditable.
- System-wide vs. localized. Local metrics rarely aggregate cleanly into system metrics because interconnected networks exhibit emergent, non-linear behavior — a localized disruption can propagate system-wide in ways a sum of local scores will not predict.
5. Modeling vulnerability: two complementary routes
Model-based (fragility) approach. Component fragility curves give the probability a line, pole, insulator, or substation fails as a function of stress (wind, ice, flood, debris). Aggregated across the system, they predict performance — and, crucially, let you evaluate a specific hardening investment on a specific asset. The cost is the difficulty of cataloguing every component, age, design, and exposure, and of calibrating and validating the combined result.
Statistical (area outage-rate) approach
Pairing detailed utility outage records with weather records yields area outage-rate curves — the observed system outage rate as a function of a measured stress such as wind speed. These capture the system’s real, combined response without modeling every component, and they translate directly into historical resilience metrics. Their limit is that they describe the past: they extrapolate to a changing climate or a hardened future only with supporting engineering analysis of how the outage rate itself would shift.
6. Putting a dollar on resilience
Metrics drive decisions only when they connect to value. The performance-curve area becomes avoided customer-minutes or energy not served; multiplied by the value of lost load (or sector-specific interruption cost), it becomes avoided outage cost. Around that core sit several valuation methods: probabilistic risk assessment (probability × consequence across the hazard set), cost-benefit analysis comparing program cost against avoided-loss benefit, resilience-adjusted resource adequacy that folds extreme-event risk into adequacy planning, and macroeconomic impact studies that capture the ripple effects of prolonged regional outages. The discipline is to keep the valuation transparent enough that a regulator can reproduce it.
7. Data: the binding constraint
Resilience metrics are only as good as the event data behind them. The framework needs time-stamped, geolocated outage and restoration records, paired with hazard data (weather, flood, fire) and asset/exposure information. The familiar obstacles are incomplete or inconsistent outage reporting, proprietary-data sensitivity, and the rarity of the largest events (small samples for the highest-consequence cases). Public and curated datasets — national outage trackers and curated outage repositories among them — increasingly supplement utility records, but a clean internal outage management system feed remains the most valuable input.
8. The standards and framework landscape
There is no single mandated resilience metric, but the scaffolding is converging. National-lab and DOE efforts — resilience analysis and planning tools, resilience metrics toolkits and rating systems, the Grid Deployment Office metrics framework, and the NREL and PNNL resilience frameworks — offer structured starting points. On the mandatory side, NERC’s TPL-008-1 now requires extreme-weather (benchmark heat and cold) transmission planning studies and mitigation plans, and the recurring FERC/NERC post-event reviews are steadily codifying “what works” into performance expectations. The common gap these frameworks still leave — and where engineering judgment earns its keep — is selecting a coherent, decision-appropriate metric set and grounding it in defensible data.
Reference: key metrics and where they fit
| Metric / quantity | Use and meaning |
|---|---|
| SAIDI / SAIFI / CAIDI | Classic reliability indices (duration, frequency, average restoration). Exclude major-event days under IEEE 1366 — the reason they understate extreme events. |
| Energy Not Supplied (ENS / EENS) | Energy (MWh) not delivered during an event/year. Core resilience-loss currency; pairs with value of lost load for cost. |
| Value of Lost Load (VoLL) / customer interruption cost | $/MWh or $/event cost of unserved energy, by sector. Converts performance loss into avoided-cost benefit. |
| Resilience triangle area | Cumulative performance loss for a single drop-and-recover event. Smaller = more resilient. |
| Resilience trapezoid (Phase I/II/III) | Depth and speed of drop, degraded-plateau duration, and restoration rate — each tied to a different intervention. |
| Area outage-rate curve | Observed system outage rate vs. measured stress (e.g., wind). Statistical basis for historical resilience metrics and hardening ROI. |
| Time-to-recovery / critical-load restoration time | Duration to restore service (or critical facilities). Central operational and community resilience measure. |
| Microgrid islanding success rate | Share of events a microgrid successfully islands and sustains critical load — community-scale resilience. |
Case Studies
Project identities are confidential
The following studies are drawn from representative Keentel engagements. Client names, exact locations, service territories, and proprietary data have been removed or generalized. Figures are illustrative of the engineering approach and do not disclose any specific client asset or program.
Case Study 1 — Turning Storm-Outage Data into a Defensible Hardening Rate Case
Client
Investor-owned distribution utility (confidential)
Location
Confidential — hurricane-exposed coastal service territory
Challenge
Justify a multi-year hardening + restoration program to the state commission with reproducible benefit-cost evidence
Keentel scope
Outage-data resilience metrics, area outage-rate curves, hardening/restoration ROI, rate-case technical support
Challenge
The utility had a hardening program it believed in but could not defend in dollars. Its SAIDI/SAIFI numbers, with major-event days excluded, made the system look healthy precisely on the storm days that drove customer complaints and the commission’s questions. The commission wanted a reproducible, comparable benefit-cost case before approving cost recovery.
Approach
- Reconstructed historical events from time-stamped outage management system records, building cumulative outage and restore curves for each major storm rather than relying on the major-event-day-excluded indices.
- Computed performance-curve resilience metrics (trapezoid depth, degraded-plateau duration, restoration rate, and area) for each event, and converted lost performance to customer-minutes and energy not supplied.
- Paired outage records with wind data to fit area outage-rate curves — the observed system outage rate as a function of wind speed — establishing the statistical baseline of how the system actually responds to storm stress.
- Ran the counterfactual: applied engineering estimates of how targeted undergrounding, pole reinforcement, and pre-staged restoration would shift the outage rate and the restore curve, then re-computed the historical metrics to quantify avoided customer-minutes and ENS per dollar.
- Translated avoided ENS into avoided outage cost using sector value-of-lost-load, producing a transparent, reproducible benefit-cost ratio the commission staff could audit.
Outcome
A rate-case exhibit that quantified resilience in the regulator’s own currency — avoided customer-hours and dollars per program dollar — separating the highest-return hardening segments from the marginal ones and giving the utility a defensible, data-grounded basis for cost recovery rather than a narrative argument.
Case Study 2 — A Resilience-by-Design Case for a Large-Load Interconnection
Client
Hyperscale data-center developer (confidential)
Location
Confidential — extreme-weather-exposed interconnection
Challenge
Quantify campus resilience to HILP events and value on-site generation, BESS, and dual-feed options for the interconnection case
Keentel scope
HILP scenario assessment, N–k/cascading screening, performance-curve targets, resilience valuation of mitigation options
Challenge
A large concentrated load was siting into a pocket with real exposure to extreme heat and cold and to cascading transmission events. Standard interconnection studies cleared the routine contingency list, but the developer’s uptime requirements and the host utility’s questions both demanded something the conventional study did not produce: a quantified picture of how the campus would fare during the rare, severe events — and what mitigation was actually worth.
Approach
- Defined a high-impact, low-probability scenario set reaching beyond the standard NERC P0–P7 list — benchmark extreme heat/cold consistent with the new TPL-008-1 direction, multi-element N–k transmission losses, and prolonged degraded-supply conditions.
- Screened cascading and interdependency pathways (shared transmission corridors, fuel and water dependencies) that could turn a single initiating event into a system-wide one affecting the site.
- Built performance-curve (trapezoid) targets for the campus — maximum acceptable drop depth, degraded-state duration, and restoration time for critical load — translating an uptime requirement into engineering acceptance criteria.
- Evaluated mitigation options — on-site firm generation, battery storage sizing, controlled islanding/microgrid operation, and a second independent feed — each scored by how much it reduced the performance-curve area under the HILP scenarios.
- Valued the options against avoided unserved critical load, giving the developer a ranked, cost-aware resilience menu to take into interconnection and design.
Outcome
A resilience-by-design package that complemented the standard interconnection study with a quantified HILP performance case — letting the developer right-size on-site generation and storage to a defined uptime target and present the host utility a substantiated resilience story rather than an assertion.
Case Study 3 — A Community Microgrid Resilience Scorecard for Critical Facilities
Client
Municipality / critical-facility cluster (confidential)
Location
Confidential — disaster-exposed community
Challenge
Build localized resilience metrics blending technical and social factors to support a microgrid grant and regulatory filing
Keentel scope
Localized resilience metric design, microgrid/DER modeling, critical-load scorecard, funding-application technical support
Challenge
A community wanted to protect its critical facilities — a hospital, water treatment, emergency shelters — through a microgrid, and needed to demonstrate the resilience benefit to win grant and regulatory funding. System-wide grid indices were the wrong tool: they could not capture critical-facility service continuity, islanding performance, or the socio-economic stakes that the funding decision turned on.
Approach
- Designed a localized resilience metric set tailored to the community: time to restore each critical facility, microgrid islanding success rate, critical-facility service-continuity hours, speed of reconnection to the grid, and socio-economic/health exposure of the served population.
- Modeled the proposed microgrid — distributed generation, battery storage, and provision for mobile storage — and simulated its islanding and critical-load support across representative disaster scenarios.
- Computed performance-curve metrics for the critical-load subsystem with and without the microgrid, quantifying the reduction in critical-load outage area for each scenario.
- Assembled a transparent scorecard combining the technical metrics with community-specific social factors, structured so reviewers could trace every number to its source — the auditability that grant and regulatory bodies require.
Outcome
A defensible, reproducible resilience scorecard that expressed the microgrid’s value in terms the funder cared about — critical-facility hours kept alive and islanding reliability — rather than generic grid indices, strengthening the community’s case for resilience investment.
About Keentel Engineering
Keentel Engineering is a power systems and grid-interconnection firm serving utilities, developers, and large-load customers from offices in Tampa, Florida and Austin, Texas. Our work spans power system studies across EHV, HV, and MV networks; point-of-interconnection engineering for utility-scale renewables, storage, and large loads; substation and transmission-line design; protection and controls; owner’s engineer services; and NERC operations & planning compliance.
On resilience engagements we cover the full analytical scope: outage-data resilience metrics and performance-curve analysis, model-based and statistical vulnerability modeling, HILP and N–k scenario assessment, resilience valuation and benefit-cost analysis, and rate-case and grant technical support — for transmission, distribution, large-load interconnection, and community microgrid applications.
Disclaimers
Independence and non-affiliation. Keentel Engineering is an independent engineering firm and is not affiliated with, sponsored by, or endorsed by IEEE, NERC, FERC, DOE, NREL, PNNL, any national laboratory, or any regional transmission organization or independent system operator. References to standards (including NERC TPL-008-1 and IEEE 1366) and to published resilience frameworks are made solely to identify the governing technical context. All trademarks and standard designations are the property of their respective owners.
Confidentiality. All project examples in this paper are anonymized. No client names, project identifiers, exact locations, service territories, or proprietary data are disclosed. Figures and outcomes are illustrative of engineering approach only.
No engineering or regulatory advice.
This paper is general technical information, not project-specific engineering, financial, or regulatory advice. Resilience assessments and metric selections must be developed for the specific system, hazards, data, and decision context by a qualified engineer, and verified against the applicable standards and jurisdictional requirements.
Frequently Asked Questions
Q. What is the difference between reliability and resilience?
Reliability is about avoiding interruptions under normal conditions and a defined contingency list; resilience is about surviving and recovering from the rare, severe events that overwhelm that list. Reliability asks how often the average customer loses power; resilience asks how deep the system falls during a major event and how fast it comes back.
Q. Why don’t SAIDI and SAIFI already capture resilience?
Under the standard IEEE 1366 methodology, major-event days are statistically excluded so ordinary reliability can be compared fairly year to year. That means the hurricane and ice-storm days — exactly the events resilience is about — are filtered out of the headline indices. Resilience metrics deliberately target those excluded days.
Q. What is a high-impact, low-probability (HILP) event?
A rare but severe disturbance — a hurricane, ice storm, multi-day heat dome, wildfire, large cyber-physical attack, or cascading N–k transmission failure — that falls outside the contingency set conventional reliability planning is designed around. Resilience analysis is built specifically for these.
Q. What are the core attributes of a resilient system?
Commonly summarized as the 5Rs: robustness (withstand the event), redundancy (backup capacity and paths), resourcefulness (adapt under crisis), response (mobilize fast), and recovery (restore quickly and learn). They map onto a lifecycle of anticipate-prepare-adapt and withstand-respond-recover.
Q. What is the resilience triangle?
A model of an event where performance drops at impact and recovers linearly to normal; the triangular area of lost performance is the resilience penalty. Smaller area means a smaller drop and/or faster recovery. It is a good first cut but collapses the whole event into one drop-and-recover.
Q. How is the resilience trapezoid better?
It separates the event into three phases — the disturbance (how far/fast performance falls), the degraded plateau (how long the system sits at the bottom while crews mobilize), and restoration (how fast it climbs back). Each phase points to a different fix: robustness flattens the first, logistics shortens the second, automation and crews accelerate the third.
Q. Can resilience be measured from real utility data?
Yes. Because actual outage and restoration overlap in time, the trapezoid generalizes to cumulative outage and restore curves built from time-stamped outage management system records. Every depth/duration/area metric applies to those curves, which is what makes the framework practical at scale.
Q. How do you turn a resilience metric into a dollar value?
Convert the performance-curve area into avoided customer-minutes or energy not supplied, then multiply by the value of lost load (or sector interruption cost) to get avoided outage cost. That feeds benefit-cost analysis, probabilistic risk assessment, and resilience-adjusted resource adequacy.
Q. Model-based fragility curves or statistical outage-rate curves — which should I use?
Both, ideally. Fragility curves let you evaluate hardening on a specific asset but require detailed component cataloguing and validation. Area outage-rate curves capture the system’s real combined response from outage-plus-weather data and translate directly into historical metrics, but describe the past — extrapolating to a hardened or warmer future needs supporting engineering analysis.
Q. Does any standard require resilience analysis now?
Increasingly. NERC’s TPL-008-1 (filed with FERC in late 2024) requires transmission planners to study benchmark extreme heat and cold and develop mitigation plans, and recurring FERC/NERC post-event reviews are codifying expectations. DOE and national-lab frameworks (RAPT, the GDO metrics framework, NREL and PNNL frameworks) provide structured methods even where no single metric is mandated.
Q. How is community resilience measured differently?
Community and critical-facility metrics add dimensions grid indices miss — microgrid islanding success rate, critical-facility service continuity, time to restore specific critical loads, and socio-economic and public-health exposure. Local metrics also rarely aggregate cleanly into system metrics, because interconnected networks behave non-linearly.
Q. Why do data centers and large loads care about resilience metrics?
Their uptime requirements translate directly into resilience acceptance criteria, and host utilities increasingly expect a resilience case at interconnection. A quantified HILP performance assessment lets a developer right-size on-site generation, storage, and redundant feeds to a defined target rather than over- or under-building.
Q. What data do I need to get started?
Time-stamped, geolocated outage and restoration records (ideally from the outage management system), paired with hazard data (weather, flood, fire) and asset/exposure information. The main obstacles are inconsistent outage reporting, data sensitivity, and the small sample of the very largest events.
Q. How does Keentel protect client confidentiality in published work?
Every public deliverable is written in our own voice with client names, locations, service territories, and proprietary data removed or generalized. The case studies in this paper are representative and anonymized — they describe our engineering approach, not any identifiable client program.

About the Author:
Sonny Patel P.E. EC
IEEE Senior Member
In 1995, Sandip (Sonny) R. Patel earned his Electrical Engineering degree from the University of Illinois, specializing in Electrical Engineering . But degrees don’t build legacies—action does. For three decades, he’s been shaping the future of engineering, not just as a licensed Professional Engineer across multiple states (Florida, California, New York, West Virginia, and Minnesota), but as a doer. A builder. A leader. Not just an engineer. A Licensed Electrical Contractor in Florida with an Unlimited EC license. Not just an executive. The founder and CEO of KEENTEL LLC—where expertise meets execution. Three decades. Multiple states. Endless impact.
Services

Let's Discuss Your Project
Let's book a call to discuss your electrical engineering project that we can help you with.
About the Author:
Sonny Patel P.E. EC
IEEE Senior Member
In 1995, Sandip (Sonny) R. Patel earned his Electrical Engineering degree from the University of Illinois, specializing in Electrical Engineering . But degrees don’t build legacies—action does. For three decades, he’s been shaping the future of engineering, not just as a licensed Professional Engineer across multiple states (Florida, California, New York, West Virginia, and Minnesota), but as a doer. A builder. A leader. Not just an engineer. A Licensed Electrical Contractor in Florida with an Unlimited EC license. Not just an executive. The founder and CEO of KEENTEL LLC—where expertise meets execution. Three decades. Multiple states. Endless impact.
Leave a Comment
We will get back to you as soon as possible.
Please try again later.
Related Posts