
A Coordinated Electric System Interconnection Review—the utility’s deep-dive on technical and cost impacts of your project.
Challenge: Frequent false tripping using conventional electromechanical relays
Solution: SEL-487E integration with multi-terminal differential protection and dynamic inrush restraint
Result: 90% reduction in false trips, saving over $250,000 in downtime
The three operating regions you have to design to
| Device | Output vs voltage | Response | Best suited to | Main limitations |
|---|---|---|---|---|
| Mechanically switched capacitor or reactor | Proportional to voltage squared | Seconds; discrete steps; limited switching operations per day | Steady-state reactive supply, voltage profile, loss reduction | No dynamic capability; step voltage change on switching; capability collapses when most needed |
| Static var compensator | Capacitive branches proportional to voltage squared | A few cycles; continuously controllable | Continuous control where cost matters and deep voltage support is not the driver | Square-law capability loss; harmonic filters are part of the plant and interact with the network |
| STATCOM | Approximately proportional to voltage — constant current capability | One to two cycles closed loop; converter response faster still | Voltage stability margin, weak interconnections, fast disturbance recovery, flicker and unbalance compensation | Higher capital cost; converter losses; adds a converter and its control dynamics to the network |
| Synchronous condenser | Governed by machine capability and excitation | Excitation response in the hundreds of milliseconds; inherent inertial response instantaneous | System strength and inertia, short-circuit contribution, black start support | Rotating plant with maintenance and losses; slower controlled response than a converter |
| STATCOM with energy storage | Reactive as a STATCOM, plus real power within the storage rating | As STATCOM for reactive; real power limited by storage | Where a real power deficiency is part of the problem | Cost and complexity of the storage; different failure and maintenance profile |
| Stage | Keentel scope | Outcome |
|---|---|---|
| Screening | Series-compensation proximity, radial contingency review, UIF and short-circuit ratio screening, frequency scans | Early identification of which SSO types apply |
| Detailed studies | PSCAD/EMTDC EMT studies with vendor real-code models, impedance-based and frequency-scan analysis | Clear evidence of stability margins or risk |
| Model quality | EMT model review, benchmarking against positive-sequence models, model acceptance support | Models that system operators accept |
| Mitigation | Control retuning recommendations with vendors, SSDC and bypass logic requirements, protection and monitoring specifications | Practical, coordinated solutions |
| Interconnection support | SSR and SSO study reports for ISO and utility requirements, response to reviewer comments | Fewer delays in the interconnection process |
Resilience: designing CDUs to the facility Tier objective
Liquid cooling makes heat removal more critical, not less. Cold plates hold only seconds of thermal buffer. If TCS flow stops, processors throttle or shut down very quickly. Resilience design must therefore cover:
- Pump redundancy: N+1 pumps at minimum, with automatic changeover.
- CDU redundancy: N+1 CDUs on a common TCS header, or 2N CDUs serving A and B manifolds for fault-tolerant designs.
- Power to CDUs: dual-corded CDUs fed from A and B sources, with pumps and controls on UPS power so coolant keeps flowing through a utility failure and generator start. This is the liquid-cooling equivalent of continuous cooling.
- Facility water continuity: chilled water or condenser water must also continue, through thermal storage, UPS-backed pumps or a high enough FWS temperature that the TCS can coast on stored thermal mass for the transfer period.
- Concurrent maintainability: isolation valves so any CDU, pump, filter or manifold section can be serviced without stopping the others.
- Leak management: leak detection, drip trays, automatic isolation valves and procedures for fluid spills.
Electrical engineering considerations
CDUs and liquid-cooling plants are electrical loads with their own design requirements:
- Pump motors and VFDs. Large CDUs use variable-frequency drives on their pump motors. These introduce harmonic current that must be included in the facility's harmonic study and IEEE 519 evaluation.
- Critical mechanical load on UPS. Putting CDU pumps on UPS increases UPS and battery sizing. The mechanical UPS load must be included in redundancy and ride-through calculations.
- Feeder and protection design. Dual feeds, automatic transfer, selective coordination and arc-flash labelling apply to CDU power distribution just as they do to IT power.
- Generator transient response. CDU pumps restarting together after a transfer create motor inrush on the generators. Staged restarts and soft acceleration reduce the step load.
- Load dynamics. AI training loads can swing rapidly between high and low power. Cooling controls must track those swings without temperature overshoot, and electrical systems must handle both the IT and the cooling load changes.
Commissioning a liquid-cooled data hall
- Flush and clean the TCS piping and manifolds to the specified cleanliness, using high-purity flush water.
- Fill and vent with the specified coolant, verifying glycol concentration and chemistry.
- Pressure test for leaks at design and test pressures, including quick-disconnect fittings.
- Verify sensors and controls: flow meters, temperature sensors, pressure transmitters, leak detection and BMS points.
- Load test with heat load banks connected through the cold-plate interfaces or rack manifolds, across the operating range.
- Prove the heat balance on both loops at several load steps, and the approach temperature against the design.
- Test failure scenarios: pump failure, CDU failure, power transfer to generator, valve failure and loss of facility water, confirming temperatures stay within the IT vendor's limits.
How Keentel Engineering helps
Keentel Engineering supports data center owners, developers and EPCs with the electrical engineering that liquid-cooled facilities depend on, and coordinates with the mechanical engineer of record and cooling vendors on the integrated design.
Power Electronic Device Interactions: An In-Depth Engineering Guide to CI-N and CI-D
October 03, 2026 | Blog
Part A — PEDI at a Glance
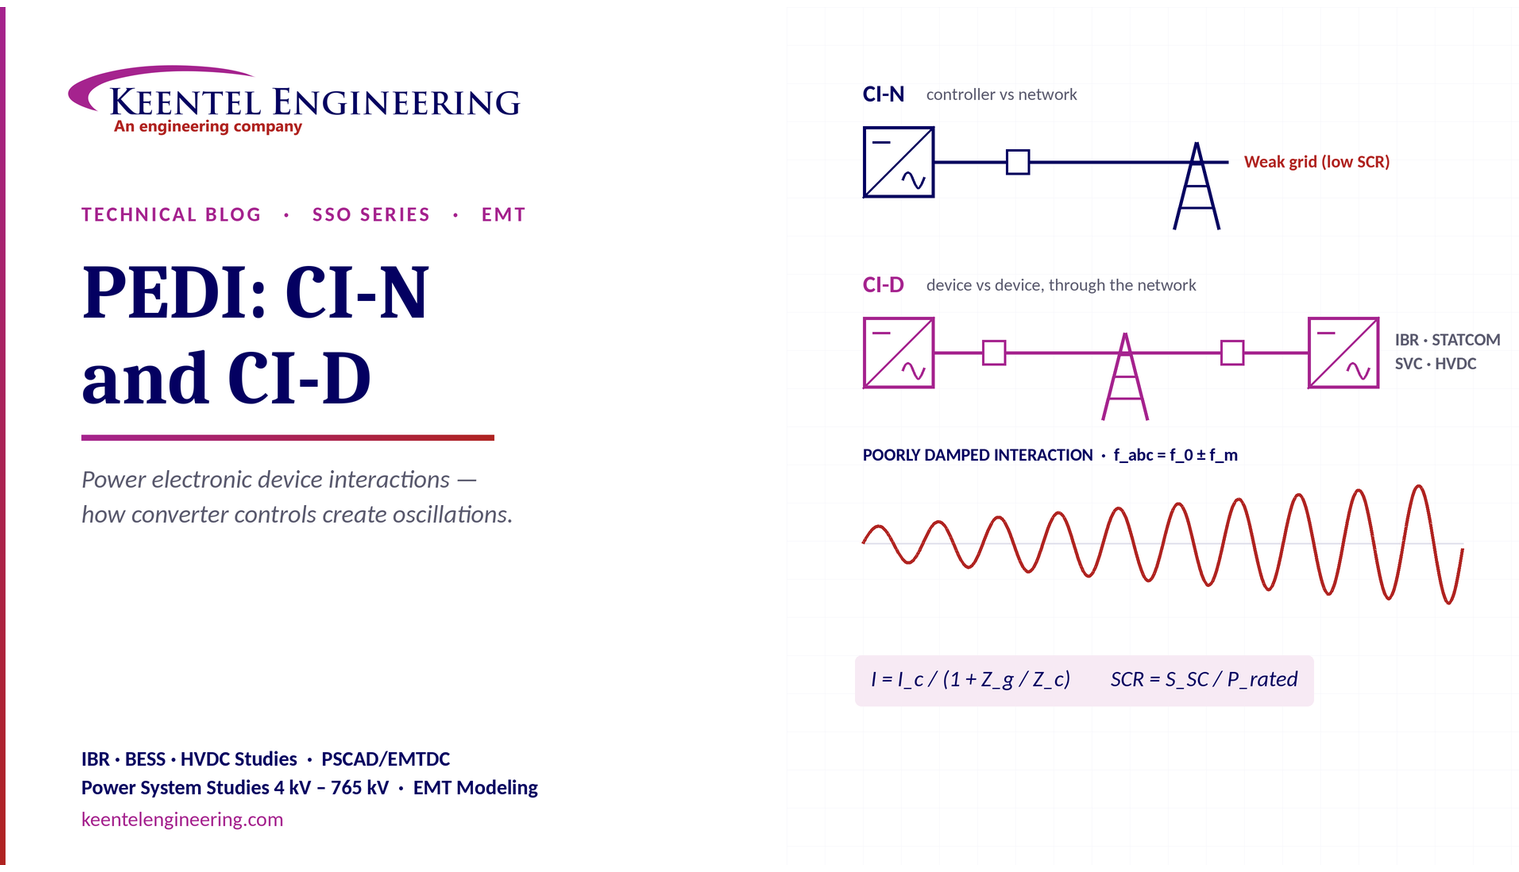
Power electronic device interactions (PEDI) are subsynchronous oscillations caused by the control systems of power-electronic devices: inverter-based resources (IBRs) such as solar, wind and battery plants, STATCOMs and SVCs, and HVDC converters. CIGRE Technical Brochure 909 (2023) places PEDI alongside subsynchronous resonance (SSR) in the subsynchronous oscillation (SSO) family, and divides it into two types: CI-N and CI-D.
CI-N and CI-D compared
| Item | CI-N — control interaction with the network | CI-D — control interaction between devices |
|---|---|---|
| What interacts | One converter's controls and the AC network | The controls of two or more nearby devices, through the network |
| Typical condition | Weak grid, low short-circuit ratio, series compensation or outages that raise network impedance | Electrically close IBR plants, STATCOMs, SVCs or HVDC converters with fast controls |
| Typical devices | A solar, wind or battery plant; an HVDC converter | Wind plant controllers, STATCOM/SVC, HVDC, multiple IBR plants |
| Impact | Poor damping, voltage and current oscillations, instability or trips | Control hunting, oscillations and trips |
| Why it is hard | Behaviour depends on grid strength, which changes with outages | Each device may be stable alone; the problem appears only when they are studied together |
How PEDI develops, in three steps
- A weak or sensitive network condition exists, for example low system strength after a line or transformer outage.
- Fast controls react strongly, because the converter's phase-locked loop, current or voltage controls see large voltage changes for small current changes.
- The interaction becomes poorly damped, and oscillations persist or grow.
Why engineers care
- Voltage and current oscillations that degrade power quality and stress equipment.
- Protection trips that disconnect plants and can cascade to neighbouring units.
- Reduced availability, often through operating constraints that limit plant output until the problem is solved.
Part B — Power Electronic Device Interactions: An In-Depth Engineering Guide to CI-N and CI-D
How converter controls create oscillations, how to screen and study CI-N and CI-D with impedance-based and EMT methods, and how to mitigate them on IBR-rich US transmission systems.
From SSO to PEDI
CIGRE TB 909, Guidelines for Subsynchronous Oscillation Studies in Power Electronics Dominated Power Systems, prepared by Joint Working Group C4/B4.52, classifies SSO into two branches.
Subsynchronous resonance (SSR) is rooted in network resonance, usually created by series capacitors, interacting with machines. PEDI is rooted in the controls of power electronic devices. It can occur with or without series compensation and without any rotating shaft.
PEDI matters more every year. Solar, wind and battery plants now make up most new generation in many US interconnection queues, and they are often connected far from large synchronous plants, at points of interconnection with low system strength. HVDC links and STATCOMs are being added to strengthen the same grids. The result is more fast controls, closer together, on weaker networks: the exact conditions in which PEDI appears.
Why converter controls interact with the grid
A typical grid-following (GFL) inverter has a layered control structure. Each layer has a characteristic bandwidth, and interactions usually appear near those bandwidths:
| Control layer | Function | Typical bandwidth or response | Interaction range it can affect |
|---|---|---|---|
| Inner current control | Regulates converter output current | Hundreds of hertz to over 1 kHz | Super-synchronous and harmonic range |
| Phase-locked loop (PLL) | Tracks grid voltage angle and frequency | About 10–50 Hz | Subsynchronous and near-synchronous range |
| DC-link voltage control | Balances DC and AC power | About 10–50 Hz | Subsynchronous range |
| Outer P, Q or AC voltage control | Regulates active and reactive power or terminal voltage | About 1–10 Hz | Low-frequency and subsynchronous range |
| Plant power plant controller | Regulates plant output at the point of interconnection | About 0.1–1 Hz, with communication delay | Low-frequency oscillations and control hunting |

If the converter is stable on an ideal grid, the interconnected system is stable when the ratio Z_g(s)/Z_c(s) satisfies the Nyquist stability criterion. In practice this means:
- A converter whose impedance has a negative real part over some frequency range is injecting energy at those frequencies.
- If the grid impedance resonates with the converter impedance in the same range, where the total reactance crosses zero and the total resistance is negative, an oscillation will grow.
- Weaker grids have larger Z_g, which increases the ratio and moves the system towards instability.
For CI-D, the same idea extends to several converters: each device's impedance becomes part of the "grid" seen by the others. Multi-input, multi-output (MIMO) impedance models in the dq frame capture the coupling between d- and q-axis behaviour that single-input models miss.
Mirror frequencies: why a 20 Hz oscillation shows up at 40 Hz and 80 Hz
Because a three-phase converter's controls work in a rotating reference frame, a disturbance at a modulation frequency f_m in the converter's control signals appears in the phase currents at two frequencies:
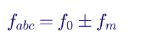
On a 60 Hz system, a 20 Hz oscillation in RMS voltage or power appears in the instantaneous phase quantities at 40 Hz (subsynchronous) and 80 Hz (supersynchronous). This coupling is why PEDI studies must cover frequencies above as well as below the fundamental, and why single-frequency analysis can be misleading.
It also matters for monitoring. AEMO's investigation of oscillations in Australia's West Murray Zone reported oscillations of about 17–19 Hz in RMS quantities, appearing in the instantaneous three-phase measurements at 50 Hz plus or minus the observed frequency.
System strength: SCR and WSCR
Short-circuit ratio is the first screening metric for grid strength at a point of interconnection:

Here S_SC is the three-phase short-circuit MVA at the POI without the plant's contribution, and P_rated is the plant rating in MW. Values below about 3 are commonly treated as weak and below about 2 as very weak, though thresholds vary by utility and equipment.
When several IBR plants are electrically close, each one's SCR overstates the real strength, because they all share the same short-circuit capacity. Weighted short-circuit ratio (WSCR), used by ERCOT and others, combines nearby plants:
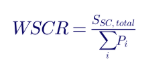
The simplified form above treats the plants as if connected to a common bus; fuller forms weight each plant by its electrical interaction with the others. A low WSCR is an early warning for both CI-N and CI-D.
CI-N in depth: one converter against the network
Mechanisms
- PLL-driven instability in weak grids, typically in the 5–30 Hz range.
- AC voltage or reactive power control with high gain against a high-impedance grid, producing voltage oscillations.
- Interaction with series-compensated lines, where the converter's negative-resistance region coincides with the series resonance.
- Time delays in digital control and measurement filtering, which reduce phase margin and can cause oscillations at higher frequencies.
Triggers
CI-N is often latent. A plant that is stable with all lines in service can oscillate after an outage reduces system strength. In the West Murray events, AEMO noted that during the 16 November 2021 event a 220/66 kV transformer was out of service for maintenance, reducing system strength in an area already characterised by low synchronous fault levels.
Signatures
Sustained or growing voltage, current or power oscillations at a few hertz to a few tens of hertz in RMS quantities; oscillations that start after a switching event or outage; and behaviour that changes with the number of inverters in service or the plant's operating point.
CI-D in depth: devices against each other
Mechanisms
- Voltage-control hunting between plant controllers, STATCOMs or SVCs regulating nearby buses with overlapping bandwidths and no coordination.
- Converter-to-converter interactions where each device's impedance creates a resonance for the others.
- Intra-plant interactions among many identical inverters within one large plant, sometimes with the plant controller.
- HVDC interactions with nearby IBR plants or FACTS devices, especially at weak AC terminals.
Why CI-D is hard to find
Each device is usually studied and tested by its own vendor and owner, often against a simplified grid. Each may be stable on its own. The oscillation appears only when realistic models of all nearby devices are studied together under weak-grid conditions. Responsibility for the combined study often falls between owners, vendors and the transmission planner.
A real-world example of multi-plant oscillations
AEMO's report on the West Murray Zone describes repeated oscillations of about 15–20 Hz, mostly 17–19 Hz, between 2020 and 2021. Events lasted from about 30 seconds to 45 minutes. Several solar farms (including Wemen, Bannerton, Karadoc, Yatpool and Kiamal) and wind farms (including Crowlands, Bulgana and Murra Warra) were investigated. AEMO did not establish a single clear cause, but found a number of potential contributing factors, consistent with interactions involving several plants in a low-strength area. As an interim measure during one event, AEMO limited Wemen and Bannerton solar farms to 38% of their inverters online while a transformer remained out of service, after which no significant oscillations were observed.
The lesson is that multi-plant interactions can persist for months, are hard to attribute, and can constrain output significantly while they are investigated.
Other documented cases
Large wind clusters with direct-drive (Type 4) turbines on weak networks in northern China have produced subsynchronous oscillations that propagated through the grid. In a widely studied 2015 event in Xinjiang, such oscillations excited torsional modes of distant thermal generators, leading to unit trips. That case shows how a control interaction (PEDI) can escalate into torsional interaction with devices (TI-D), crossing the branches of the SSO classification.
Studying CI-N and CI-D
Screening
| Screening method | What it reveals |
|---|---|
| SCR and WSCR | Whether the POI and the cluster of nearby IBRs are weak |
| Outage contingency review | Which outages reduce system strength or create radial connections |
| Electrical distance between devices | Which converters can interact with each other |
| Vendor impedance characteristics | Frequency ranges where each converter shows negative damping |
| Passive frequency scan of the network | Network resonances that may line up with negative-damping ranges |
Detailed studies
- EMT time-domain simulation with real-code vendor models in PSCAD/EMTDC or similar tools. This is the reference method, because it includes the actual control code, limiters, protection and non-linear behaviour.
- Active frequency scans, injecting small perturbations into the EMT model to measure each device's impedance across a wide frequency range, using MIMO methods to capture dq coupling.
- Impedance-based stability assessment, applying the Nyquist or generalised Nyquist criterion to the measured impedances.
- Small-signal injection studies, injecting voltage magnitude or angle modulation and measuring the damping of the response.
- Eigenvalue analysis, where linearised models are available, to find modes, damping ratios and participation factors.
Emerging performance criteria
System operators are beginning to publish quantitative criteria. As one example, Great Britain's NESO guidance on oscillation assessment for IBRs (September 2025) requires assessment with detailed EMT models over 1–100 Hz for voltage magnitude injection and 1–49 Hz for voltage angle modulation, with active frequency scans to 500 Hz. It expects oscillations of no more than 5% peak-to-peak with a settling time under 2 s, a minimum 10% damping ratio for all modes in eigenvalue analysis, and stability judged by eigenloci that do not encircle the critical point (−1, 0). US requirements vary by system operator, and many now require validated EMT models for new IBR interconnections.
Model requirements
PEDI studies are only as good as the models. Essential practices include:
- Real-code EMT models that use the vendor's actual control code and firmware version.
- Model benchmarking between EMT and positive-sequence models, and against factory or field tests.
- Firmware version control, because a control update after commissioning can change interaction behaviour.
- Models of neighbours, obtained through the transmission planner under appropriate confidentiality.
Mitigation
Mitigation should be validated in the same EMT study set that identified the problem, across all relevant operating conditions and outages.
Monitoring: seeing PEDI in the field
Many PEDI oscillations are in the 5–50 Hz range. Synchrophasor measurements at standard reporting rates of 30 or 60 frames per second can alias or filter oscillations at the higher end of that range. Point-on-wave recording at kilohertz sample rates, high-speed digital fault recorders and plant-level data recorders are needed to capture and diagnose them. Requiring high-resolution monitoring at IBR plants, and keeping the data long enough to analyse events, makes post-event investigation far more effective.
How Keentel Engineering helps
Keentel Engineering delivers power system studies from 4 kV to 765 kV, with EMT modelling for IBR, BESS, HVDC and FACTS interconnections.
| Parameter | TCS (PG25) | FWS (water) |
|---|---|---|
| Heat load | 1,000 kW | 1,000 kW plus pump heat |
| Supply temperature | 30 °C | 25 °C (approach 5 K; ASHRAE W27) |
| Return temperature | ≈ 40 °C | ≈ 33 °C |
| Temperature rise | ≈ 10 K | 8 K |
| Flow | 1,500 L/min (1.5 L/min per kW) | ≈ 1,800 L/min |
Connecting a solar, wind, battery or HVDC project in a weak or crowded part of the grid? Talk to Keentel Engineering at (813) 389-7871, contact@keentelengineering.com, or book a 15-minute scoping call at calendly.com/keentel-engineering/15min.
Part C — Case Studies
The following are illustrative scenarios based on conditions typical of IBR interconnections on US transmission systems. They show how Keentel Engineering approaches PEDI problems; site details are generalised and figures are rounded.
Case Study 1 — CI-N at a weak 138 kV solar POI
Situation. A 200 MW solar plant connects to a 138 kV line far from synchronous generation. With all lines in service, the SCR at the POI is about 3. Interconnection studies flag that an outage of a parallel 138 kV line reduces the SCR to about 1.6.
Analysis. EMT simulations with the inverter vendor's real-code model show stable operation with all lines in service, but a growing oscillation near 12 Hz in the RMS voltage after the outage. Active frequency scans show the inverter's impedance has a negative real part in the 8–15 Hz range at low SCR, driven by the PLL and voltage control loops.
Engineered solution. The vendor provides a weak-grid control setting with reduced PLL bandwidth and retuned voltage control gains, validated in EMT across the outage set. A contingency-based output limit is defined for the rare case of a second overlapping outage.
Outcome. The plant remains stable across all studied outages at full output, and the operating limit applies only to an unlikely double-outage condition.
Case Study 2 — CI-D between a wind plant and a battery plant
Situation. A 300 MW wind plant and a 150 MW battery plant connect to nearby 345 kV buses in a weak area. Both plant controllers regulate POI voltage tightly. Each plant passed its own interconnection studies.
Analysis. A combined EMT study with both real-code models shows slow voltage oscillations near 1 Hz, with the two plant controllers hunting against each other after a fault. A separate faster interaction near 18 Hz appears between the battery's inverters and the wind turbine converters at minimum system strength.
Engineered solution. Plant controller modes are changed from tight voltage control to coordinated voltage droop with matched deadbands, and the battery vendor retunes inner control parameters for the weak-grid case. Both changes are validated together in the combined model.
Outcome. Both plants operate together without hunting, and the 18 Hz interaction is well damped at minimum system strength.
Case Study 3 — Pre-connection study for a battery plant near HVDC and a STATCOM
Situation. A developer plans a 250 MW battery plant near an existing VSC-HVDC terminal and a transmission STATCOM. The system operator requires an oscillation assessment before connection.
Analysis. Keentel obtains models of the neighbouring devices through the transmission planner and runs MIMO frequency scans of the battery plant, HVDC terminal and STATCOM. The impedance analysis predicts a poorly damped interaction near 7 Hz under minimum generation and one specific outage. EMT simulation confirms an oscillation with damping below the operator's criterion.
Engineered solution. The battery vendor implements a firmware change adding active damping in the identified range, and the plant controller's reactive power ramp is coordinated with the STATCOM's voltage control. The study is repeated with the updated firmware.
Outcome. The assessment meets the operator's damping criteria before commercial operation, avoiding a post-connection constraint.
Part D — Technical FAQ: PEDI, CI-N and CI-D
Power electronic device interactions are subsynchronous oscillations caused by the controls of power-electronic devices such as inverter-based resources, STATCOMs, SVCs and HVDC converters. CIGRE TB 909 classifies PEDI as one of the two main branches of subsynchronous oscillation, alongside subsynchronous resonance.
SSR is rooted in a network resonance, usually from series capacitors, interacting with machines and sometimes their shafts. PEDI is rooted in converter controls, and can occur without series compensation or any rotating machine.
Control interaction with the network: one converter's controls interact with the AC system, typically when the grid is weak. The result can be poor damping, voltage and current oscillations, instability or trips.
Control interaction between devices: the controls of two or more nearby devices interact through the network. Examples involve wind plant controls, STATCOMs, SVCs and HVDC converters. The result can be control hunting, oscillations and trips.
In a weak grid, a converter's own current noticeably changes its terminal voltage. Its controls, especially the PLL and voltage control, then partly react to their own effect, which can create negative damping. Weak grids also increase the network impedance that converter impedances can resonate with.
Typically from a few hertz to several tens of hertz in RMS quantities, but interactions can also appear near and above the fundamental. Because of dq-frame coupling, a modulation at frequency f_m appears in phase quantities at f_0 ± f_m.
Converter controls operate in a rotating reference frame. A 20 Hz modulation of voltage or power appears in the instantaneous three-phase currents and voltages at 60 − 20 = 40 Hz and 60 + 20 = 80 Hz. Studies and monitoring must look at both.
The PLL tracks the grid voltage angle. In a weak grid, its measurement is influenced by the converter's own current, creating a feedback path. A high PLL bandwidth can turn that feedback into negative damping, typically in the subsynchronous range.
Short-circuit ratio is the short-circuit MVA at the point of interconnection divided by the plant's MW rating. Values below about 3 are commonly considered weak and below about 2 very weak, although criteria vary by utility and equipment.
When several IBR plants are electrically close, each plant's individual SCR overstates the available grid strength because they share it. Weighted SCR combines the plants' ratings against the shared short-circuit capacity, giving a better indicator of interaction risk.
Yes. Studies may not cover every outage combination, neighbouring plants may have been added later, or control firmware may have changed after commissioning. CI-D in particular often appears only when several devices are studied together.
PEDI depends on the details of converter control: PLL design, filters, delays, limiters and plant controller logic. Generic or simplified models cannot reproduce these reliably. Real-code models use the vendor's actual control code and are the basis for credible studies.
Each converter and the network are represented by frequency-dependent impedances. The interconnected system is assessed with the Nyquist criterion applied to the ratio of grid to converter impedance. Negative-resistance regions in a converter's impedance that coincide with network resonances indicate risk.
A multi-input, multi-output scan measures the converter's impedance as a matrix in the dq frame, capturing coupling between axes and between mirror frequencies. It is more accurate than single-input scans for PEDI and is increasingly specified by system operators.
Criteria vary. As an example, NESO guidance in Great Britain expects oscillations of no more than 5% peak-to-peak, settling within 2 s, and a minimum 10% damping ratio for all modes in eigenvalue analysis. US requirements depend on the system operator and are developing.
Usually through converter control retuning, such as reduced PLL bandwidth or adjusted voltage control gains, active damping, grid-forming controls, system strength improvements such as synchronous condensers, or operating limits under specific outages.
Through coordinated tuning of the interacting devices: matched deadbands and droop for plant voltage controllers, retuned inner controls, supplementary damping controllers in STATCOM or HVDC controls, and operating coordination. Solutions must be validated with all devices modelled together.
They can improve stability in weak grids because they behave as voltage sources, but they are not automatically immune. Grid-forming controls have their own dynamics and can interact with other devices. They must be validated with EMT studies for the specific system.
Yes. They add short-circuit strength and inertia, reducing grid impedance and making converter controls less likely to interact with the network. They are a common system-strength solution in weak areas, though they add cost and their own maintenance requirements.
AEMO reported repeated oscillations of about 15–20 Hz, mostly 17–19 Hz, in 2020 and 2021 in a low-strength area with several solar and wind farms. A single clear cause was not established. During one event, output constraints limiting two solar farms to 38% of inverters online stopped the oscillations while a transformer was out of service.
Yes, if the oscillation frequency complements a nearby generator's torsional mode. Converter-driven oscillations from wind clusters in China have excited torsional modes of distant thermal units, leading to trips. This is where PEDI crosses into torsional interaction with devices.
At 30 or 60 frames per second, synchrophasor data can alias or filter oscillations in the upper subsynchronous range. Point-on-wave recorders and high-speed fault recorders sampling at kilohertz rates are needed to capture and diagnose them.
Responsibility is often shared. Each developer studies its own plant, while the transmission planner or system operator holds the models of neighbouring devices. Effective CI-D studies need the planner to coordinate data sharing and multi-device studies.
It should. Changes to control code, settings or parameters can alter a converter's impedance and interaction behaviour. Many system operators require notification and model updates for firmware changes, and prudent owners restudy interaction risk where the plant is in a weak area.
Screening belongs in the earliest interconnection studies, once the POI and neighbouring devices are known. Detailed EMT and impedance studies should follow vendor selection and be repeated when firmware, plant design or the surrounding network changes.
References and Further Reading
Links were current at publication (October 2026).
- CIGRE Technical Brochure 909, Guidelines for Subsynchronous Oscillation Studies in Power Electronics Dominated Power Systems. CIGRE JWG C4/B4.52, 2023.
- West Murray Zone Power System Oscillations 2020–2021. Australian Energy Market Operator, February 2023.
- Guidance on Oscillation Assessment for Inverter Based Resources. National Energy System Operator (NESO), September 2025.
- Dealing with interactions in modern power electronics dominated power systems. CIGRE.
Disclaimer
This article is general technical information for educational purposes. It is not engineering advice for any specific project and does not create a professional relationship. Control bandwidths, frequency ranges, SCR thresholds and damping criteria are indicative; project-specific requirements are set by the applicable system operator and must be confirmed by studies with validated models. Events are summarised from public reports. Verify the current edition of any standard or guideline before relying on it.
Case studies are illustrative scenarios based on typical project conditions, not records of specific client projects. Figures are rounded and indicative.
CIGRE, AEMO, NESO, PSCAD/EMTDC and other names are the property of their respective owners. Keentel Engineering is not affiliated with or endorsed by these organisations or any equipment manufacturer.
| Office | Address | Phone |
|---|---|---|
| Head Office — Tampa | 400 N Ashley Dr STE #2600, Tampa FL 33602 | (813) 389-7871 |
| Austin | 5900 Balcones Drive STE 100, Austin TX 78731 | (512) 591-0752 |
| Sacramento | 1401 21st St Ste R, Sacramento CA 95811 | (916) 913-4524 |
| Baltimore | 306 W Redwood St STE 200, Baltimore MD 21201 | (410) 225-2181 |
contact@keentelengineering.com · keentelengineering.com · calendly.com/keentel-engineering/15min
State of Florida — Registry No. 36853, KEENTEL LLC, DBA: KEENTEL ENGINEERING
Copyright 1995–2026 Keentel Engineering. All Rights Reserved.

About the Author:
Sandip "Sonny" R. Patel, P.E.
IEEE Senior Member · Founder & CEO, Keentel Engineering
In 1995, Sonny Patel earned his Electrical Engineering degree from the University of Illinois. But degrees don't build legacies — action does.
For three decades, he has worked the power industry from every side of the table: 16 years as a utility engineer at Exelon/Commonwealth Edison; generation leadership across hydroelectric, industrial steam turbine, and a 9 GW renewable fleet; NERC Regional Entity Senior Compliance Engineer and Audit Team Lead, auditing some of the nation's largest utilities; and testing and commissioning lead on equipment up to 765 kV — the very top of the North American grid.Utility. Generator. Regulator. Consultant. Few engineers have seen all four seats. Fewer still have sat in them.
His experience spans nuclear, hydro, conventional generation, renewables, oil and gas, mining — and today's data centers, where he is authoring a three-book series on data center design. He is a Licensed Professional Engineer in six states and a Licensed Electrical Contractor in Florida (Unlimited EC) — he doesn't just design the work; he's qualified to stand behind its execution.Today, as Founder and CEO of Keentel Engineering, Sonny leads a nationwide team of engineers delivering substation design, power system studies, NERC compliance, and commissioning — done right, coast to coast.Three decades. Every side of the table. One standard: accountable engineering.
Services

Let's Discuss Your Project
Let's book a call to discuss your electrical engineering project that we can help you with.
About the Author:
Sandip "Sonny" R. Patel, P.E.
IEEE Senior Member · Founder & CEO, Keentel Engineering
In 1995, Sonny Patel earned his Electrical Engineering degree from the University of Illinois. But degrees don't build legacies — action does.
For three decades, he has worked the power industry from every side of the table: 16 years as a utility engineer at Exelon/Commonwealth Edison; generation leadership across hydroelectric, industrial steam turbine, and a 9 GW renewable fleet; NERC Regional Entity Senior Compliance Engineer and Audit Team Lead, auditing some of the nation's largest utilities; and testing and commissioning lead on equipment up to 765 kV — the very top of the North American grid.
Utility. Generator. Regulator. Consultant. Few engineers have seen all four seats. Fewer still have sat in them.
His experience spans nuclear, hydro, conventional generation, renewables, oil and gas, mining — and today's data centers, where he is authoring a three-book series on data center design. He is a Licensed Professional Engineer in six states and a Licensed Electrical Contractor in Florida (Unlimited EC) — he doesn't just design the work; he's qualified to stand behind its execution.
Today, as Founder and CEO of Keentel Engineering, Sonny leads a nationwide team of engineers delivering substation design, power system studies, NERC compliance, and commissioning — done right, coast to coast.Three decades. Every side of the table. One standard: accountable engineering.
Leave a Comment
Thank you for contacting us.
We will get back to you as soon as possible.
We will get back to you as soon as possible.
Oops, there was an error sending your message.
Please try again later.
Please try again later.
Related Posts
By SANDIP R PATEL
•
October 3, 2026
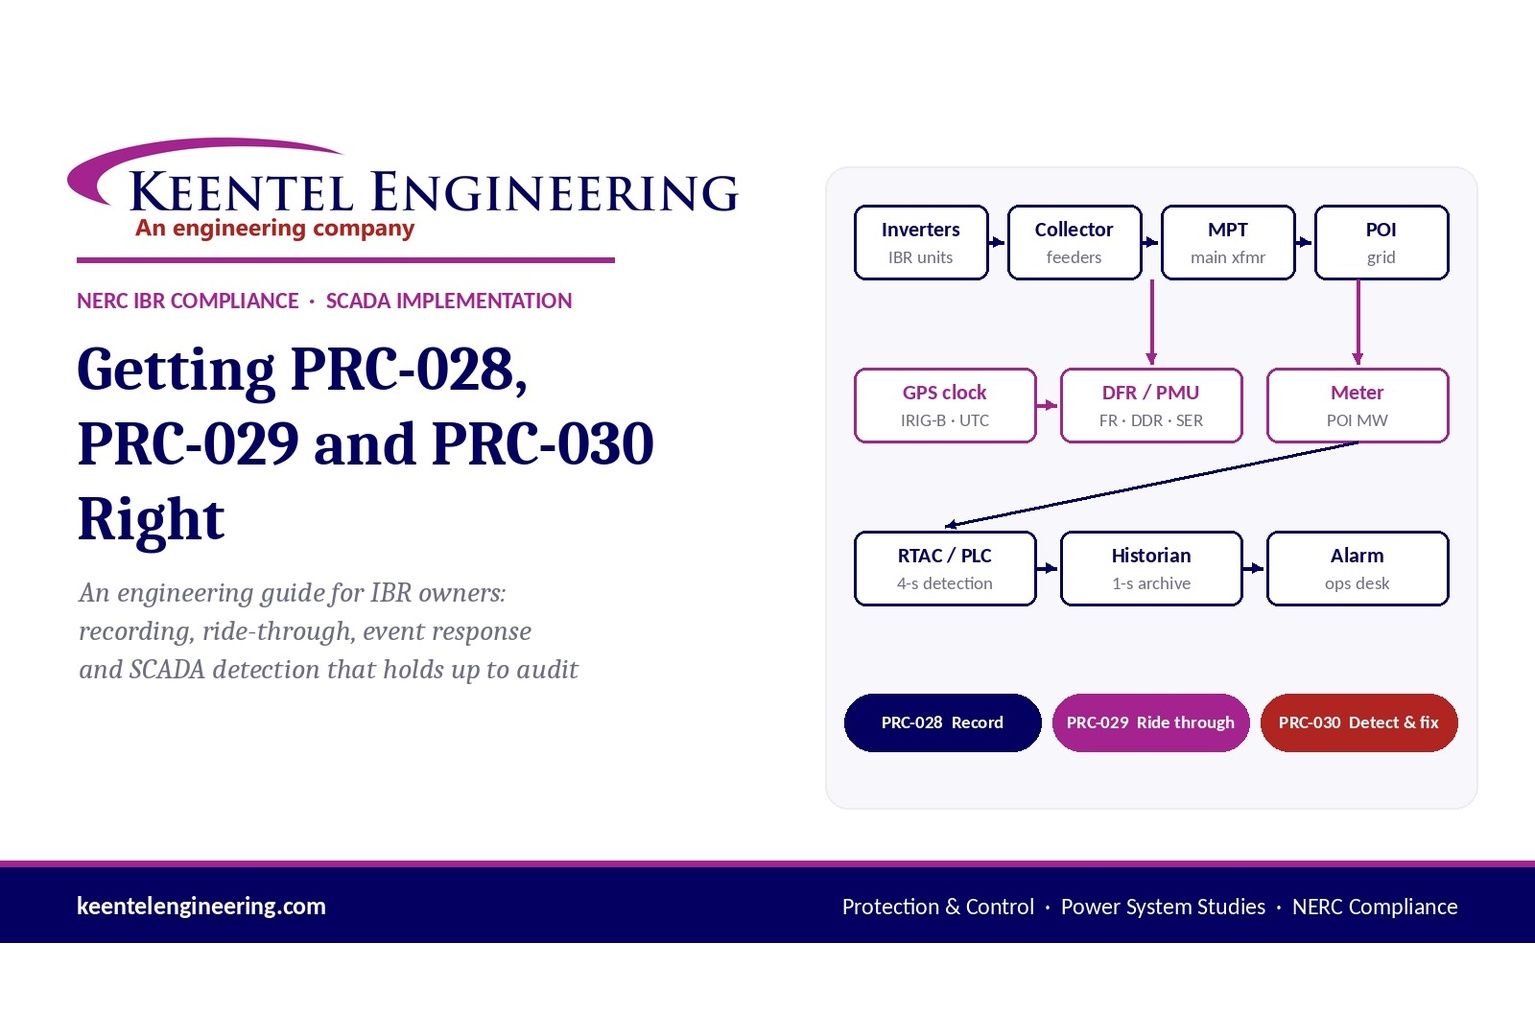
Engineering guide to PRC-028 disturbance recording, PRC-029 ride-through and PRC-030 event detection for inverter-based resources.
By SANDIP R PATEL
•
October 3, 2026
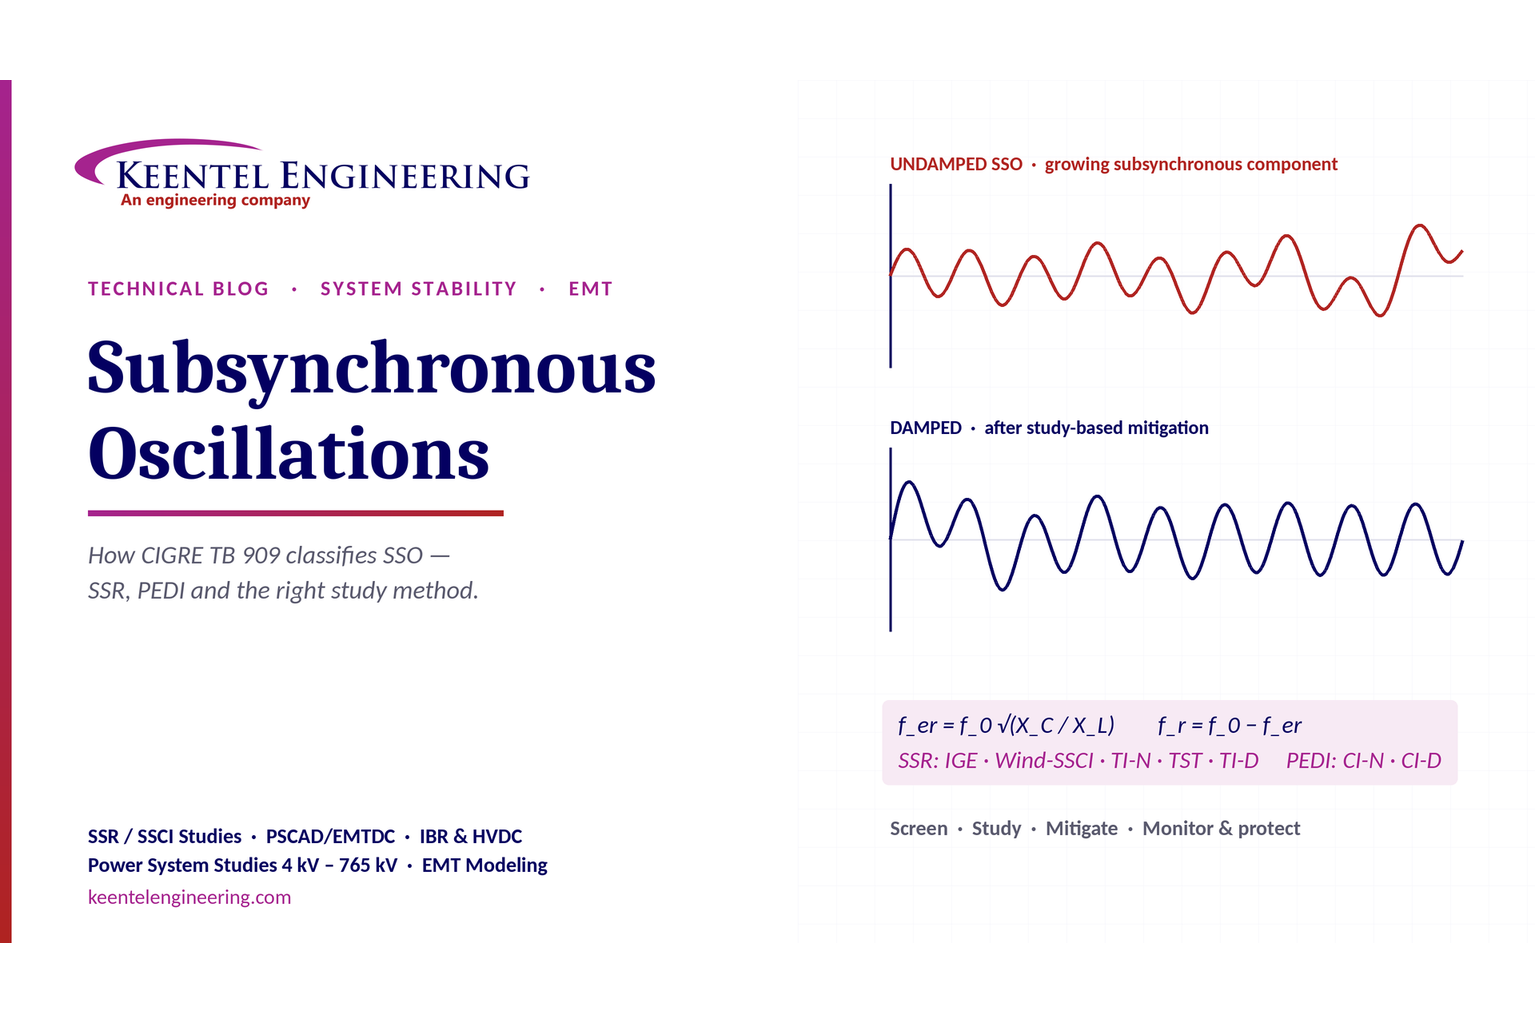
A practical guide to SSO classification, SSR, PEDI, Wind-SSCI, EMT analysis, mitigation and protection based on CIGRE TB 909.
By SANDIP R PATEL
•
October 3, 2026
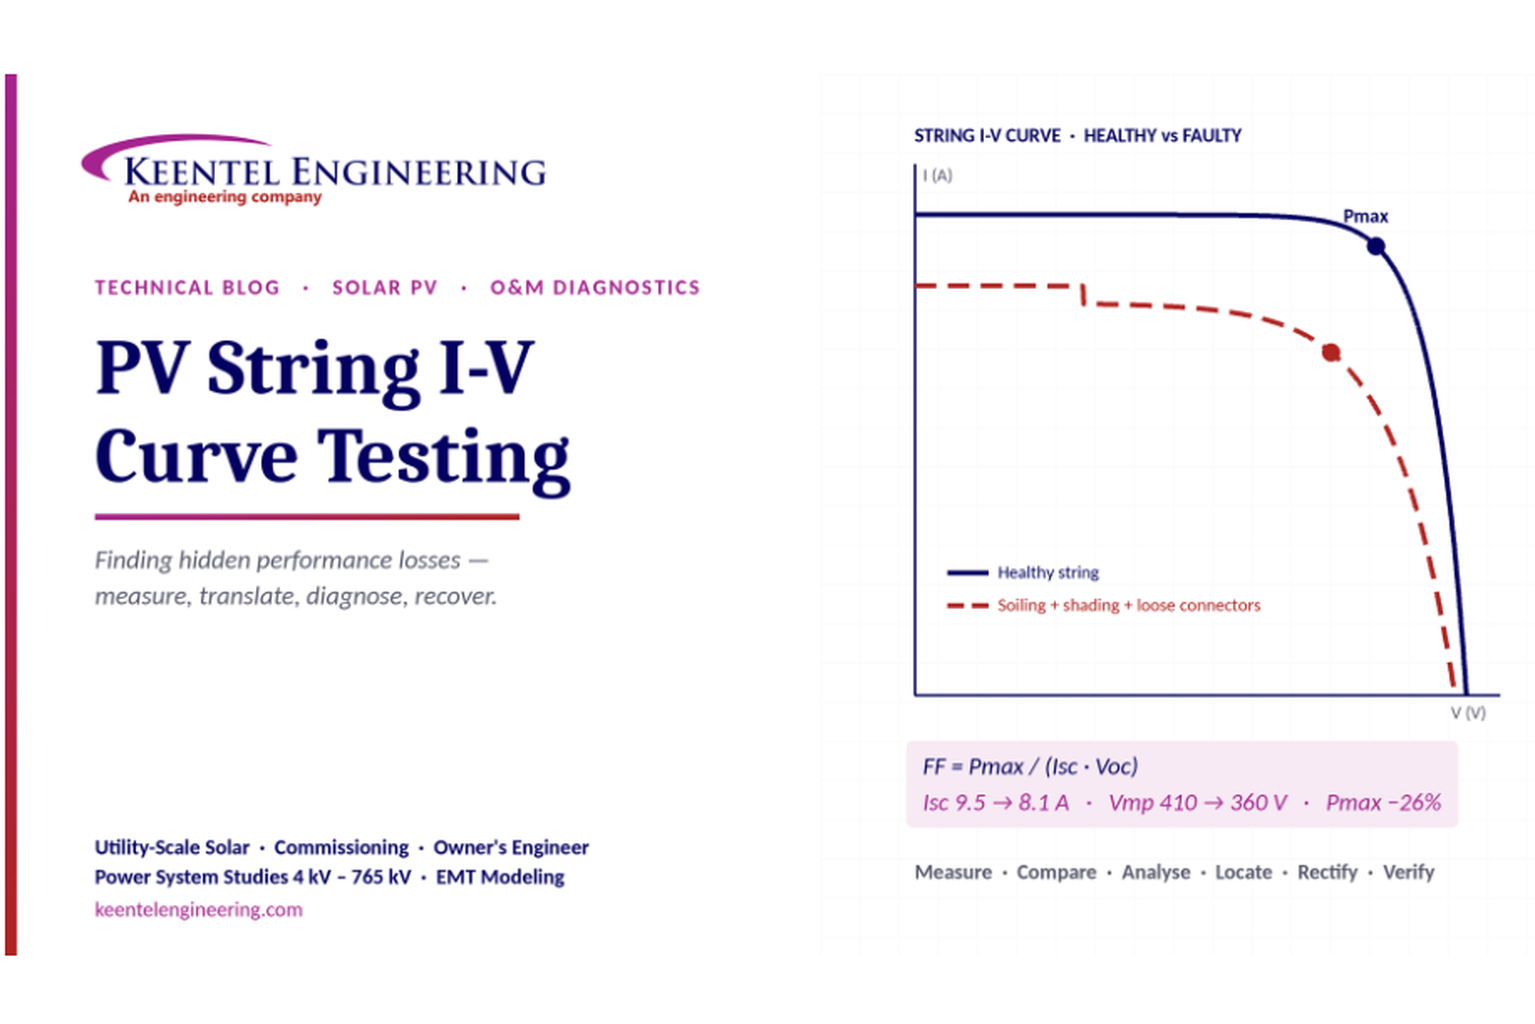
Learn how PV string I-V curve testing identifies hidden solar performance losses, including soiling, shading, mismatch, degradation, and wiring faults.
By SANDIP R PATEL
•
October 3, 2026
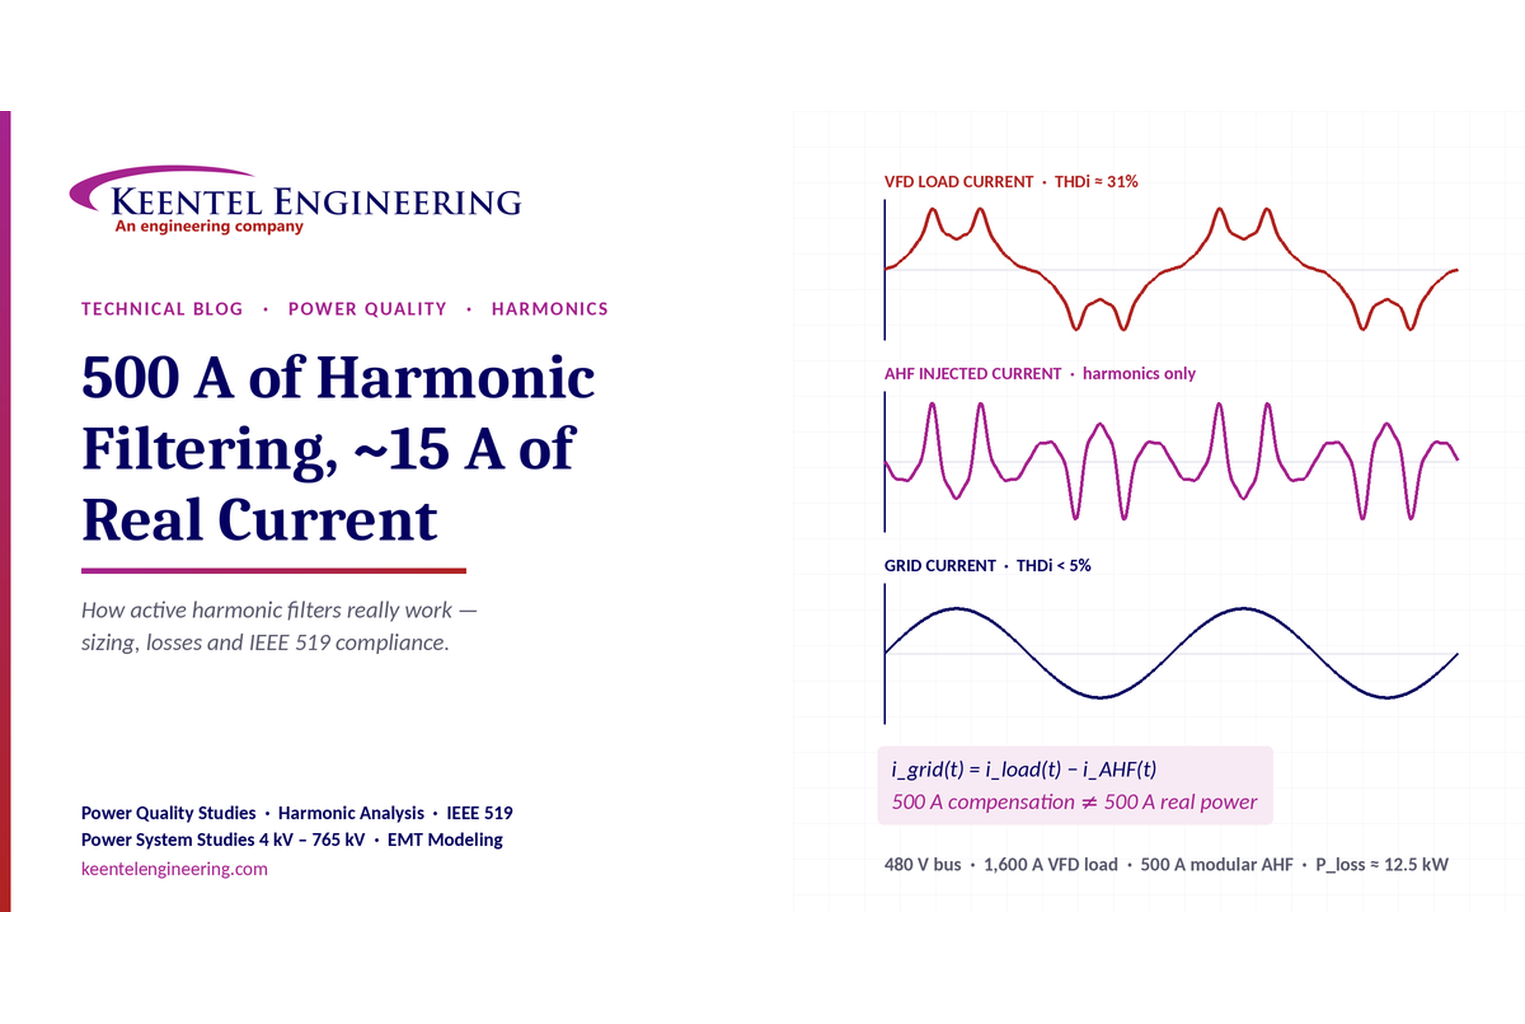
Learn how active harmonic filters work, how to size AHF systems, reduce VFD harmonics, calculate losses, and meet IEEE 519 TDD limits at the PCC.
By SANDIP R PATEL
•
October 3, 2026
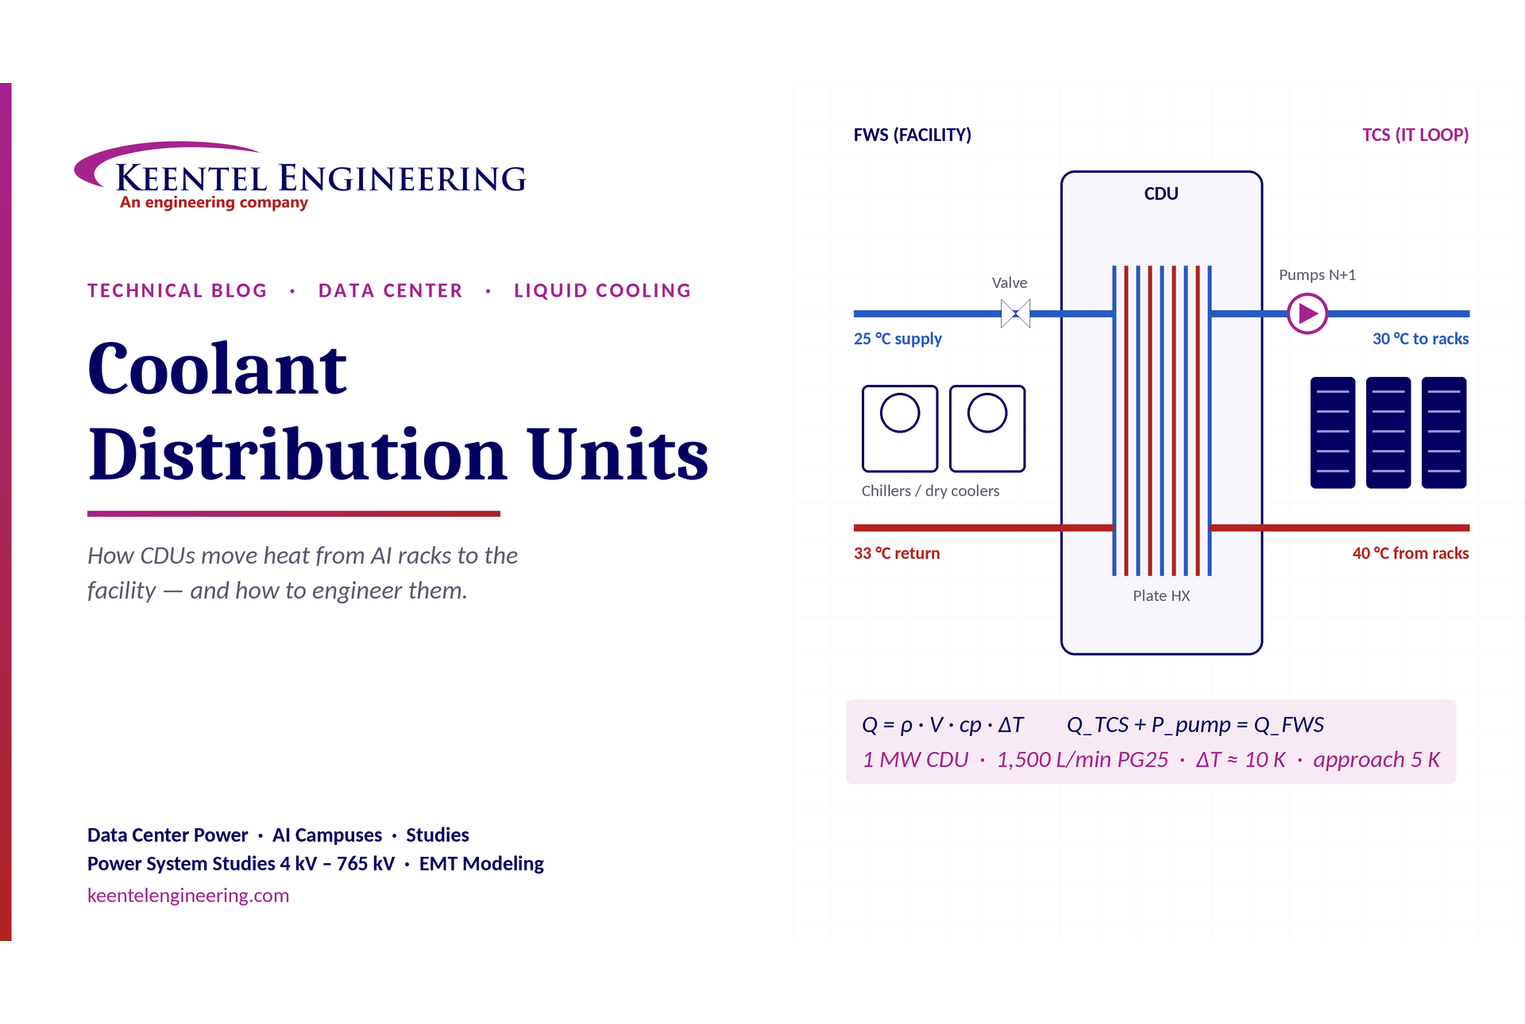
Learn how data center coolant distribution units (CDUs) work, including FWS and TCS loops, heat transfer, sizing, redundancy and liquid cooling for AI data centers.
By SANDIP R PATEL
•
October 3, 2026
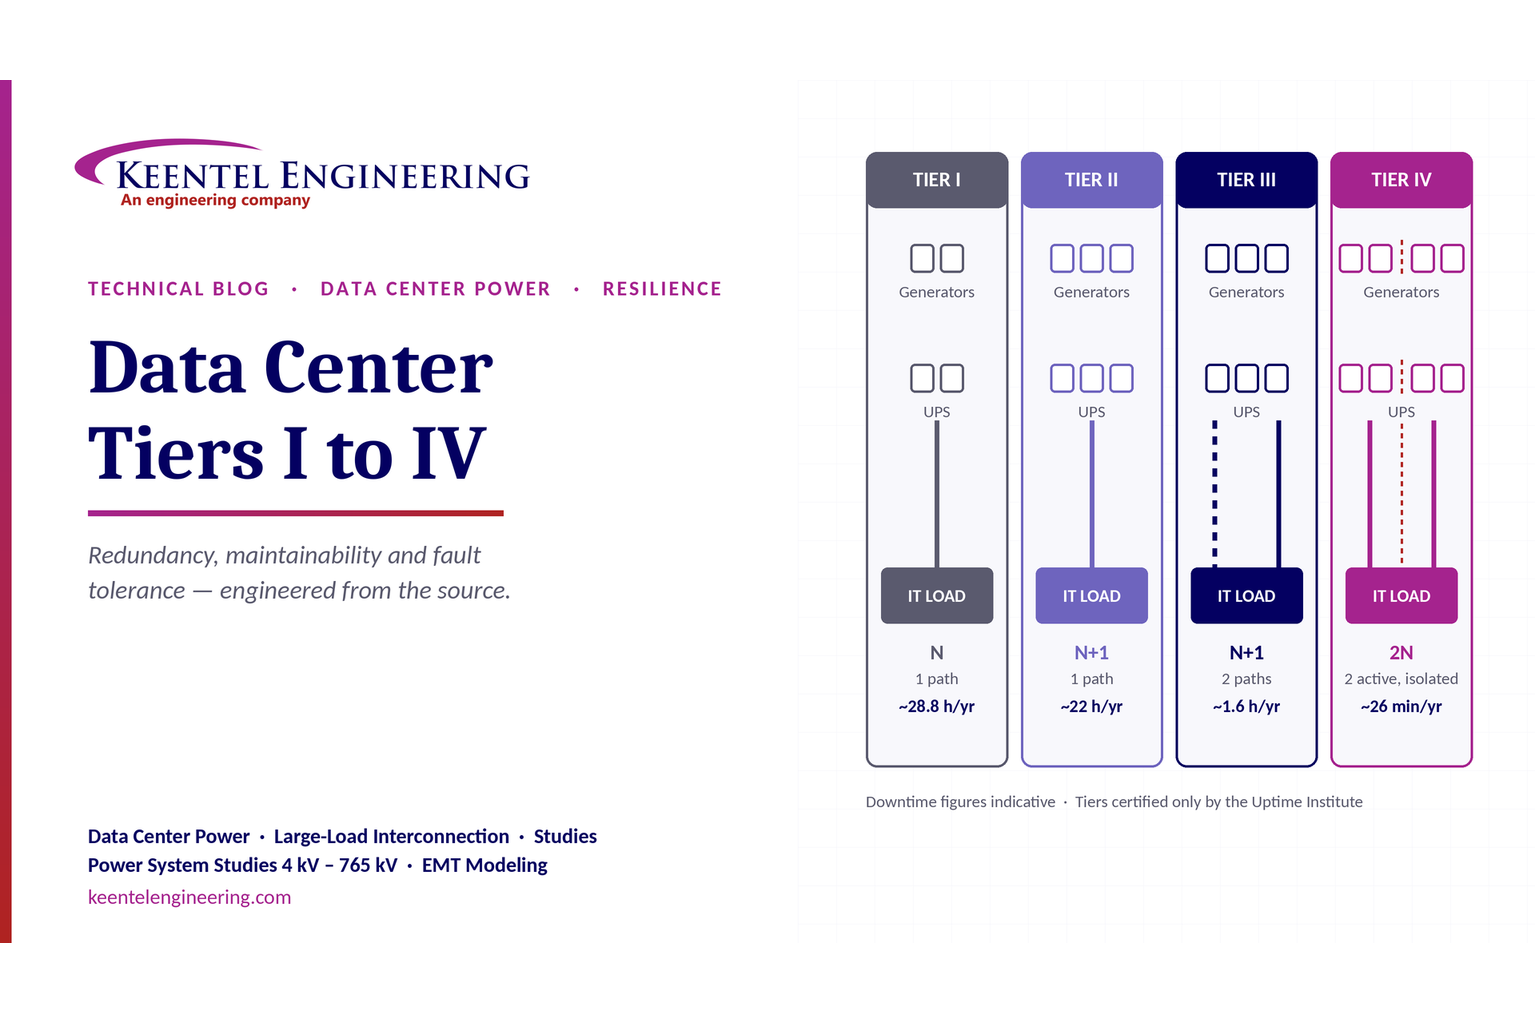
Compare Data Center Tiers I–IV, including redundancy, uptime, Tier III concurrent maintainability, Tier IV fault tolerance, UPS, generators and power design.
By SANDIP R PATEL
•
October 3, 2026
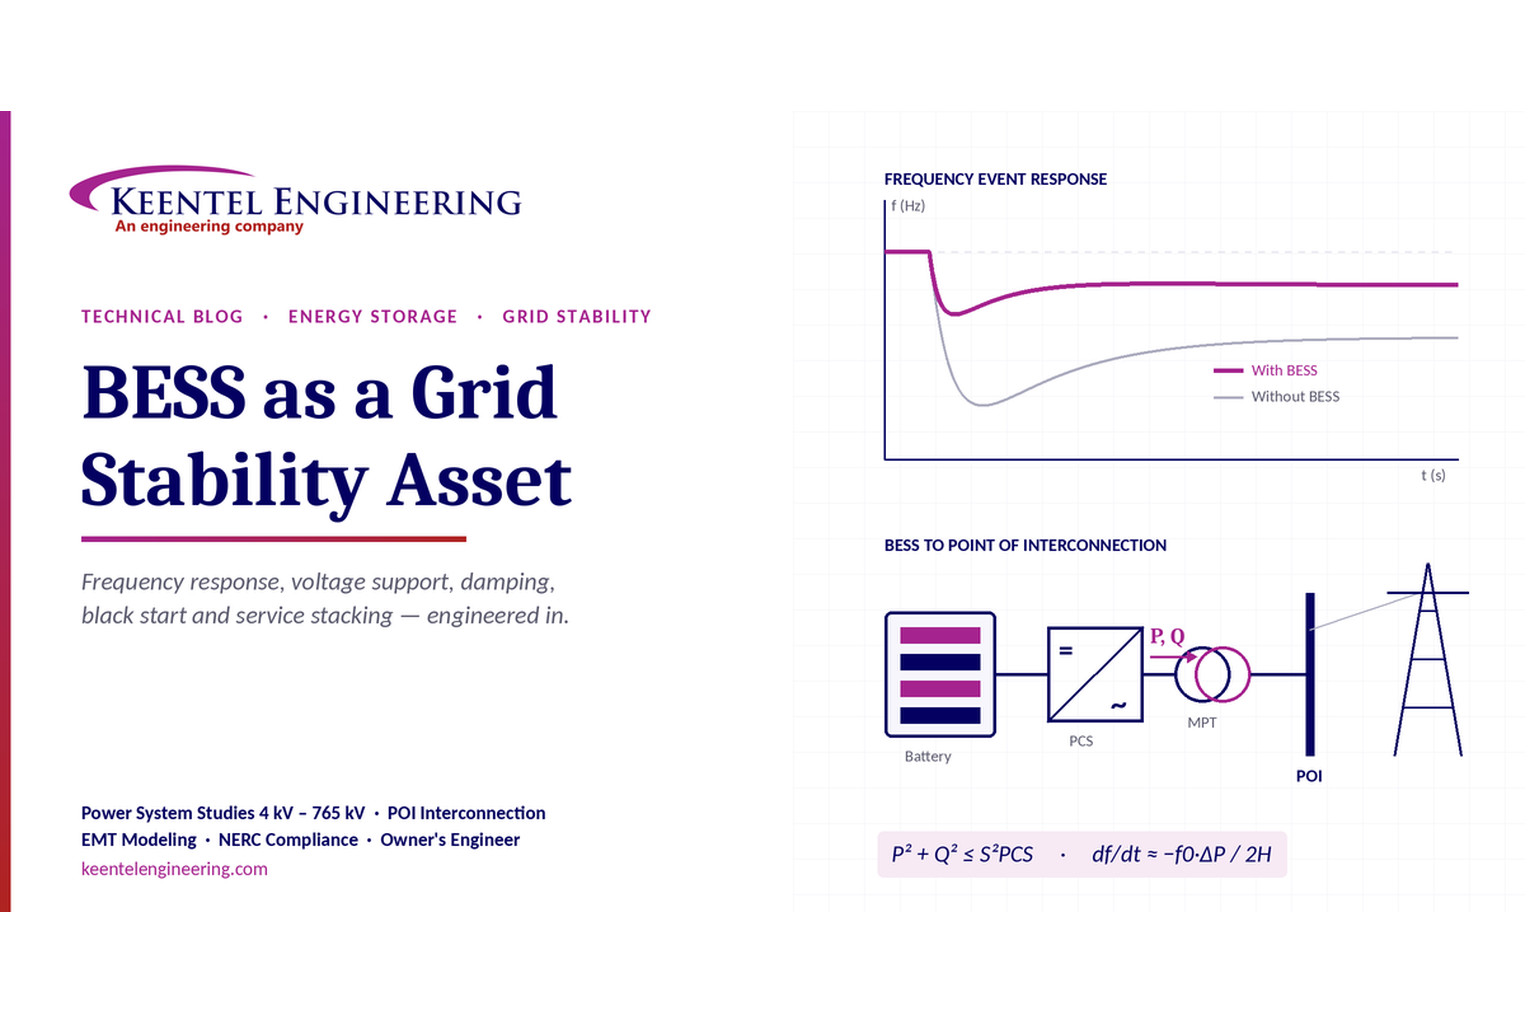
Learn how BESS supports grid stability through fast frequency response, voltage support, oscillation damping, black start, grid-forming controls and EMT studies.
By SANDIP R PATEL
•
October 3, 2026
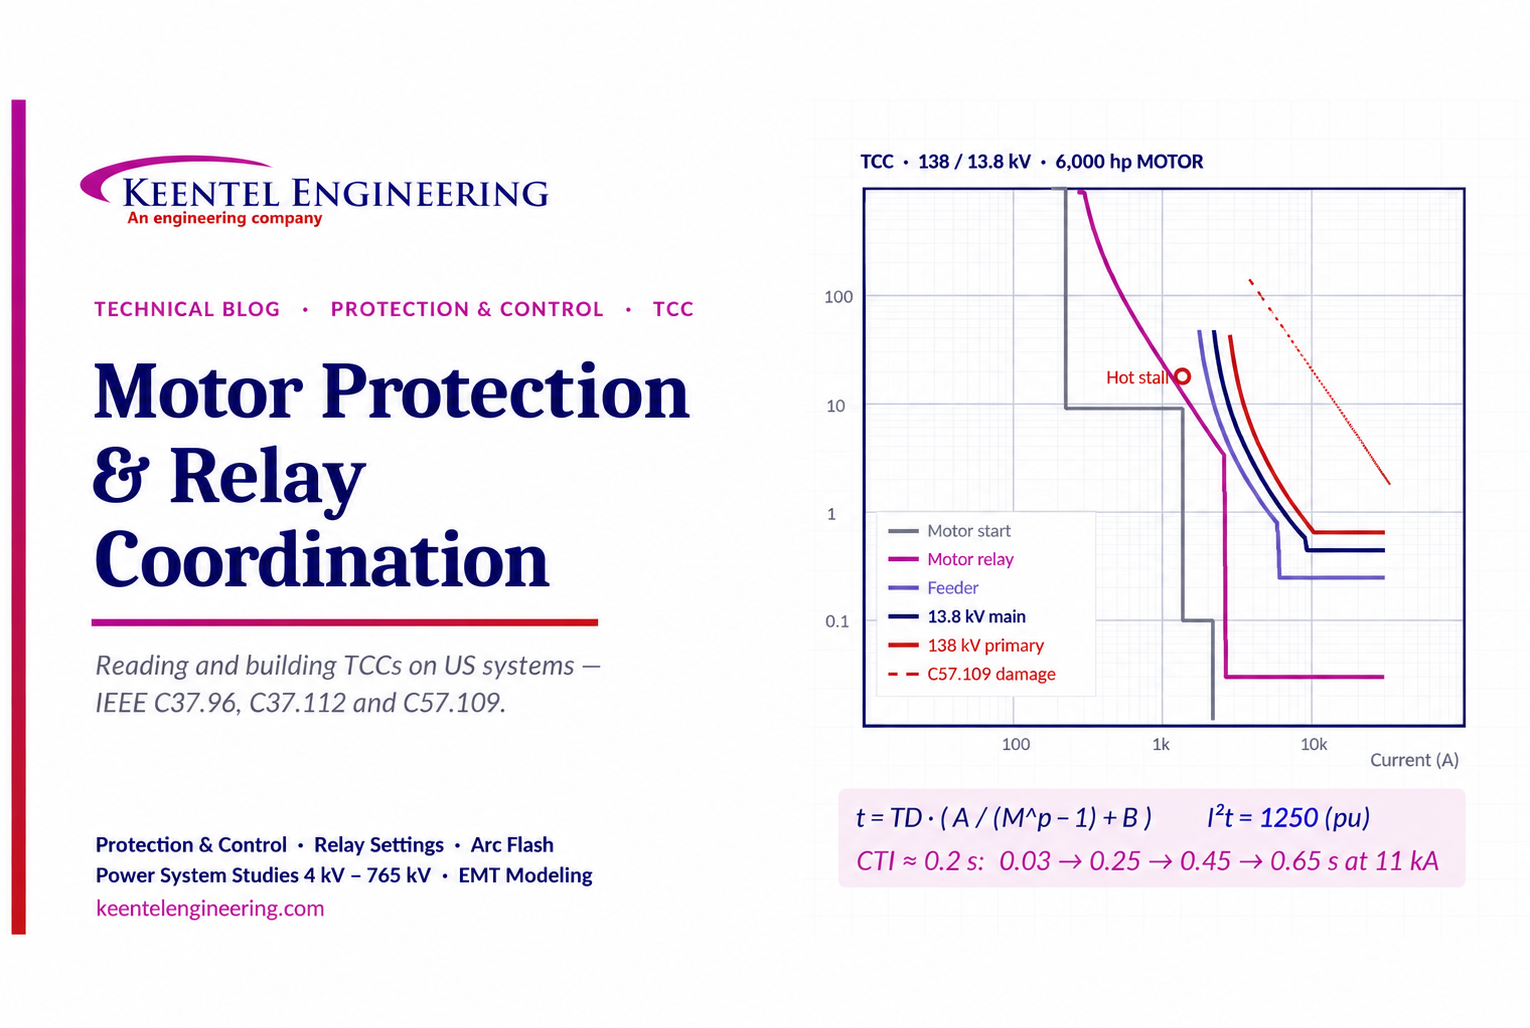
Learn motor protection and relay coordination using TCC curves, IEEE standards, transformer damage limits, CTI settings and a 138/13.8 kV example.
By SANDIP R PATEL
•
September 30, 2026
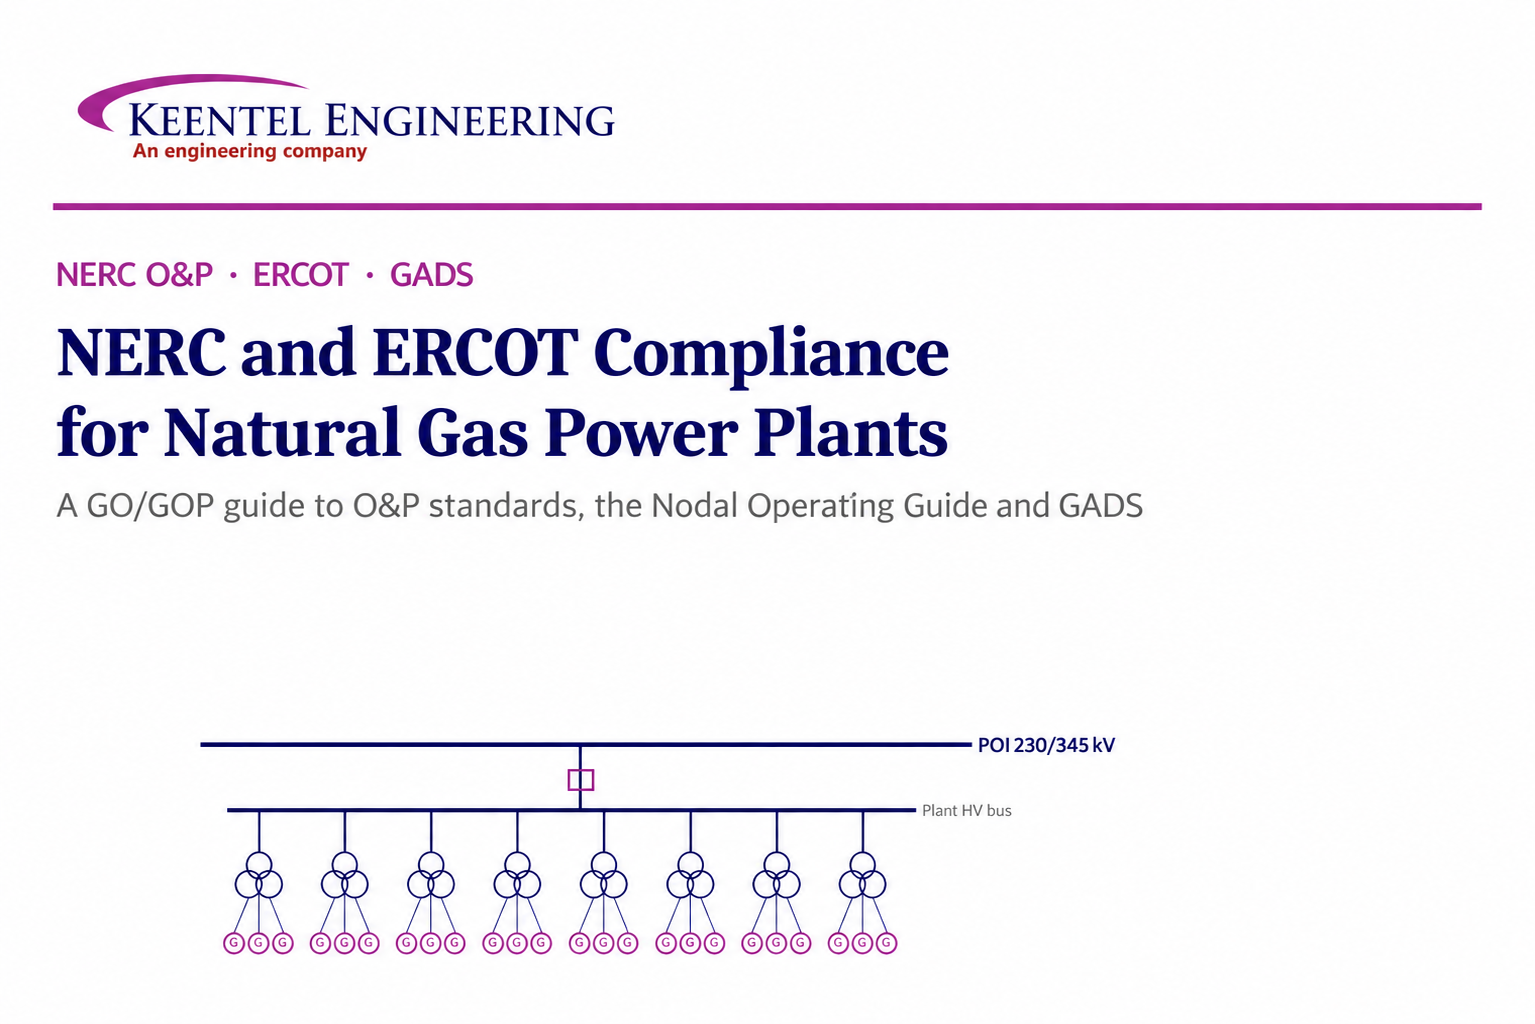
Learn NERC and ERCOT compliance requirements for natural gas power plants, including GO/GOP obligations, O&P standards, GADS reporting, and audits.





