Part A — When LVRT Becomes HVRT at a Glance
A transmission fault 30 miles from a solar plant is cleared in five cycles. During those five cycles, voltage at the plant's 138 kV point of interconnection (POI) falls to about 0.6 per unit (pu). The inverters do exactly what the interconnection requirements ask of them: they stay connected, cut back active current and push reactive current into the grid to hold the voltage up. Then the breakers open, the fault disappears and the grid voltage snaps back. For a fraction of a second, the plant is still injecting the reactive current it was injecting during the fault, and the plant controller is still acting on voltage readings that are a few hundred milliseconds old. On a strong grid, that leftover reactive current barely moves the voltage. On a weak grid, it can push the POI above 1.10 pu and the inverter terminals above 1.20 pu. A few inverters trip on AC overvoltage. The plant that successfully rode through a low-voltage event has now failed a high-voltage one.
That sequence, in which a low-voltage ride-through (LVRT) event turns into a high-voltage ride-through (HVRT) problem after fault clearing, has appeared in North American disturbance reviews for almost a decade. It is one of the clearest examples of a basic weak-grid truth: when the network impedance is high, voltage, reactive power, active power and angle stop behaving as separate quantities. A control action meant to fix one of them changes the others. A plant can be compliant with every individual setting and still fail as a system.
This guide is Keentel Engineering's in-depth treatment of that problem for US inverter-based resources (IBRs): solar photovoltaic plants, wind plants, battery energy storage systems (BESS) and hybrids connected at 69 kV to 500 kV. It explains the physics, quantifies the mechanisms with worked examples, maps the problem onto US requirements (IEEE Std 2800-2022, NERC PRC-029-1, PRC-024-4, PRC-030-1, TPL-001-5.1 and MOD-026-2, and FERC Orders 827, 901 and 2023), and sets out practical engineering guidance for studies, settings, equipment and commissioning.
Who this guide is for
Developers and owners of solar, wind, storage and hybrid plants in low-strength areas, who need to understand why a plant can trip after a fault it rode through, and what it costs to prevent.
Interconnection and planning engineers at transmission providers, ISOs and RTOs, who screen grid strength, review electromagnetic transient (EMT) studies and set ride-through and post-fault recovery requirements.
Plant design engineers and EPC contractors, who select inverters, size capacitor banks, filters and transformers, choose collector grounding and coordinate protection.
Controls engineers and inverter and plant controller suppliers, who tune fault-ride-through logic, reactive current injection, integrator freezing and recovery ramps.
Compliance teams, who must document ride-through performance under PRC-029-1, analyze unexpected output changes under PRC-030-1 and verify models under MOD-026-2.
How to read this guide
Part A gives the problem in one picture, key terms, a quick-reference table of relationships, eight findings from Keentel's analysis and an engineering review of common claims. Part B is the full technical guide in twenty-three sections, each ending with a short note on how Keentel Engineering helps with that part of the problem. Part C presents three anonymous US case studies. Part D answers thirty technical questions. The guide closes with Keentel's services, references and a disclaimer.
All worked examples were calculated by Keentel Engineering with a documented Python script, and the time-domain figures come from a simplified quasi-static plant and grid model built for this guide. They use illustrative data. They show trends and orders of magnitude; they are not a substitute for project-specific EMT studies with the supplier's control code.
The problem in one picture

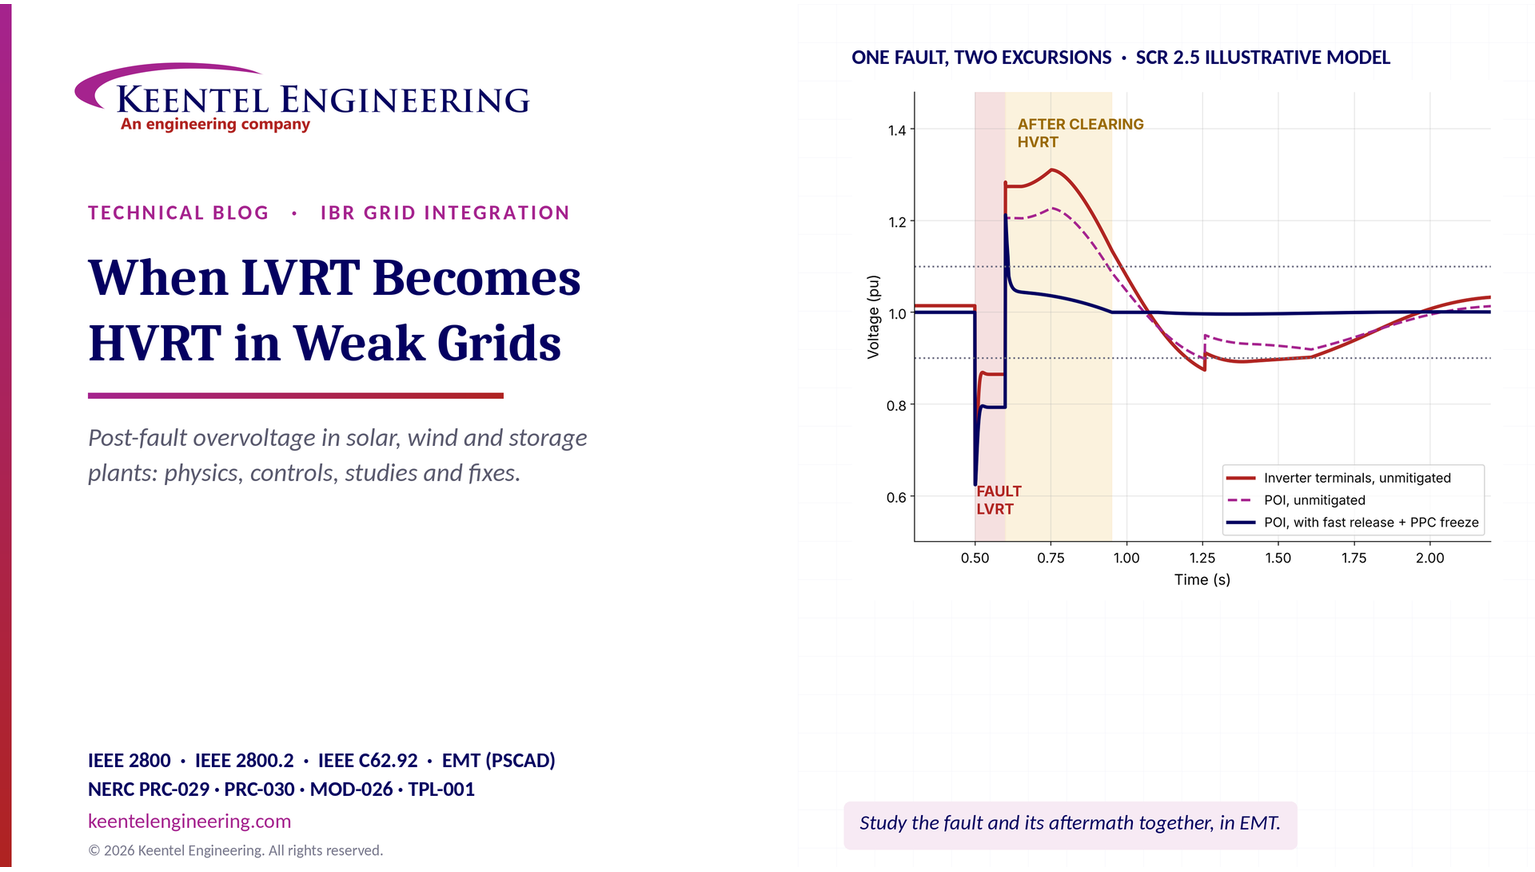
Four features of Figure 1 summarize the whole guide:
1. The fault itself is the easy part. POI voltage dips to about 0.62 pu and is partly supported by reactive current injection, rising to about 0.79 pu during the fault. Both plant designs ride through.
2. The danger starts at clearing. The grid source recovers in one step, but the plant's reactive current does not. Voltage rises by roughly the network reactance times the leftover reactive current.
3. Duration separates nuisance from failure. Both designs show a first-cycle spike of about 1.2 pu at the POI, which is governed by the transient overvoltage capability of the equipment. Only the unmitigated design keeps the POI above 1.10 pu for about 340 ms and the inverter terminals above 1.20 pu for about 300 ms, long enough to operate a typical inverter AC overvoltage element.
4. One violation leads to another. In the unmitigated case, the slow ramp-down and the wound-up controller swing reactive power negative, voltage then sags back to 0.90 pu, and the inverters re-enter their low-voltage mode and cut active current a second time. The plant oscillates between LVRT and HVRT behavior for more than a second.
Key terms used in this guide
| Term | Meaning in this guide |
|---|---|
| Ride-through | The requirement that a resource remain connected and keep operating (or operate in a defined mode) during voltage or frequency excursions inside a specified envelope |
| LVRT | Low-voltage ride-through: performance during voltage below the continuous operating range, typically below 0.90 pu |
| HVRT | High-voltage ride-through: performance during voltage above the continuous operating range, typically above 1.05 or 1.10 pu depending on the requirement |
| Ride-through failure | Tripping, momentary cessation or other behavior outside what the applicable requirement permits; an excursion alone is not a failure |
| POI / RPA | Point of interconnection; IEEE 2800 uses the reference point of applicability (RPA), normally the POI |
| PPC | Power plant controller: the plant-level supervisory controller that regulates POI voltage, reactive power, power factor and active power |
| GFL / GFM | Grid-following (phase-locked-loop synchronized, current-controlled) and grid-forming (voltage-source behavior) inverter control |
| SCR, ESCR, WSCR | Short-circuit ratio, effective SCR (subtracting shunt capacitance) and weighted SCR (multiple plants) |
| Iq, Ip | Reactive and active components of inverter current, in pu of rated current |
| K-factor | Gain of additional reactive current per unit of voltage deviation during a disturbance |
| Integrator windup | Growth of a controller's integral state while its output is saturated or while it acts on measurements that do not reflect its own action |
| Freeze / hold | Logic that stops integrating (freeze) or holds an output at a fixed value (hold) during and after a disturbance |
| TOV | Temporary overvoltage: an oscillatory overvoltage of relatively long duration, such as from ground faults or load rejection |
| COG | Coefficient of grounding: highest unfaulted phase-to-ground voltage during a ground fault, as a percentage of normal phase-to-phase voltage |
| Momentary cessation | Inverter behavior in which current output drops to near zero during a voltage excursion while the unit remains connected |
Quick reference: the relationships that matter
| Relationship | Expression | Why it matters |
|---|---|---|
| Short-circuit ratio | SCR = Ssc / Prated | First screen of grid strength at the POI |
| Effective SCR | ESCR = (Ssc − Qc) / Prated | Capacitor banks and filters weaken the grid seen by the plant |
| Network reactance on plant base | X ≈ 1 / SCR (pu) | Sets how much voltage each pu of reactive current produces |
| Voltage change from a power injection | ΔV ≈ (R·ΔP + X·ΔQ) / V | Shows P–V and Q–V coupling; R matters in weak and cable-rich networks |
| Voltage rise from leftover reactive current | ΔV ≈ X · Iq,residual | Core of the LVRT-to-HVRT mechanism |
| Reactive current during a dip | ΔIq = K · (V0 − V) | Fault reactive support, limited by current rating |
| Current limit | Ip² + Iq² ≤ Imax² | Reactive priority reduces active current |
| PPC integrator growth | ΔQ = Ki ∫ e dt | Windup if the integral runs during the fault |
| Voltage rise from shunt capacitance after a trip | ΔV ≈ Qc / Ssc | Capacitor banks and filters left in service after inverters trip |
| Ground-fault overvoltage | depends on X0/X1 and R0/X1 | Collector and transformer grounding decide TOV duty |
Eight findings from Keentel's analysis
1. An LVRT event can become an HVRT problem within one cycle of fault clearing. In Keentel's SCR 2.5 model, leftover reactive current after clearing raises the POI by more than 0.2 pu for about a cycle and, without mitigation, keeps it above 1.10 pu for about 340 ms.
2. The inverter terminals are the weakest point, not the POI. Reactive current flowing out through the collector system and transformers places the inverter terminals 0.05 to 0.10 pu above the POI. In the model, the terminals exceeded 1.20 pu for about 300 ms while the POI peaked near 1.23 pu only briefly.
3. The size of the rise is set by network reactance times reactive current. At SCR 2.5, every 0.1 pu of reactive current left flowing after clearing adds about 0.04 pu to POI voltage; at SCR 1.8 it adds about 0.056 pu. Holding 0.6 pu of reactive current at full active power would raise the POI to about 1.25 pu at SCR 2.5 and about 1.35 pu at SCR 1.8.
4. Plant controller windup is a real but secondary contributor for short faults, and a major one for long or slow events. A PPC integral gain of 5 pu Mvar per pu volt per second that integrates through a 0.1 s fault and 0.5 s of slow recovery accumulates an extra 0.45 pu reactive command, worth about 0.18 pu of voltage at SCR 2.5.
5. The fix is mainly in the controls, not in the hardware. Fast reactive current release after voltage recovery, integrator freezing and anti-windup in the PPC, and high-voltage reactive absorption reduced sustained overvoltage above 1.10 pu from about 340 ms to under 10 ms in the model, with no change to the network.
6. Shunt capacitance turns a trip into a second overvoltage. At a 34.5 kV collector bus with 400 MVA of short-circuit capacity, leaving 36 Mvar of capacitor banks and filters in service after the inverters trip raises the bus by about 9%; if the inverters had also been absorbing 30 Mvar to offset that capacitance, the step is about 16.5%.
7. Grounding decides unbalanced-fault overvoltage. Unfaulted phase voltages during a single-line-to-ground fault rise to about 1.25 pu of normal phase voltage when X0/X1 is 3, but approach 1.7 pu when the collector is effectively ungrounded. Surge arrester ratings and inverter overvoltage settings must be chosen with that in mind.
8. SCR alone does not predict the outcome. Peak and duration depend on inverter recovery logic, PPC structure, measurement delays, capacitor banks, grounding and neighboring plants. Only EMT studies with the supplier's actual control code, run across the credible range of system strengths, show whether a plant will pass.
Engineering review of common claims
The LVRT-to-HVRT problem is often explained in simplified form. The simplified explanations are broadly right, but several points need correction or expansion for US engineering practice.
| Common claim | Keentel's engineering review |
|---|---|
| "The plant experiences an LVRT event and then an HVRT violation." | An excursion is not a violation. Ride-through requirements define envelopes of voltage and duration in which the plant must remain connected and perform. A violation occurs only if the plant trips, ceases current or otherwise fails the applicable requirement (IEEE 2800 as adopted, PRC-029-1, the interconnection agreement). The engineering goal is to keep the post-fault excursion inside the envelope and the plant inside it. |
| "Voltage overshoots to about 1.1 pu after clearing." | Illustrations often show a gentle 1.1 pu overshoot at the POI. Real excursions can be higher and are always higher at the inverter terminals than at the POI. The first-cycle peak is governed by transient overvoltage capability, and phase voltages during unbalanced faults can exceed the positive-sequence value. |
| "Reactive current injection may not return to normal immediately." | Correct, and often by design: many inverters hold fault-mode reactive current for a fixed time after voltage recovers, or ramp it down slowly to avoid a voltage collapse. The hold time and ramp rate are settings that must be coordinated with grid strength. |
| "The PPC accumulates control error during the disturbance." | Correct where integrators are not frozen. The problem is made worse by communication and measurement delays: a PPC can keep acting on low voltage readings for 100 to 300 ms after the real voltage has recovered. Freeze logic must cover the delay, not just the fault. |
| "In strong grids, active power and voltage are independent." | They are approximately decoupled only when network X/R is high and SCR is high. The ΔV ≈ (RΔP + XΔQ)/V relationship shows active power affects voltage through resistance and, in weak grids, through the large angle across the network. Collector cables and 34.5 kV systems have lower X/R and couple P and V even inside strong plants. |
| "Reactive power is coupled to angle in weak grids." | Reactive power affects angle mainly indirectly, by changing voltage magnitude and therefore the power transfer equation. The useful statement is that in weak grids all four quantities, P, Q, V and δ, interact strongly, so controllers must be tuned together. |
| "Grid-following inverters are the problem; grid-forming fixes it." | Grid-forming controls generally improve weak-grid behavior, but they too have current limits, mode transitions and recovery logic that can produce overshoot. Overvoltage behavior must be studied for both. |
| "Plant controls and network recovery must be checked as one system." | Correct and essential. US practice adds model verification (MOD-026-2), ride-through documentation (PRC-029-1), event analysis (PRC-030-1) and planning studies (TPL-001-5.1), all of which depend on models that represent the recovery logic accurately. |
The illustrative systems used in this guide
| Item | Value |
|---|---|
| Plant | 200 MW (AC) solar PV or BESS, grid-following inverters with 1.1 pu current limit |
| POI | 138 kV (main example) or 230 kV, three-phase short-circuit capacity 500 MVA (SCR 2.5) system-intact and 380 MVA (SCR 1.9) under a credible N-1 outage |
| Main power transformer | 138/34.5 kV, 200 MVA, 10% impedance |
| Collector system | 34.5 kV underground cable, about 6 Mvar charging |
| Shunt devices | Up to 30 Mvar switched capacitor bank plus 6 Mvar harmonic filter at 34.5 kV |
| Plant impedance from POI to inverter terminals | About 0.17 pu on the plant's 200 MVA base |
| Inverter fault response | K-factor 2, reactive priority, active current limited during the dip |
| PPC | Integral voltage control, 150 ms measurement and communication delay, 100 ms filter |
| Fault | Six-cycle (100 ms) three-phase-equivalent dip to about 0.6 pu at the POI |
Part B — When LVRT Becomes HVRT: An Engineering Guide to Post-Fault Overvoltage in Inverter-Based Plants
1. Why this problem matters now
1.1 More inverters, weaker points of interconnection
US interconnection queues are dominated by inverter-based resources. Solar, wind, battery storage and hybrid projects make up the large majority of new capacity seeking interconnection in ERCOT, MISO, SPP, PJM, CAISO, NYISO and ISO-NE, and in the vertically integrated utilities of the Southeast and West. Many of these plants are sited where land, sunshine or wind are good and the grid is thin: West Texas, the Texas Panhandle, the Great Plains, the desert Southwest, the Central Valley and rural parts of the Midwest. They connect at the end of long 115 kV, 138 kV, 230 kV or 345 kV lines, often several plants to the same substation, and often far from large synchronous generators.
At the same time, synchronous generation that used to provide system strength is retiring or running less. Short-circuit capacity at many buses is flat or falling, while the inverter capacity connected to those buses is rising. The ratio between the two, which the industry measures as the short-circuit ratio, is moving the wrong way.
1.2 What disturbance reviews have shown
Since 2016, NERC and the Regional Entities have published a series of disturbance reports on events in which large amounts of inverter-based generation reduced output during ordinary transmission faults that were cleared normally. Each event had its own mix of causes, but several themes recur across the reports:
Momentary cessation: inverters stopping current output during low voltage and recovering slowly afterward.
Phase-locked loop (PLL) and frequency measurement problems: inverters tripping on calculated frequency or phase-jump detection during faults.
AC overvoltage tripping on fault clearing: inverters tripping on instantaneous or sub-cycle AC overvoltage protection just as the fault was cleared and voltage recovered.
DC-side issues: DC bus overvoltage or imbalance in the inverter during the AC transient.
Plant controller and recovery issues: slow active power recovery, controller interactions and output oscillations after the event.
Collector and feeder protection: plant-side protection operating on transient currents or voltages.
The early California events, beginning with the Blue Cut Fire disturbance in August 2016 (on the order of 1,200 MW of solar output reduction), centered on frequency measurement and momentary cessation. Later events, including the Canyon 2 Fire disturbance in October 2017 and the two Odessa, Texas disturbances in 2021 and 2022 (each with roughly 1,100 to 1,700 MW of solar output reduction), identified AC overvoltage tripping, among several other causes, as a significant contributor. In other words, plants that rode through the low-voltage part of an event still lost output on the high-voltage part.
The magnitudes matter. A single cleared fault on the bulk system should not remove more than a gigawatt of generation. When it does, the event approaches the size of the largest single contingencies that systems are planned for, and it does so through behavior that was neither planned nor modeled.
1.3 The regulatory response
The response has been a new layer of US requirements:
IEEE Std 2800-2022 set uniform technical minimum requirements for transmission-connected IBRs, including voltage and frequency ride-through, reactive current during faults, post-fault recovery and transient overvoltage ride-through. Transmission providers and ISOs are adopting it, in whole or in part, in their interconnection requirements.
FERC Order No. 901 (October 2023) directed NERC to develop reliability standards for IBR performance, data sharing, model validation and planning and operational studies.
NERC PRC-029-1 sets voltage and frequency ride-through requirements for IBRs. FERC approved it in July 2025, and it became enforceable on October 1, 2026, with provisions for documented legacy equipment limitations.
NERC PRC-024-4 now covers frequency and voltage protection settings for synchronous generators and Type 1 and Type 2 wind resources, while IBRs move to PRC-029-1.
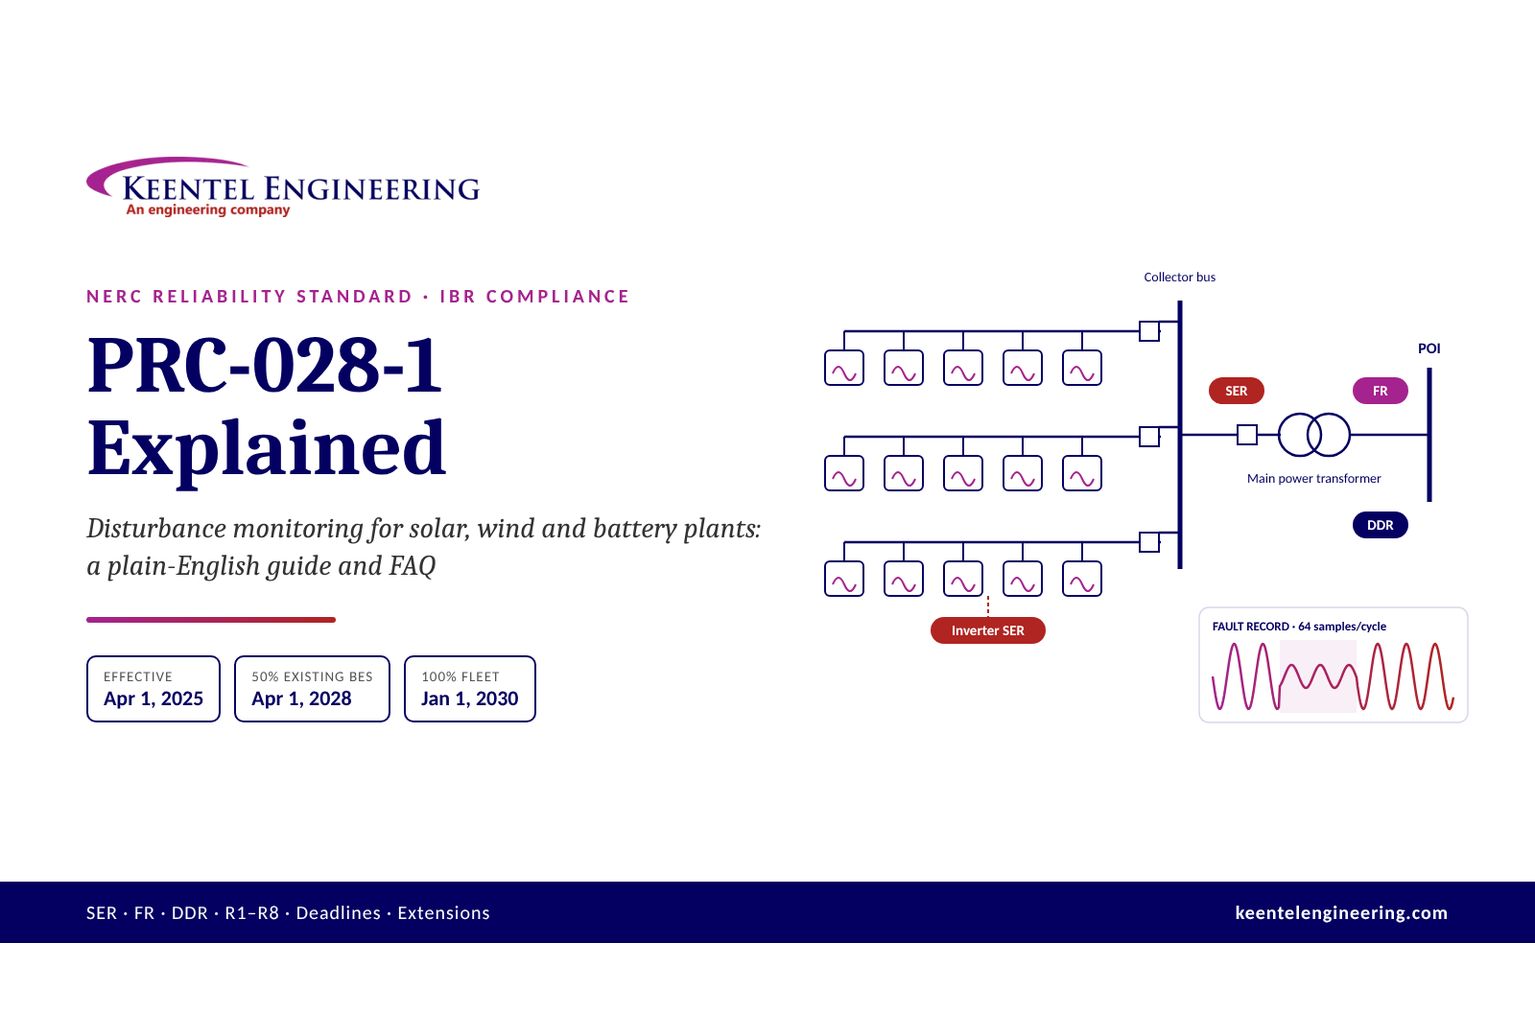
NERC PRC-028-1 requires disturbance monitoring at IBRs, phased in through 2030.
NERC PRC-030-1 requires Generator Owners to identify, analyze and correct unexpected changes in IBR output, effective October 1, 2026.
NERC MOD-026-2 consolidates and updates model verification for generator control systems, including IBR plant controllers.
FERC Order No. 2023 reformed interconnection procedures, with model requirements that make early, accurate plant models a schedule issue as well as an engineering one.
All of these converge on one practical question for a plant in a weak area: when a nearby fault is cleared, will the plant stay inside both the low-voltage and the high-voltage ride-through envelopes, and can the owner prove it?
How Keentel Engineering helps here: Keentel screens new and existing IBR projects for weak-grid and post-fault overvoltage risk at the earliest stage of development, using short-circuit data, queue information and nearby plant data to calculate SCR, ESCR and WSCR for system-intact and outage conditions. We tell owners and developers, before they commit to equipment, whether post-fault overvoltage is likely to drive inverter selection, control requirements, shunt device sizing or system strength additions.
2. Ride-through fundamentals and the US requirements map
2.1 What ride-through means
Ride-through is the requirement that a resource remain connected and keep operating, in a defined way, while voltage or frequency at its reference point moves outside the normal range for a limited time. A ride-through requirement has three parts:
An envelope, defining combinations of magnitude and duration inside which the resource must not trip.
A performance mode inside each region of the envelope: continuous operation, mandatory operation (stay connected and keep delivering current, possibly with reduced active power), permissive operation (may cease current but must not trip) or may-trip.
Post-disturbance performance: how quickly active power and reactive current must return to normal after voltage recovers.
The low-voltage and high-voltage envelopes are usually drawn as separate boundaries on a voltage-versus-time plot. Figure 2 shows an illustrative pair.

2.2 Why one event touches both boundaries
A single fault produces at least two excursions: the dip while the fault is on and, after clearing, a recovery that may overshoot. Most ride-through analysis focuses on the first, because it is deeper and more obvious. The second is shorter and smaller at the POI, but it can be larger at the inverter terminals, and it occurs while the plant's controls are in transition between fault mode and normal mode. The engineering question is not whether each excursion is inside its envelope in isolation, but whether the plant's response to the first excursion pushes it outside the envelope for the second.
Ride-through requirements also deal with multiple excursions. IEEE 2800 and PRC-029-1 both address consecutive voltage deviations within a defined window, because faults with reclosing, evolving faults and post-fault oscillations can create several excursions in quick succession. An LVRT-to-HVRT-to-LVRT oscillation, like the one in Figure 1, is exactly the kind of sequence these provisions anticipate.
2.3 The requirements that apply
| Requirement | Scope | Relevance to post-fault overvoltage |
|---|---|---|
| IEEE Std 2800-2022 | Transmission and sub-transmission connected IBRs, where adopted by the transmission provider | Low- and high-voltage ride-through tables, reactive current injection during faults, post-fault active power recovery, transient overvoltage ride-through, consecutive excursions, measurement at the RPA |
| IEEE Std 2800.2 | Test and verification procedures for IEEE 2800 conformity | Defines how design evaluation, as-built evaluation, commissioning tests and monitoring demonstrate ride-through |
| NERC PRC-029-1 | Generator Owners of BES IBRs and applicable non-BES IBRs | Mandatory voltage and frequency ride-through criteria, documentation of legacy equipment limitations |
| NERC PRC-024-4 | Synchronous generators and Type 1 and 2 wind | Protection settings within no-trip zones; relevant where synchronous condensers or hybrid synchronous equipment share a POI |
| NERC PRC-028-1 | IBRs | Fault and dynamic disturbance recording needed to prove what happened |
| NERC PRC-030-1 | Generator Owners of IBRs | Analysis and correction of unexpected output changes, including trips on post-fault overvoltage |
| NERC TPL-001-5.1 | Planning Coordinators and Transmission Planners | Planning studies must represent IBR behavior, including tripping that the models predict |
| NERC MOD-026-2 | Generator Owners | Verified models of plant control systems, including fault and recovery behavior represented in the models |
| NERC FAC-001 and FAC-002 | Transmission Owners and planners | Facility interconnection requirements and studies, where ride-through and performance criteria are set |
| FERC Order No. 827 | Non-synchronous generation | Reactive capability (0.95 power factor at the high side of the generator substation), which drives inverter and shunt sizing |
| Interconnection agreement and transmission provider requirements | Specific plant | The binding set of numbers: envelope tables, reactive current gains, recovery times and test requirements |
2.4 Typical high-voltage envelope values
The exact high-voltage ride-through values differ between IEEE 2800, PRC-029-1 and transmission provider requirements, and they are expressed at different reference points. Commonly cited values in IEEE 2800-2022 for transmission-connected IBRs require continuous operation up to 1.05 pu, ride-through for extended periods (on the order of 30 minutes) between 1.05 and 1.10 pu, and mandatory ride-through for about 1 s between 1.10 and 1.20 pu, with tripping permitted above 1.20 pu on the RMS table. IEEE 2800 additionally specifies a transient overvoltage ride-through characteristic for sub-cycle and few-cycle instantaneous excursions above the RMS table values. PRC-029-1 contains its own voltage ride-through tables in its attachments. Keentel's practice is never to rely on summary values like these for design: we read the applicable table, at the applicable reference point, for each project.
| Region (illustrative) | Typical requirement | Engineering implication |
|---|---|---|
| Up to 1.05 pu | Continuous operation | Normal voltage schedules and LTC bands must keep inverter terminals inside their continuous rating as well |
| 1.05 to 1.10 pu | Ride-through for extended durations | Long post-fault overvoltage from capacitor banks or controller windup must not trip the plant |
| 1.10 to 1.20 pu | Mandatory ride-through for about 1 s | Post-fault overshoot of a few hundred milliseconds must be survived, at the RPA |
| Above 1.20 pu | May trip on the RMS table; transient overvoltage capability applies for short durations | First-cycle spikes are governed by transient overvoltage characteristics and equipment insulation, not by RMS protection |
Worked example 1 — checking post-fault excursions against an envelope
Using the illustrative boundaries in Figure 2 (mandatory ride-through of 1.0 s between 1.10 and 1.20 pu, may-trip above 1.20 pu on the RMS table), Keentel checked four post-fault excursions at the POI:
| Excursion at POI | Duration | Assessment |
|---|---|---|
| 1.17 pu | 60 ms | Inside the 1.10–1.20 pu band; well within 1.0 s; plant must ride through |
| 1.15 pu | 0.8 s | Inside the band; within 1.0 s; plant must ride through, but with little margin |
| 1.12 pu | 2.5 s | Exceeds the 1.0 s duration of the 1.10–1.20 pu band; the plant may trip under this illustrative table, and the event points to a controller or shunt device problem |
| 1.22 pu | 30 ms | Above the RMS table's upper band; the transient overvoltage clause and equipment capability govern; check carefully |
Three lessons follow. First, the duration of the excursion matters as much as its peak; a slow controller that holds voltage at 1.12 pu is more dangerous to compliance than a one-cycle spike to 1.17 pu. Second, the excursion must be checked at the reference point the requirement uses, and separately against the equipment ratings at the inverter terminals. Third, an excursion that is inside the envelope is a pass only if the plant actually stays connected, which depends on its protection settings, not on the requirement.
How Keentel Engineering helps here: Keentel maps every applicable ride-through requirement for a project, including IEEE 2800 as adopted by the transmission provider, PRC-029-1, the interconnection agreement and any regional requirements, onto one set of envelopes at the correct reference points. We then check inverter, PPC and plant protection settings against those envelopes and identify every setting that could trip the plant inside a region where ride-through is mandatory.
3. Grid strength and voltage sensitivity
3.1 Short-circuit ratio and its variants
The short-circuit ratio is the three-phase short-circuit capacity at the POI, excluding the plant's own contribution, divided by the plant's rated power:

Shunt capacitors, harmonic filters and cable charging at or near the POI reduce the effective strength of the grid seen by the plant. The effective short-circuit ratio subtracts them:

Where several IBR plants connect in the same electrical area, each plant's single-plant SCR overstates strength. The weighted short-circuit ratio, used in ERCOT and other screening methods, combines them:

Keentel's companion guide on weak-grid inverter stability covers these metrics in detail. For post-fault overvoltage, the key point is simpler: the network reactance seen by the plant, on the plant's own MVA base, is approximately the inverse of the SCR.

Worked example 2 — SCR and ESCR for a 200 MW plant
| Case | Short-circuit capacity at POI | Shunt capacitance near POI | SCR | ESCR | Grid reactance on plant base |
|---|---|---|---|---|---|
| 230 kV POI, system intact | 1,200 MVA | 40 Mvar | 6.0 | 5.8 | 0.17 pu |
| 138 kV POI, system intact | 500 MVA | 40 Mvar | 2.5 | 2.3 | 0.40 pu |
| 138 kV POI, credible N-1 outage | 380 MVA | 40 Mvar | 1.9 | 1.7 | 0.53 pu |
The same 200 MW plant sees a grid reactance of about 0.17 pu at a strong 230 kV bus and about 0.53 pu at a 138 kV bus with one line out. As the following sections show, that reactance multiplies every reactive current the plant leaves flowing after fault clearing. The 138 kV plant is about three times more exposed to post-fault overvoltage than the 230 kV plant before any control setting is considered.
3.2 How SCR thresholds should be read
Screening thresholds are commonly quoted as SCR above about 3 for strong, 2 to 3 for weak and below about 2 for very weak connections. Those numbers are useful for triage but are not limits. The relevant threshold depends on the inverter design and settings, the X/R ratio, shunt capacitance, neighboring converters and, for post-fault overvoltage specifically, the recovery logic. A plant with fast reactive current release and good PPC freeze logic can be robust at SCR 1.5; a plant with a long post-fault hold time can trip at SCR 4. Treat SCR as the first question, not the answer.
3.3 Voltage sensitivity to power injection
For a plant connected through a Thevenin impedance R + jX to a grid source E, the voltage at the POI changes with the plant's active and reactive output approximately as:

The reactive term dominates in high-X/R transmission networks, which is why voltage control in transmission systems is primarily a reactive power problem. But the active power term is not zero. At the 138 kV POI in Worked example 2, with X/R = 10:
Worked example 3 — active and reactive sensitivity at SCR 2.5
On the plant's base, X = 0.40 pu and R = 0.04 pu.
Change at the POI
Approximate voltage change
Active power +1.0 pu (full output), Q = 0
+0.04 pu from the resistive term alone
Reactive power +0.30 pu, P unchanged
+0.12 pu
Active power −1.0 pu (plant trips at full output)
−0.04 pu from the resistive term, plus the angle effect described in Section 4
A reactive change of 0.3 pu, which is less than a third of an inverter's current rating, moves POI voltage by 12% at this connection. In a strong system at SCR 10 the same change moves voltage by about 3%. That ratio is the whole story of weak-grid voltage control in one number.
3.4 The X/R ratio and why collector systems behave differently
The sensitivity formula above explains why the coupling between active power and voltage is stronger inside the plant than outside it. Transmission lines at 138 kV to 500 kV typically have X/R ratios of 5 to 15 or more. A 34.5 kV underground collector cable may have an X/R close to 1 or below, and the inverter step-up transformers add moderate X/R. Inside the plant, active current flow therefore produces a significant resistive voltage rise toward the inverters, and the voltage profile along a long collector feeder depends on both P and Q. Section 9 shows the effect on inverter terminal voltage.
How Keentel Engineering helps here: Keentel calculates grid strength and voltage sensitivity at the POI and inside the plant for every credible system condition, using utility short-circuit data, our own short-circuit models and the plant's collector design. We present the results as reactance-on-plant-base and voltage-per-Mvar tables that controls engineers can use directly when setting reactive current gains, hold times and PPC gains.
4. Coupling between P, Q, V and δ in weak grids
4.1 The power transfer equations
For a plant at voltage V and angle δ connected through a reactance X to a grid source E at angle zero, and neglecting resistance:

Here Q is the reactive power flowing from the plant into the grid. Linearizing around an operating point gives four sensitivities:

In a strong grid, X is small and the operating angle δ is small. The cross terms, which contain sin δ, are small compared with the direct terms, which contain cos δ. That is the mathematical basis for the classic engineering approximation that P is controlled by angle and Q by voltage: the so-called P–δ and Q–V decoupling.
4.2 Why the decoupling breaks down
In a weak grid, X is large, so for the plant to export its rated power the angle across the network must also be large:

For a 200 MW plant at SCR 2.5 (X ≈ 0.4 pu on plant base) exporting rated power with E and V near 1.0 pu, δ is about 24°. At SCR 1.5 (X ≈ 0.67 pu), δ is about 42°. With sin δ now 0.4 to 0.67, the ratio of cross-sensitivity to direct sensitivity (tan δ) is about 0.44 to 0.89. A change in active power changes voltage substantially, and a change in reactive power changes the angle. The four quantities are tightly linked.
| SCR | Network reactance on plant base | Angle at rated output | Cross-coupling ratio sin δ / cos δ |
|---|---|---|---|
| 10 | 0.10 pu | ≈ 6° | ≈ 0.10 |
| 5 | 0.20 pu | ≈ 12° | ≈ 0.20 |
| 2.5 | 0.40 pu | ≈ 24° | ≈ 0.44 |
| 1.5 | 0.67 pu | ≈ 42° | ≈ 0.89 |
At SCR 1.5, the cross-coupling is nearly as strong as the direct coupling. A controller designed on the assumption that it only moves voltage will move angle almost as much, and vice versa.
4.3 What the coupling means during and after a fault
The coupling has three practical consequences for the LVRT-to-HVRT problem:
1. Active power recovery depresses voltage, and reactive current holds it up. After clearing, as inverters ramp active current back toward pre-fault output, the angle across the network grows and POI voltage tends to fall. Inverters that hold reactive current during the active power ramp are partly compensating that fall. If they release reactive current faster than active power recovers, voltage can sag; if they hold it longer, voltage overshoots. The right release rate depends on grid strength.
2. The PLL sees angle changes as frequency. A large reactive current step after clearing changes the voltage angle at the inverter terminals, which the PLL interprets as a transient frequency deviation. In weak grids this can disturb current control, reinforcing the overshoot or causing oscillation.
3. Plant controller gains that are well damped in strong grids can oscillate in weak ones. A PPC that regulates POI voltage with reactive power sees a loop gain that scales with network reactance. In Keentel's companion guide on power plant controllers, a voltage loop tuned with 76° of phase margin at SCR 10 falls to about 18° at SCR 2.
This is why a plant's response to a fault cannot be designed one function at a time. Reactive current injection, active power recovery, PLL bandwidth and PPC tuning all act on the same few quantities through the same network impedance, and they must be tuned together, for the weakest credible grid.
How Keentel Engineering helps here: Keentel analyzes the coupling between active power recovery, reactive current release and PPC voltage control for each project across the full credible SCR range. We identify the release rates, ramp rates and gains that keep voltage inside both ride-through envelopes, and we work with inverter and controller suppliers to implement them as approved settings rather than as one-off field adjustments.
5. Anatomy of an event: from undervoltage to overvoltage
5.1 Five phases
Every LVRT-to-HVRT event follows the same basic sequence. Breaking it into phases helps engineers decide which equipment and which control function governs each part, and which data will be needed to analyze it.
| Phase | Typical duration | What the grid does | What the inverters do | What the PPC does |
|---|---|---|---|---|
| 1. Pre-fault | Steady state | Normal voltage, often near the upper end of the schedule at light load | Deliver P and Q per PPC setpoints | Regulates POI voltage or reactive power |
| 2. Fault inception | First cycle | Voltage drops abruptly; phase angle may jump | Detect low voltage, PLL tracks the angle jump, enter fault ride-through mode | Measures a falling voltage with delay; integrator begins to wind up unless frozen |
| 3. Fault on | 3 to 10 cycles for normally cleared transmission faults; longer for delayed clearing | Depressed voltage, set by fault location, impedance and the plant's own injection | Inject reactive current (K-factor), limit active current, or enter momentary cessation on legacy units | Measured error large; freeze logic should engage |
| 4. Clearing and immediate recovery | First 1 to 2 cycles after breaker opening | Grid source voltage restored in one step; voltage angle may jump again | Still injecting fault-mode reactive current until the control detects recovery | Still sees low voltage through its measurement filter and communication delay |
| 5. Post-fault recovery | About 0.1 s to several seconds | Voltage settles; can overshoot, oscillate or sag | Exit fault mode, release reactive current, ramp active power back | Resumes control, possibly with a wound-up integrator |
The LVRT-to-HVRT transition happens in phases 4 and 5. The first-cycle peak in phase 4 is set mainly by how much reactive current is flowing when the fault clears and how quickly the inverter current control reacts. The sustained excursion in phase 5 is set by the inverter's release logic, the PPC's state and the shunt devices left in service.
5.2 Why the transition is fast
The grid source recovers in one step because fault clearing is a switching event: the fault current path is interrupted at a current zero, and the network voltage behind the system impedance reappears within a cycle. The plant's injection cannot follow that fast. An inverter's current controller can change current within a few milliseconds, but it first has to know that voltage has recovered. That requires measurement, filtering and a decision: has voltage really recovered, or is this a transient? Many inverters use RMS or sequence-component voltage measurement with filtering of half a cycle to two cycles, and then a deliberate hold or ramp. Each of those adds time during which fault-mode reactive current flows into a recovered network.
5.3 Where the voltage rises first
Reactive current flows from the inverters through their step-up transformers, the collector feeders and the main power transformer to the POI and on into the grid. Each impedance along that path adds voltage rise. The highest voltage is therefore at the inverter terminals, and the highest inverter terminal voltages are at the electrical ends of the longest collector feeders. That is why, in disturbance reviews, AC overvoltage trips often affect a subset of inverters rather than the whole plant, and why that subset tends to sit on the longest feeders.
5.4 What makes it worse
| Contributing factor | Mechanism |
|---|---|
| Low SCR or ESCR | Larger network reactance multiplies residual reactive current |
| Long post-fault reactive current hold | Fault-mode current flows into a recovered network |
| Slow reactive current ramp-down | Same, for longer |
| Large K-factor | Larger reactive current at the instant of clearing |
| PPC integrator windup | Additional reactive command released after the fault |
| PPC communication and measurement delay | Controller acts on stale low voltage after recovery |
| Shunt capacitor banks and harmonic filters in service | Fixed capacitive support adds to inverter injection; worse if inverters trip |
| High pre-fault voltage | Less margin to the high-voltage boundary before the event starts |
| Light load in the area | Higher voltages, less voltage-dependent load to absorb reactive power |
| Long, lightly loaded transmission lines | Line charging raises voltage when power flow drops |
| Unbalanced faults and poor grounding | Unfaulted phases rise during the fault and may stay high in the first cycles after clearing |
| Neighboring plants with similar settings | Several plants release their residual current into the same weak network |
How Keentel Engineering helps here: Keentel reconstructs event timelines phase by phase from relay records, digital fault recorder data, PPC logs and inverter event logs, aligned to a common time base. That reconstruction usually identifies, within days, which phase and which function drove the overvoltage, and which of the contributing factors above were present.
6. Inverter fault response: reactive current, current limits and momentary cessation
6.1 Reactive current injection during a dip
Most modern grid-following inverters, and grid codes in North America and elsewhere, provide additional reactive current in proportion to the voltage dip:

where V0 is the pre-disturbance voltage (or a reference such as 1.0 pu), V is the measured voltage and K is the gain, commonly called the K-factor. Typical values are about 2, with many codes and products allowing adjustment over a range of roughly 0 to 6 or more. IEEE 2800 requires transmission-connected IBRs to provide reactive current during faults in both positive and negative sequence, with response time and magnitude parameters specified in the standard and selectable within ranges by the transmission provider. Designers should take the gain and response values from the project's interconnection requirements, not from a vendor default.
6.2 Current limits and priority
Inverters have a hard limit on total current, typically 1.0 to 1.2 pu of rated current, set by semiconductor ratings:

During a dip, most transmission requirements specify reactive current priority: reactive current is supplied first, and active current is reduced to stay within the limit.

Worked example 4 — current during a dip to 0.6 pu and 0.45 pu
An inverter has K = 2, Imax = 1.1 pu and reactive priority. Voltage falls from 1.0 pu to 0.6 pu.
| Quantity | Dip to 0.60 pu | Dip to 0.45 pu |
|---|---|---|
| Reactive current demand K(1 − V) | 0.80 pu | 1.10 pu |
| Reactive current delivered | 0.80 pu | 1.10 pu (at the limit) |
| Active current available √(1.1² − Iq²) | 0.755 pu | 0 pu |
| Active power P = V·Ip | 0.45 pu | 0 |
| Reactive power Q = V·Iq | 0.48 pu | 0.50 pu |
Two observations matter for the post-fault overshoot. First, at the moment of clearing the inverter may be carrying 0.8 to 1.1 pu of reactive current. Second, its active current has been cut, so as it recovers it must ramp active current up while ramping reactive current down. The order and rates of those two ramps decide whether voltage overshoots, sags or recovers cleanly.
6.3 Momentary cessation
Older inverters, and some newer ones in specific modes, enter momentary cessation below a voltage threshold: they stop injecting current but remain connected, and resume when voltage recovers. Momentary cessation avoids some overvoltage risk because the inverter is not injecting reactive current at the instant of clearing, but it creates other problems: no voltage support during the fault, a sudden loss of output, and a recovery ramp that can be slow. IEEE 2800 and PRC-029-1 restrict the use of momentary cessation within the mandatory operation regions, with defined exceptions. For legacy plants with documented equipment limitations, the interaction between momentary cessation and the plant's shunt capacitance needs particular attention, because the capacitors keep supplying reactive power while the inverters are silent.
6.4 Negative-sequence current during unbalanced faults
Most transmission faults are unbalanced. During a single-line-to-ground or line-to-line fault, the positive-sequence voltage dips less than the faulted phase voltage, and a negative-sequence voltage appears. Inverters that inject only balanced (positive-sequence) reactive current can raise the voltage of the unfaulted phases, sometimes above 1.1 pu, while the faulted phase is still depressed. IEEE 2800 requires negative-sequence current injection during unbalanced faults, which helps reduce the unfaulted phase overvoltage and supports protection. Keentel's companion guide on IBR negative-sequence response explains the mechanism and its protection consequences in detail. For this guide, the point is that a plant can see phase overvoltage during the fault, not only after it, and the inverter's overvoltage protection must be designed to tolerate it.
How Keentel Engineering helps here: Keentel reviews inverter fault ride-through settings, including K-factor, current limit and priority, momentary cessation thresholds and negative-sequence injection, against the project's interconnection requirements and the plant's grid strength. We quantify the reactive current that will be flowing at the instant of clearing for the full range of credible faults, which is the starting point for every post-fault overvoltage assessment.
7. Post-fault reactive current release: the core mechanism
7.1 The physics in one equation
Once the fault clears, the grid behaves again like a voltage source E behind an impedance Z. Any reactive current the plant is still injecting produces a voltage rise across that impedance:

That is the core of the LVRT-to-HVRT mechanism. Nothing exotic is involved: it is Ohm's law across the network reactance, with the reactive current that was helpful a moment ago now acting on a grid that no longer needs it.
Worked example 5 — POI voltage if reactive current is held after clearing
Keentel solved the network equations for the 200 MW plant, with the grid source set so that POI voltage is 1.0 pu at full output and unity power factor before the fault. The table shows the POI voltage that would result if the plant held a given combination of active and reactive current after clearing.
| Active current Ip | Reactive current Iq held | SCR 5 | SCR 2.5 | SCR 1.8 |
|---|---|---|---|---|
| 1.0 pu | 0 | 1.000 pu | 1.000 pu | 1.000 pu |
| 1.0 pu | 0.3 pu | 1.061 pu | 1.125 pu | 1.176 pu |
| 1.0 pu | 0.6 pu | 1.122 pu | 1.250 pu | 1.352 pu |
| 0.6 pu | 0.6 pu | 1.126 pu | 1.281 pu | 1.421 pu |
| 0.3 pu | 1.0 pu | 1.205 pu | 1.449 pu | 1.662 pu |
The approximation ΔV ≈ X·Iq agrees with the full solution to within a few percent for moderate currents and underestimates the rise slightly at low active current, because the angle across the network is smaller and more of the reactive drop appears in magnitude.
Three conclusions follow:
At SCR 5, holding 0.3 pu of reactive current after clearing is tolerable (about 1.06 pu). At SCR 1.8 the same setting puts the POI at about 1.18 pu, inside the band where only short durations are permitted.
Holding full fault current is never tolerable in a weak grid. If the inverters were at their reactive limit with little active current at clearing, and stayed there, the POI would reach 1.45 pu at SCR 2.5. In practice the inverters would trip, or their high-voltage logic would react, long before steady state. The table shows the driving force, not the final result.
Active power recovery helps. For a given reactive current, faster recovery of active current lowers the post-fault voltage slightly, because the angle across the network increases. Slow active power recovery and slow reactive release together are the worst combination.
7.2 Hold time and ramp-down
Inverter suppliers offer several ways to leave fault mode:
| Release strategy | Description | Overvoltage risk in weak grids |
|---|---|---|
| Immediate release | Reactive current returns to the pre-fault or PPC-commanded value as soon as voltage recovers above the threshold | Lowest overvoltage risk; can cause voltage sag if active power also recovers instantly in a very weak grid |
| Fixed hold time | Fault-mode reactive current is held for a set time (often tens to hundreds of milliseconds) after recovery | High if the hold time is long and SCR is low |
| Ramp-down | Reactive current ramps from the fault value to the normal value at a set rate | Moderate to high, depending on rate |
| Voltage-dependent release | Reactive current follows the measured voltage continuously, with a deadband, so it reverses sign above an upper threshold | Low, if the high-voltage response is enabled and fast |
| Coordinated release with active power ramp | Reactive current is released at a rate tied to active current recovery | Low to moderate; best for very weak grids where both sag and overshoot are risks |
The hold time exists for a reason: in very weak grids, releasing reactive current instantly while active power is also recovering can collapse voltage back into the low-voltage region and cause repeated fault-mode entries. The design problem is therefore two-sided. The release must be fast enough to avoid overvoltage and slow enough, or coordinated enough, to avoid a voltage sag. The right setting depends on SCR.
7.3 High-voltage reactive response
A complementary function is a symmetrical high-voltage response: when voltage rises above an upper threshold, the inverter absorbs reactive current in proportion to the overvoltage, using the same K-factor logic in the other direction:

IEEE 2800 includes provisions for reactive current response to high voltage as well as low voltage. Enabling a fast high-voltage response is one of the most effective mitigations for post-fault overshoot, because it attacks the cause directly: as soon as voltage overshoots, the plant pulls it back.
7.4 Simulated sensitivity to SCR
Keentel ran the simplified plant model behind Figure 1 at SCRs from 1.5 to 10, with and without mitigation. The unmitigated design uses a 150 ms reactive current hold, a 0.4 s ramp-down time constant and an unfrozen PPC integrator. The mitigated design releases reactive current within about one cycle of recovery, enables high-voltage reactive absorption above 1.10 pu, and freezes the PPC integrator during the fault and for 0.5 s after recovery, with an anti-windup clamp.

| SCR | Peak POI voltage, unmitigated | Time POI > 1.10 pu, unmitigated | Time inverter terminals > 1.20 pu, unmitigated | Peak POI voltage, mitigated | Time POI > 1.10 pu, mitigated | Time terminals > 1.20 pu, mitigated |
|---|---|---|---|---|---|---|
| 1.5 | 1.34 pu | 301 ms | 272 ms | 1.32 pu | 78 ms | 6 ms |
| 2.0 | 1.27 pu | 324 ms | 290 ms | 1.24 pu | 9 ms | 5 ms |
| 2.5 | 1.23 pu | 338 ms | 299 ms | 1.21 pu | 9 ms | 4 ms |
| 3.0 | 1.20 pu | 345 ms | 306 ms | 1.18 pu | 7 ms | 3 ms |
| 4.0 | 1.15 pu | 336 ms | 301 ms | 1.14 pu | 4 ms | 2 ms |
| 5.0 | 1.13 pu | 310 ms | 275 ms | 1.12 pu | 2 ms | 1 ms |
| 7.0 | 1.09 pu | 0 ms | 103 ms | 1.09 pu | 0 ms | 0 ms |
| 10.0 | 1.07 pu | 0 ms | 0 ms | 1.06 pu | 0 ms | 0 ms |
The results show a pattern that Keentel sees repeatedly in detailed EMT studies:
The first-cycle peak barely changes with mitigation. It is set by the reactive current flowing at the instant of clearing and the speed of the current loop, and it falls only slowly as SCR rises. That peak must be handled by the equipment's transient overvoltage capability and by protection that does not trip on sub-cycle peaks inside the transient envelope.
The sustained excursion is almost entirely a control problem. Mitigation reduced the time above 1.10 pu at the POI from about a third of a second to a few milliseconds for SCR 2 and above, and the time above 1.20 pu at the inverter terminals by a factor of 50 or more.
Very weak grids remain difficult. At SCR 1.5, even the mitigated design keeps the POI above 1.10 pu for 78 ms. Below SCR of about 2, control changes alone may not be enough, and system strength, grid-forming capability or operating limits enter the discussion.
Strong grids do not make the problem disappear at the inverter terminals. At SCR 7, the POI never exceeded 1.10 pu, but the unmitigated terminals still spent about 100 ms above 1.20 pu, because of the plant's internal impedance (Section 9).
How Keentel Engineering helps here: Keentel runs EMT studies with the supplier's actual inverter and plant controller code to quantify post-fault overshoot across the credible SCR range, fault types and clearing times. We then work with the supplier to select hold times, ramp rates and high-voltage response settings that pass both the low-voltage and high-voltage envelopes at every studied condition, and we document the basis so the transmission provider can accept the settings without repeated study cycles.
8. The plant power controller: windup, freeze logic and anti-windup
8.1 How a PPC winds up
A PPC regulating POI voltage typically uses a proportional-integral (PI) controller, often with droop, whose output is a reactive power command distributed to the inverters and any STATCOM. Its integral state grows in proportion to the voltage error over time:

During a fault, the measured voltage error is large: 0.3 to 0.5 pu for a nearby fault. If the integrator keeps running, the reactive command grows rapidly. That command cannot be delivered during the fault, because the inverters are in fault mode and at their current limits, so the controller's output is saturated and its state keeps growing. When the fault clears and the inverters return to following the PPC, the wound-up command is released into a network that is already recovering.
The problem is made worse by delay. A PPC typically measures POI voltage through instrument transformers, a meter or relay, a filter and a communication link, and it sends commands back over another link. Total loop delay of 100 to 500 ms is common, and longer with polled communications. For that whole period after clearing, the PPC still believes the voltage is low and continues to integrate in the wrong direction.
Worked example 6 — PPC integrator growth during a fault
A PPC has integral gain Ki = 5 pu Mvar per pu volt per second, on the plant's reactive base. A fault depresses measured voltage error to 0.40 pu for 0.10 s. Because of measurement filtering and delay, the PPC then sees an average error of 0.10 pu for a further 0.50 s while voltage recovers.

| Grid condition | Voltage change from releasing 0.45 pu of extra reactive power |
|---|---|
| SCR 5 | about 0.09 pu |
| SCR 2.5 | about 0.18 pu |
The wound-up command alone could push a recovering POI from 1.0 to about 1.18 pu at SCR 2.5. Combined with residual inverter reactive current, it explains many sustained post-fault overvoltages lasting from a few hundred milliseconds to several seconds, until the integrator unwinds.
In Keentel's six-cycle fault simulation, PPC windup added only about 0.02 pu to the peak at SCR 2.5 with Ki = 8, and about 0.07 pu with Ki = 20, because the fault was short and the high post-fault voltage quickly drove the error negative. Longer faults, delayed clearing, slow voltage recovery from motor stalling or a series of faults with reclosing make windup much larger, as Worked example 6 shows.
8.2 Freeze and hold logic
The standard defense is to stop the integrator from integrating while the plant is in fault mode, and for a time after recovery. Common implementations are:
| Function | Description | Design notes |
|---|---|---|
| Voltage-based freeze | Integrator frozen while measured voltage is below a threshold (often 0.8 to 0.9 pu) or above an upper threshold | The generic US plant controller model includes a freeze threshold parameter for this purpose; the field setting must match the model |
| Fault-flag freeze | Integrator frozen while any inverter (or a defined share) reports fault ride-through mode | Requires fast communication of inverter status to the PPC |
| Post-recovery hold | Freeze extended for a fixed time after recovery, covering the measurement and communication delay | Hold time should exceed total loop delay; 0.3 to 1.0 s is typical |
| Output hold | PPC output held at the pre-fault value during and after the event | Simple; avoids windup but delays the controller's useful response |
| Integrator reset | Integrator reset to the pre-fault value at recovery | Removes windup completely; can produce a step in command |
8.3 Anti-windup
Freeze logic deals with the fault period. Anti-windup deals with any period in which the controller output is limited, including periods when the inverters are at their reactive limits during normal operation. The two common forms are:
Clamping (conditional integration): stop integrating when the output is at a limit and the error would push it further into the limit.
Back-calculation: feed the difference between the unlimited and limited output back into the integrator with a gain, so the integral state tracks the achievable output.

where xi is the integrator state, u the unlimited controller output, ulim the limited output and Kaw the back-calculation gain.
Worked example 7 — sizing the integrator clamp
The plant's reactive capability at the POI is ±0.33 pu of rating, the 0.95 power factor requirement under FERC Order No. 827. In Worked example 6, an unclamped integrator reached 0.45 pu, a command 36% above anything the plant could deliver.
| Design | Reactive command released after the fault | Voltage effect at SCR 2.5 |
|---|---|---|
| No freeze, no clamp | 0.45 pu | +0.18 pu |
| No freeze, clamp at plant capability | 0.33 pu | +0.13 pu |
| Freeze during fault and for 0.5 s after recovery, clamp at capability | about 0 pu | negligible |
The clamp limits damage; the freeze prevents it. A good PPC has both, plus a back-calculation term so that limiting during normal operation does not create a delayed overshoot when the limit is released.
8.4 Coordinating PPC logic with inverter fault-mode exit
The PPC and the inverters must agree on when the event is over. If the inverters exit fault mode at 0.90 pu and immediately begin following PPC commands while the PPC is still frozen and holding its pre-fault command, the handover is clean. If the PPC unfreezes before the inverters exit fault mode, or uses a different voltage measurement point and threshold, the two can fight: the PPC begins integrating on a voltage the inverters are still controlling. Keentel recommends that the freeze logic be driven by both the PPC's own voltage measurement and the inverters' fault-mode status, with the post-recovery hold set longer than the slowest of the two signals.
8.5 Gain and delay in weak grids
The PPC's effective loop gain is proportional to the network's voltage sensitivity, about 1/SCR on the plant base. A PPC tuned for a strong grid can be poorly damped at the weakest credible SCR, and poor damping turns any post-fault disturbance into an oscillation. The phase margin of an integral voltage controller with total delay Td is approximately:

which leads to a simple screening limit for the integral gain at the minimum credible SCR:

for a 45° phase margin. With SCRmin = 1.9 and Td = 0.25 s, Ki should not exceed about 6.0 pu per pu per second. This screening calculation must be confirmed with the supplier's PPC model, but it explains why gain scheduling by system strength, or simply tuning for the weakest case, is part of post-fault overvoltage mitigation.
How Keentel Engineering helps here: Keentel reviews PPC control logic for freeze, hold, reset and anti-windup functions, checks that the field settings match the planning and EMT models, and tunes gains for the weakest credible grid. Where the PPC supplier's logic is incomplete, we write functional specifications for the missing functions and verify them in hardware-in-the-loop or EMT tests before commissioning.
9. Inverter terminals versus the POI
9.1 Why the terminals are higher
Ride-through requirements are written at the POI or RPA. Inverter protection acts at the inverter terminals. Between the two sit the main power transformer (MPT), the collector system and the inverter step-up transformers. When the plant injects reactive power into the grid, current flowing through those impedances raises the voltage toward the inverters:

where Xplant is the total reactance from the POI to the inverter terminals, and the current is expressed in the generator convention. For reactive current injection, the rise is approximately Xplant·Iq. For active current flow through resistive collector cables, the resistive term adds further rise.
Worked example 8 — inverter terminal voltage for four operating points
Keentel calculated the inverter terminal voltage for a 200 MW plant on a 100 MVA base with an MPT reactance of 0.048 pu, an aggregate collector reactance of 0.012 pu and aggregate inverter transformer reactance of 0.025 pu (total about 0.085 pu on 100 MVA, or 0.17 pu on the plant's 200 MVA base).
| Case | POI voltage | Active power at POI | Reactive power at POI | 34.5 kV bus voltage |
|---|---|---|---|---|
| Inverter terminal voltage | A. Full output, full lagging reactive (0.95 pf) | 1.00 pu | 200 MW | +65.7 Mvar |
| 1.036 pu | 1.069 pu | B. Full output, unity pf, high schedule | 1.10 pu | 200 MW |
| 0 | 1.103 pu | 1.111 pu | C. Full output, 40 Mvar injection at high voltage | 1.10 pu |
| 200 MW | +40 Mvar | 1.121 pu | 1.141 pu | D. Post-fault recovery: 120 MW, 120 Mvar residual injection |
| 1.10 pu | 120 MW | +120 Mvar | about 1.15 pu | 1.196 pu |
Case D is the post-fault condition of interest: active power has recovered to 60% of rating and the plant is still injecting 120 Mvar of residual fault reactive power. The POI is at 1.10 pu, at the edge of the band in which a short excursion must be ridden through. The inverter terminals are at almost 1.20 pu, which is a common pickup value for inverter AC overvoltage protection. The plant's own reactive injection has turned a POI excursion that the requirement tolerates into a terminal excursion the inverter may not.
9.2 Tap position and LTC coordination
The MPT tap position sets the steady-state relationship between POI and collector voltage. Plants often choose a tap that boosts collector voltage so the inverters can deliver rated reactive power at low POI voltage. That choice reduces margin at high POI voltage. A practical rule is to check inverter terminal voltage for the combination of:
the highest POI voltage in the transmission operator's schedule;
the MPT tap position used in normal operation;
full reactive injection at that voltage, which some PPC modes will request; and
the post-fault residual reactive current from Section 7.
On-load tap changers are far too slow to help during a post-fault excursion; their time delays are typically 30 to 60 s. They matter because they set the starting point. A plant that begins the event with its inverters at 1.07 pu has 0.13 pu of margin to a 1.20 pu protection setting; a plant that begins at 1.02 pu has 0.18 pu.
9.3 Feeder-end inverters
Inverters at the far ends of long collector feeders sit at higher voltage than those near the collector bus, because the feeder current flows through more cable impedance. In plants with feeders several miles long, the spread between the nearest and farthest inverter can be 1 to 3% at full output. The post-fault overvoltage trip pattern in disturbance reviews, a subset of inverters at feeder ends, follows directly from that spread. Collector system models used for ride-through studies must therefore represent feeders individually, or at least with an equivalent that preserves the highest terminal voltage, rather than a single aggregated inverter at the collector bus.
How Keentel Engineering helps here: Keentel models the collector system feeder by feeder, with as-built cable data, transformer test reports and tap positions, and calculates the highest inverter terminal voltage for every studied event. We recommend MPT tap positions, LTC bands and PPC voltage limits that preserve terminal voltage margin, and we check that aggregated planning models are not hiding the inverters most likely to trip.
10. Shunt capacitors, filters and cable charging
10.1 Fixed capacitance does not ride through anything
Many plants use switched capacitor banks to meet the 0.95 power factor requirement at full output, harmonic filters to meet IEEE 519 limits, and long underground collector cables that generate reactive power. All of these are passive: they supply reactive power in proportion to voltage squared, and they keep doing so whether or not the inverters are running.
Two post-fault situations make that dangerous:
The inverters trip but the capacitors stay in. If some or all inverters trip on overvoltage, momentary cessation or any other cause, the plant loses whatever reactive absorption the inverters were providing to offset the capacitors, and the capacitive reactive power now flows into the grid uncompensated.
The plant loses active output. The active current flowing through the network created an angle and a voltage drop. When it disappears, the voltage rises by the resistive and angle terms in Section 4.
10.2 The voltage step from a capacitor
The voltage change from adding or removing reactive power Q at a bus with short-circuit capacity Ssc is approximately:

Worked example 9 — capacitor overvoltage after an inverter trip
The plant's 34.5 kV collector bus is fed through the 200 MVA, 10% MPT from a 138 kV POI with 500 MVA short-circuit capacity. On a 100 MVA base, the grid reactance is 0.20 pu and the MPT reactance is 0.05 pu, so the short-circuit capacity at the 34.5 kV bus is about 400 MVA.
| Event at the 34.5 kV bus | Uncompensated reactive power change | Approximate voltage rise |
|---|---|---|
| 30 Mvar capacitor bank plus 6 Mvar filter in service, inverters offline (for example after a trip) | 36 Mvar | about 9% |
| Inverters absorbing 30 Mvar to offset capacitance at light load, then tripping | 30 Mvar | about 7.5% |
| Both at once: capacitance in service, absorbing inverters trip | 66 Mvar | about 16.5% |
If the collector bus was at 1.04 pu before the event, a 16.5% rise takes it above 1.2 pu, which can trip the remaining inverters and stress arresters and transformers. That is how one overvoltage trip becomes many.
10.3 Practical rules for shunt devices
Trip or block capacitor banks fast when inverters trip. A transfer-trip or fast overvoltage element on capacitor banks, coordinated with inverter trip status, prevents the second overvoltage.
Use capacitor banks for steady-state support, inverters or STATCOMs for dynamic support. A switched capacitor bank should be in service only when the plant actually needs its reactive power, not as a permanent offset that the inverters must fight.
Account for cable charging at night and at low output. Long collector cables can push several Mvar into the grid with no generation. Shunt reactors or inverter reactive absorption at night may be required, and those must not disappear suddenly.
Include filters in ESCR. Harmonic filters are capacitive at fundamental frequency and must be included in ESCR and in post-trip overvoltage checks.
Block capacitor switching during and after disturbances. The PPC's slow reactive control must not switch in a capacitor because it saw low voltage during a fault.
10.4 Load rejection and line charging
At the transmission level, the loss of a large plant's output on a long, lightly loaded line can raise voltage through line charging, the same mechanism that causes the Ferranti effect. A 345 kV line generates on the order of 0.8 to 1 Mvar per mile of charging, so a 100-mile line produces about 80 to 100 Mvar that must be absorbed somewhere. When a plant that was absorbing part of that charging trips, or when the line becomes radial to the plant after a breaker operation, the remote end can rise significantly. Transmission planners use shunt reactors and voltage control to manage this; plant owners should know whether their POI is exposed to it, because it adds to the post-fault excursion. Keentel's companion guide on the Ferranti effect covers the line physics.
How Keentel Engineering helps here: Keentel sizes and coordinates capacitor banks, shunt reactors and harmonic filters for IBR plants, including their switching logic, blocking during disturbances and fast tripping after inverter trips. We include every shunt device in ESCR and post-trip overvoltage calculations, and we check the night-time and low-output cases that are easy to miss.
11. Unbalanced faults, temporary overvoltage and grounding
11.1 Unfaulted-phase overvoltage
Most transmission faults are single-line-to-ground (SLG). During an SLG fault, the voltage on the two unfaulted phases rises above normal phase-to-ground voltage by an amount that depends on the ratio of zero-sequence to positive-sequence impedance at the fault location. With positive- and negative-sequence impedance equal (Z1 = Z2) and zero-sequence impedance Z0, the sequence voltages at the fault are:

and the unfaulted phase voltages are:

The ground fault factor is the highest unfaulted phase voltage divided by normal phase-to-ground voltage. The coefficient of grounding (COG) expresses the same voltage as a percentage of normal phase-to-phase voltage, so COG = ground fault factor ÷ √3 × 100%.
Worked example 10 — ground fault factor versus X0/X1
| X0/X1 | R0/X1 | Ground fault factor | COG |
|---|---|---|---|
| 1 | 0 | 1.00 | 57.7% |
| 2 | 0 | 1.15 | 66.1% |
| 3 | 0 | 1.25 | 72.1% |
| 3 | 1 | 1.35 | 77.8% |
| 4 | 0 | 1.32 | 76.4% |
| 10 | 0 | 1.52 | 87.8% |
| very large (ungrounded) | 0 | approaches 1.73 | approaches 100% |
IEEE Std C62.92 describes a system as effectively grounded when X0/X1 is positive and no greater than 3, and R0/X1 is positive and no greater than 1, for all operating conditions. Those limits correspond to a COG of no more than about 80%, which is consistent with the table. A system that meets them sees unfaulted phase voltages of about 1.25 to 1.35 pu of normal during a ground fault; one that does not can see up to about 1.73 pu.
11.2 Where IBR plants are vulnerable
Inverters are not zero-sequence sources: most grid-following inverters do not produce zero-sequence current, and their step-up transformers are commonly delta on the inverter side. The 34.5 kV collector system therefore depends on the MPT connection and on grounding transformers for its zero-sequence path.
| Collector grounding arrangement | Behavior during a 34.5 kV ground fault | Overvoltage implication |
|---|---|---|
| MPT grounded-wye on the 34.5 kV side, solidly grounded | Zero-sequence source present; COG typically within effective grounding limits | Unfaulted phases about 1.25–1.4 pu |
| Grounding transformer (zigzag or wye-delta) sized for effective grounding | Effective grounding maintained | Similar to above, if the grounding bank stays in service |
| Grounding transformer sized for limited fault current (impedance grounding) | Higher X0/X1 | Unfaulted phases can approach 1.73 pu |
| No collector-side zero-sequence source, or grounding bank tripped | Collector effectively ungrounded once the MPT feeder breaker opens | Full phase-to-phase voltage on unfaulted phases; risk of ferroresonance with capacitive cables |
A particular hazard is the islanded collector feeder: if the feeder breaker opens on a ground fault while inverters on that feeder continue to run, the feeder can be energized without a zero-sequence source. The unfaulted phases rise toward line-to-line voltage. Inverters must detect this condition and cease within a short time, and arresters on that feeder must be rated for it.
11.3 Overvoltage at the POI during transmission faults
At the transmission level, effectively grounded 115 kV to 500 kV systems usually limit unfaulted phase overvoltage during SLG faults to about 1.2 to 1.4 pu at the fault and less elsewhere. But a plant that injects only positive-sequence reactive current during an SLG fault raises all three phases equally; on the unfaulted phases, that adds to the rise caused by the fault itself. That is one reason IEEE 2800 requires negative-sequence current injection during unbalanced faults: correctly controlled negative-sequence current reduces the unfaulted phase voltages and the negative-sequence voltage.
11.4 Temporary overvoltage after clearing
After an SLG fault is cleared, the zero-sequence and negative-sequence voltages disappear within a cycle or two, but any positive-sequence overvoltage from residual reactive current remains, as in Section 7. In addition, transformer energization or recovery inrush after a deep fault can create harmonic-rich voltages that interact with collector capacitance and filters. In plants with a parallel resonance near a low harmonic, the post-fault waveform can show distorted peaks that a peak-detecting inverter overvoltage element sees as overvoltage even when the RMS is within limits. Keentel's guides on harmonic resonance and transformer inrush describe those mechanisms.
How Keentel Engineering helps here: Keentel performs grounding studies for IBR collector systems, calculates X0/X1, R0/X1 and COG for every operating configuration, including grounding banks out of service and islanded feeders, and specifies grounding transformer ratings to meet effective grounding where required. We also check that inverter overvoltage and islanding logic will cease energization on an ungrounded collector section before arresters and cable insulation are overstressed.
12. Inverter protection: AC overvoltage, DC overvoltage and PLL
12.1 AC overvoltage elements
Inverters typically include several layers of AC overvoltage protection:
| Element | Typical basis | Typical purpose | Risk in post-fault events |
|---|---|---|---|
| Instantaneous peak overvoltage | Peak of instantaneous phase voltage, sub-cycle detection | Protect semiconductors and DC link from voltage beyond their rating | Can trip on the first-cycle peak after clearing or on distorted waveforms, even when RMS is inside the ride-through envelope |
| Fast RMS overvoltage | RMS or positive-sequence magnitude over one cycle or less, short delay | Equipment protection | Trips on sustained post-fault overshoot if pickup and delay are below the ride-through envelope |
| Time-delayed RMS overvoltage | Longer delay, lower pickup | Prevent prolonged operation above continuous rating | Must sit above the HVRT envelope (for example, delays beyond the 1 s band at 1.10–1.20 pu) |
| Individual phase versus sequence measurement | Phase or positive-sequence quantities | Affects response to unbalanced faults | Phase-based elements may trip on unfaulted phase rise during SLG faults |
Disturbance reviews have repeatedly found inverters tripping on instantaneous peak overvoltage elements set at around 1.15 to 1.2 pu of peak with detection times of a millisecond or so. Such settings are tighter than many ride-through envelopes allow and often tighter than the equipment's real withstand capability. Converting them to RMS-based elements with time delays coordinated to the HVRT envelope, while keeping a true equipment protection limit at a higher value, has been a common corrective action.
12.2 Coordinating protection with ride-through
The coordination rule is easy to state: no protective element may trip the plant inside a region where the applicable requirement mandates ride-through, unless the element protects against a condition that would damage the equipment and the owner has documented that limitation as permitted by the requirement. In practice:
every overvoltage element should be plotted against the HVRT envelope at the same reference point, after accounting for the voltage difference between the RPA and the inverter terminals;
peak-detected elements should be compared with the transient overvoltage ride-through characteristic, not the RMS table;
time delays should account for measurement windows: an element with a one-cycle RMS window and a 100 ms delay needs about 117 ms of overvoltage to operate;
elements should be reviewed again after every firmware update, because defaults can change.
12.3 DC-link overvoltage
When a fault clears and the AC voltage recovers suddenly, the inverter's DC-link voltage can rise if the active current the inverter is exporting does not match the power coming from the PV array, battery or turbine converter. For PV inverters, the array continues to produce power during the fault while the inverter's active current is limited; that energy charges the DC link. A fast AC voltage rise after clearing reduces the inverter's ability to export current at the same modulation, pushing DC voltage up further. Some inverters protect the DC link with a chopper or by shifting the array operating point; others trip. DC-link overvoltage trips after fault clearing have been identified in disturbance reviews and should be evaluated in EMT studies with the supplier's model, because generic positive-sequence models usually do not represent them.
12.4 PLL behavior at clearing
Fault clearing is often accompanied by a phase angle jump at the POI, as the network topology changes. A grid-following inverter's PLL must re-track the angle. During re-tracking, the inverter's current is briefly misaligned with the voltage, so some of its intended active current appears as reactive current and vice versa. In a weak grid, that transient can add to the overvoltage or cause a dip, and very fast PLLs can lose synchronism. Ride-through requirements in IEEE 2800 and PRC-029-1 address phase angle jumps explicitly, and the post-fault study must include realistic angle jumps, not only magnitude changes.
How Keentel Engineering helps here: Keentel performs protection coordination for IBR plants that places every inverter, collector, MPT and POI protective element on the same voltage and frequency ride-through envelopes, at the correct reference points. We identify instantaneous and fast elements that could trip on post-fault overshoot, work with suppliers on manufacturer-approved changes, and document legacy equipment limitations where they are genuinely physical.
13. Surge arresters and insulation coordination
13.1 What arresters must withstand
Metal-oxide surge arresters protect transformers, cables and inverters from switching and lightning surges. They are selected primarily by their maximum continuous operating voltage (MCOV) and their temporary overvoltage (TOV) capability, which is a curve of voltage versus duration that the arrester can absorb without thermal runaway. Post-fault overvoltage and ground-fault TOV both consume that capability.
The MCOV must exceed the highest continuous phase-to-ground voltage the arrester will see:
on an effectively grounded system, the maximum phase-to-ground operating voltage, about 1.05 × VLL ÷ √3;
on an impedance-grounded or ungrounded system, the maximum phase-to-phase voltage, because a sustained ground fault places line-to-line voltage across the arresters on the unfaulted phases.
Worked example 11 — arrester selection on a 34.5 kV collector
| Quantity | Value |
|---|---|
| Nominal system voltage | 34.5 kV |
| Maximum system voltage (1.05 × nominal) | 36.2 kV phase-to-phase; 20.9 kV phase-to-ground |
| Minimum MCOV, effectively grounded collector | about 20.9 kV, so a standard rating of about 22 kV MCOV is commonly used |
| Minimum MCOV, impedance-grounded or ungrounded collector | about 36.2 kV, so a rating of about 36.5 kV MCOV is commonly used |
| TOV during a ground fault, effectively grounded (ground fault factor about 1.3) | about 27.2 kV for the fault clearing time |
| TOV during a ground fault, ungrounded or islanded feeder | up to about 36.2 kV, possibly for seconds if not cleared |
Arrester TOV capability varies by product. Using illustrative capability factors of 1.40 × MCOV for 1 s and 1.30 × MCOV for 10 s (actual curves come from the arrester manufacturer):
| Arrester | 1 s capability | 10 s capability | Effectively grounded TOV (27.2 kV) | Ungrounded TOV (36.2 kV) |
|---|---|---|---|---|
| 22 kV MCOV | 30.8 kV | 28.6 kV | Withstands | Fails within about a second |
| 29 kV MCOV | 40.6 kV | 37.7 kV | Withstands | Withstands for seconds, not continuously |
| 36.5 kV MCOV | 51.1 kV | 47.5 kV | Withstands | Withstands, continuous at MCOV |
The lesson is that an arrester selected for an effectively grounded collector can be destroyed if the collector loses its zero-sequence source, for example when a grounding bank trips or a feeder islands with inverters still running. Arrester selection, collector grounding and inverter islanding logic must be designed together.
13.2 Post-fault positive-sequence overvoltage and arrester energy
A positive-sequence post-fault overvoltage of 1.2 to 1.3 pu for a few hundred milliseconds, as in the unmitigated case of Figure 1, is normally within arrester TOV capability when the arrester MCOV was selected correctly. It becomes a problem when it is combined with ground-fault TOV, with resonance, or with a capacitor bank left in service after inverters trip, which can hold the overvoltage for seconds. The arrester is the last line of defense; it is not a mitigation for a control problem.
13.3 Insulation and equipment ratings
Transformers, cables, capacitor banks and inverter filters have their own short-time overvoltage capabilities. IEEE C57.12.00 defines the continuous overexcitation capability of power transformers (for example, operation at up to 105% of rated voltage at rated load, with higher values at no load). Inverters have AC voltage ratings that may be lower than those of the rest of the plant. The plant's overvoltage design should be anchored on the weakest component, which is often the inverter, and the inverter's real capability should be obtained from the supplier in writing.
How Keentel Engineering helps here: Keentel performs insulation coordination for IBR plants and interconnection substations, from 34.5 kV collectors to 345 kV and 500 kV POIs. We select arrester MCOV and TOV ratings for every grounding configuration, verify arrester energy for post-fault and ground-fault overvoltages, and check transformer, cable, capacitor and inverter short-time capabilities so that the plant's overvoltage limits are set by its weakest component, with margin.
14. Grid-forming inverters, STATCOMs and synchronous condensers
14.1 Grid-forming inverters
A grid-forming (GFM) inverter behaves, within its current limits, like a voltage source behind an impedance. It does not rely on a conventional PLL to follow the grid; it establishes its own internal voltage magnitude and angle and lets current flow according to the network. That changes the post-fault picture in three ways:
Natural reactive release. When the grid voltage recovers, the difference between the GFM inverter's internal voltage and the grid voltage shrinks, so its reactive current falls on its own, without waiting for a measurement and a decision. A GFM inverter that was supporting voltage during the fault does not need a hold-and-release scheme in the same way as a grid-following unit.
Voltage stiffness. A GFM inverter resists voltage changes at its terminals, so it opposes overshoot as well as dips. In effect it adds to the system strength seen by nearby grid-following plants.
Current limiting transitions. During a deep fault, a GFM inverter hits its current limit and must switch to a current-limiting mode, which may temporarily behave like a current source. The transition back to voltage-source behavior at clearing must be designed carefully; a poorly tuned exit can itself produce overshoot, angle jumps or oscillation.
GFM capability is increasingly specified for battery storage in weak areas, and US transmission providers and ISOs are developing GFM performance requirements. Keentel's position is that GFM is a powerful mitigation for post-fault overvoltage in weak grids, but not an automatic one: its current-limiting and recovery behavior must be studied in EMT with the supplier's code, for the same events as any other plant.
14.2 STATCOMs
A STATCOM can regulate voltage quickly and absorb reactive power when voltage overshoots. In a plant with a STATCOM and grid-following inverters, the STATCOM's fast voltage control can counteract post-fault overshoot, provided:
its own fault ride-through logic does not hold capacitive current after clearing;
its slope and voltage reference are coordinated with the PPC so that the two do not fight;
its controls are fast enough, and its inductive capacity large enough, to absorb the residual injection from the inverters; and
it is not frozen or blocked during the recovery period.
A STATCOM adds dynamic reactive capability but contributes little fault current and does not add system strength in the way a synchronous machine does. Keentel's guides on the STATCOM V–I characteristic and on SVC versus STATCOM cover the device-level details.
14.3 Synchronous condensers
A synchronous condenser adds short-circuit capacity, inertia and voltage stiffness to the POI. It raises SCR directly, which reduces the network reactance that multiplies residual reactive current. A condenser's subtransient reactance also responds instantly to a voltage rise by absorbing reactive current, which limits the first-cycle overshoot.
The short-circuit contribution of a condenser through its step-up transformer is approximately:

For a 50 MVA condenser with X″d = 0.15 pu and a 0.10 pu step-up transformer, the contribution is about 200 MVA. Added to the 380 MVA N-1 case in Worked example 2, the 138 kV POI rises to about 580 MVA, or SCR 2.9 for the 200 MW plant. Using the simplified relationship ΔV ≈ Iq/SCR, the voltage rise per pu of residual reactive current falls by about a third.
Condensers carry capital, losses, maintenance and space costs, and their own protection must be coordinated with PRC-024-4 requirements as synchronous machines. They are usually justified where several plants share a weak area or where weak-grid stability and post-fault overvoltage problems both need solving.
14.4 Comparing the options
| Mitigation hardware | Effect on first-cycle peak | Effect on sustained overshoot | Adds system strength | Typical application |
|---|---|---|---|---|
| GFM battery inverters | Moderate reduction | Strong reduction if recovery is well tuned | Yes, within current limits | New BESS or hybrid plants in weak areas |
| STATCOM | Small reduction | Strong reduction if fast and coordinated | Little | Plants needing dynamic reactive capability anyway |
| Synchronous condenser | Strong reduction | Strong reduction | Yes, substantially | Shared weak areas, plants needing system strength for stability |
| Shunt reactor (switched) | None | Helps only for slow, sustained overvoltage | No | Night-time and light-load voltage control |
| Network reinforcement | Strong reduction | Strong reduction | Yes | Long-term solution for very weak areas |
How Keentel Engineering helps here: Keentel evaluates grid-forming inverters, STATCOMs, synchronous condensers and network reinforcement on an equal-performance basis for post-fault overvoltage and weak-grid stability. We size the selected solution, specify its ride-through and recovery behavior, and verify in EMT that it improves, rather than complicates, the plant's response to faults.
15. Modeling: what positive-sequence models show and what they miss
15.1 The generic US renewable models
US planning studies represent IBR plants with the WECC second-generation generic renewable energy models in PSS®E and PSLF: a converter interface model (REGC), an electrical control model (REEC) and a plant controller model (REPC), with variants for wind and storage. These models include parameters that matter directly for post-fault overvoltage:
| Model feature | What it represents | Why it matters |
|---|---|---|
| Voltage dip thresholds | Entry into and exit from fault mode | Decides when reactive injection starts and stops |
| Reactive current gain during dips | K-factor | Sets reactive current at the instant of clearing |
| Post-dip reactive current hold time | How long fault-mode reactive current continues after recovery | The single most important parameter for post-fault overshoot in weak grids |
| Active current recovery rate | How fast active power returns | Interacts with reactive release (Section 4) |
| Current limits and priority | Ip and Iq limits during and after the event | Bounds the injection |
| Plant controller freeze threshold | Voltage below which the plant controller stops integrating | Prevents windup in the model; must match the field logic |
| Plant controller gains, droop, deadband and filters | PPC dynamics | Decide post-fault damping |
When these parameters match the field settings, generic models can reproduce the broad shape of post-fault recovery at the RPA, which is useful for system-wide planning under TPL-001-5.1.
15.2 What they miss
Positive-sequence models solve phasor equations at time steps of a quarter to half a cycle. They cannot represent:
the first-cycle peak after clearing, which depends on instantaneous current control and switching;
peak-detected instantaneous overvoltage elements;
negative-sequence current injection and unfaulted-phase overvoltage during unbalanced faults (most positive-sequence programs treat unbalanced faults through equivalent shunts);
PLL dynamics and phase-angle-jump behavior;
DC-link dynamics and DC overvoltage protection;
harmonics, resonances and waveform distortion that affect peak detection;
firmware-specific logic such as staged mode transitions, timers and latches.
A positive-sequence study can therefore show a plant riding through a fault cleanly while the actual control code would trip on a sub-cycle overvoltage. Positive-sequence models answer the planning question of how the system behaves if the plant behaves as modeled; EMT models answer the question of whether the plant will behave as modeled.
15.3 EMT models and model quality
EMT models in PSCAD or similar tools represent instantaneous three-phase quantities at microsecond time steps. For post-fault overvoltage studies, a usable vendor EMT model must:
contain the actual inverter and PPC control code (often as compiled, black-boxed code) at the firmware version installed in the field;
include all relevant protection functions, with their actual detection methods and settings;
represent the DC side adequately for DC-link behavior;
run at the time step the vendor specifies and initialize cleanly;
be accompanied by documentation of parameters and their field values; and
be benchmarked against type tests, hardware-in-the-loop tests or field recordings.
NERC reliability guidelines on EMT modeling of IBRs describe model quality checks, and many US transmission providers now require an EMT model and a model quality test report as part of the interconnection request, with updates at defined milestones under FERC Order No. 2023 procedures.
15.4 Keeping models and field settings aligned
Model fidelity is lost quickly if the field settings drift. Every firmware update, every protection setting change and every PPC retune made during commissioning must flow back into the RMS and EMT models, and into the MOD-026-2 verification record. Keentel recommends a single controlled settings register for each plant that both the field team and the modeling team use, with a change-control step that triggers model updates.
How Keentel Engineering helps here: Keentel builds and reviews positive-sequence and EMT models for IBR plants, including parameterization of REGC, REEC and REPC models from vendor data, EMT model quality testing and benchmarking between the two. We maintain settings registers that keep field values, study models and MOD-026-2 verification records aligned through commissioning and every later change.
16. Study methodology: proving a plant will not trip after clearing
16.1 Study scope
A post-fault overvoltage study is a targeted extension of the ride-through and weak-grid studies most transmission providers already require. Keentel's standard scope is:
| Dimension | Range studied |
|---|---|
| System strength | System-intact, N-1 and planned-outage conditions down to the weakest credible SCR and ESCR; future queue plants included where their interconnection is committed |
| Fault types | Three-phase, single-line-to-ground, line-to-line and double-line-to-ground |
| Fault locations | At the POI, at remote ends of each line out of the POI and at electrically intermediate points; faults that produce dips of about 0.1, 0.3, 0.5 and 0.7 pu at the POI |
| Clearing times | Normal clearing (typically 3 to 6 cycles at 138 kV to 500 kV), delayed clearing with breaker failure, and remote-end clearing |
| Reclosing | Unsuccessful reclosing into a permanent fault, producing consecutive excursions |
| Plant dispatch | Full output, partial output and minimum output; maximum and minimum reactive operating points; night-time for solar and charging for BESS |
| Pre-fault voltage | Upper and lower ends of the transmission operator's voltage schedule |
| Shunt device status | Capacitor banks and filters in and out of service |
| Neighboring plants | With and without nearby IBRs, STATCOMs and condensers in service |
16.2 What to measure
| Quantity | Location | Acceptance basis |
|---|---|---|
| RMS and positive-sequence voltage versus time | RPA/POI | Applicable HVRT and LVRT envelopes |
| Instantaneous phase voltage peaks | RPA/POI and inverter terminals | Transient overvoltage ride-through characteristic and equipment capability |
| RMS voltage versus time | Inverter terminals, worst-case feeder ends | Inverter protection settings and voltage ratings |
| Active power recovery time | RPA/POI | Required post-fault recovery (commonly 1 s or as specified) |
| Reactive current during the fault | RPA/POI | Required reactive current response |
| Reactive power after clearing | RPA/POI | No sustained over-injection; damping of oscillation |
| Protection element status | Every inverter and plant relay | No trip inside mandatory ride-through regions |
| DC-link voltage | Inverter | Below DC protection thresholds |
| Arrester energy | Collector and POI | Within rated capability |
| Damping ratio of post-fault oscillation | RPA/POI | Transmission provider criterion, commonly 3% to 5% minimum |
16.3 Acceptance criteria
A plant passes when, for every studied case:
1. it remains connected and in the required operating mode through the whole event;
2. RPA voltage stays within the applicable envelopes after accounting for the plant's own contribution;
3. inverter terminal voltages stay below protection pickups with documented margin (Keentel typically seeks at least 0.03 pu, more where model uncertainty is high);
4. active power recovers within the required time and reactive power settles without sustained overshoot;
5. any oscillation is adequately damped; and
6. arrester and equipment short-time capabilities are not exceeded.
16.4 The four-quadrant view
A useful way to summarize study results for decision makers is a four-quadrant table that separates the two excursions:
Post-fault excursion inside HVRT envelope
Post-fault excursion outside HVRT envelope
Fault dip inside LVRT envelope
Pass; confirm protection margins
Post-fault problem: control release, PPC windup, shunt devices
Fault dip outside LVRT envelope
Fault-period problem: grid issue or inverter fault mode
Both: often very weak grid; consider system strength
Most plants in weak areas land in the upper-right quadrant at first: they ride through the fault but not its aftermath. That is good news, because the upper-right quadrant is usually fixed with settings.
16.5 Using screening to target EMT runs
EMT studies are expensive in time and computing. Keentel uses a three-stage approach:
1. Analytical screening with the relationships in this guide: SCR, ΔV ≈ X·Iq, inverter terminal offsets, capacitor steps, grounding factors. This identifies which conditions could possibly fail.
2. Positive-sequence screening with the generic models at many conditions, to find the worst cases for RPA voltage.
3. EMT confirmation with the vendor model at the worst cases and their neighbors, including unbalanced faults and protection.
This approach typically reduces the EMT run count by an order of magnitude compared with brute force, while making sure the worst cases are not missed.
How Keentel Engineering helps here: Keentel delivers post-fault overvoltage and ride-through studies that transmission providers accept: a clear scope, documented models, envelope-based acceptance criteria and four-quadrant summaries that show decision makers exactly which events fail and why. Our screening-first approach keeps EMT effort focused on the cases that matter.
17. The mitigation toolbox
17.1 Ranked by cost and effectiveness
| Rank | Mitigation | Cost | Effect on post-fault overvoltage | Notes |
|---|---|---|---|---|
| 1 | Shorten or remove post-fault reactive current hold; coordinate release with active power recovery | Settings | High | Check voltage sag risk in very weak grids |
| 2 | Enable fast high-voltage reactive absorption | Settings | High | Coordinate with PPC and STATCOM |
| 3 | PPC freeze during fault plus post-recovery hold covering loop delay | Settings or PPC logic change | High for long events, moderate for short | Must match model freeze parameter |
| 4 | PPC anti-windup clamp and back-calculation | Settings or PPC logic change | Moderate | Also improves normal operation near limits |
| 5 | Retune PPC gains for weakest credible SCR, or gain schedule | Settings | Moderate | Also improves weak-grid stability |
| 6 | Convert instantaneous peak overvoltage trips to RMS-based, time-coordinated elements, keeping a true equipment limit | Settings, with manufacturer approval | High for trip prevention | Does not reduce voltage; prevents unnecessary trips |
| 7 | Reduce K-factor where requirements allow | Settings | Moderate | Must still meet fault reactive current requirements |
| 8 | Fast capacitor bank tripping or blocking on inverter trip or overvoltage | Protection and logic | High for post-trip overvoltage | Prevents cascade |
| 9 | Adjust MPT tap or LTC band to lower inverter terminal voltage | Operations | Moderate | Check low-voltage reactive capability |
| 10 | Enable negative-sequence injection for unbalanced faults | Settings or firmware | Moderate for unfaulted-phase overvoltage | Also required by IEEE 2800 |
| 11 | Firmware upgrade with improved recovery logic | Firmware, testing | High | Requires model update and possibly restudy |
| 12 | Grid-forming capability for BESS | Equipment or firmware | High | Requires careful tuning of current-limit transitions |
| 13 | STATCOM | Equipment | High if coordinated | Adds dynamic range |
| 14 | Synchronous condenser | Equipment | High | Also improves stability and protection |
| 15 | Network reinforcement or operating limits | Capital or lost energy | High | Last resort or long-term solution |
17.2 Settings first, but not settings only
The first seven items are settings or logic changes that cost little and often solve the problem. They should be explored first, with the supplier, in EMT. But settings changes have consequences beyond overvoltage: faster reactive release can increase the risk of voltage sag in very weak grids; lower K-factor reduces fault support and can affect protection; RMS-based overvoltage elements must still protect the equipment. Every settings change should be checked across the full study scope in Section 16, not only the case that failed.
17.3 When settings are not enough
If the plant still fails at the weakest credible SCR after the settings in the first seven rows are optimized, the remaining options are equipment (GFM, STATCOM, condenser), network reinforcement or an operating limit. Keentel's experience is that this happens mainly below SCR of about 1.5 to 2, at shared weak buses with several plants, or where legacy inverters cannot be reprogrammed. For legacy equipment, PRC-029-1 and PRC-030-1 provide paths to document equipment limitations and justify not making a change, but those paths require evidence, not assertion.
How Keentel Engineering helps here: Keentel develops mitigation plans that start with the lowest-cost settings changes and escalate only when the studies show they are needed. Each recommended change is tested in EMT across the full study scope, documented with manufacturer approval, and carried into the plant's models, protection settings and compliance records.
18. Several plants at a shared weak bus
18.1 Why neighbors matter
Post-fault overvoltage is not only a single-plant problem. When several IBR plants connect to the same substation or to electrically close substations, a fault on the surrounding network puts all of them into fault mode at the same moment, and all of them exit at the same moment. Their residual reactive currents add in the shared network impedance. Each plant may have been studied on its own, against a grid that included the others only as fixed equivalents, and each may pass on its own. Together they may not.
Weighted short-circuit ratio captures the steady-state version of this effect. For post-fault overvoltage, the same logic applies to the residual currents: the voltage rise at a shared bus is set by the total residual reactive power of all plants divided by the shared short-circuit capacity.
Worked example 12 — three plants releasing together
Three plants, rated 200 MW, 150 MW and 150 MW, connect to the same 345 kV switching station, where the short-circuit capacity without the plants is 900 MVA. Each plant's single-plant SCR looks comfortable:
| Plant | Rating | Single-plant SCR |
|---|---|---|
| A (solar) | 200 MW | 4.5 |
| B (wind) | 150 MW | 6.0 |
| C (storage) | 150 MW | 6.0 |
| All three, WSCR | 500 MW | 1.8 |
Suppose each plant leaves 0.3 pu of its own rating flowing as residual reactive current after clearing (60, 45 and 45 Mvar).
| Case | Residual reactive power | Approximate voltage rise at the shared bus |
|---|---|---|
| Plant A alone, as studied in its own interconnection study | 60 Mvar | about 0.067 pu |
| All three plants releasing together | 150 Mvar | about 0.167 pu |
The plant that passed its own study with a post-fault rise of about 7% sees a rise of about 17% when its neighbors behave the same way. The difference is entirely in the assumptions about the neighbors.
18.2 Interactions beyond simple addition
The neighbors also interact dynamically:
Control fighting. Plant controllers regulating voltage at nearby buses with high gain and little droop can push against each other after a disturbance, prolonging overshoot or producing oscillation.
Different release times. If one plant releases its reactive current quickly and another holds it, the fast plant may see an overvoltage it would not have seen alone and respond by absorbing, which then interacts with the slow plant's release.
Cascading trips. If one plant trips on overvoltage, the loss of its active power and the change in its reactive flow change the voltage at the shared bus, which can push a neighbor over its own threshold.
Mixed technologies. Wind turbines with doubly fed generators, full-converter wind turbines, PV inverters, battery power conversion systems, STATCOMs and synchronous condensers all have different fault and recovery behavior. Generic assumptions about neighbors are rarely accurate.
18.3 Study practice
For plants in shared weak areas, Keentel recommends:
including all existing and committed nearby IBRs in EMT studies with their own vendor models, where the transmission provider can make them available under appropriate confidentiality arrangements;
where neighbor models are unavailable, bounding their behavior with sensitivity cases that assume both fast and slow reactive release;
coordinating voltage droop and controller gains among plants that regulate nearby buses, with the transmission operator's involvement;
reviewing post-fault behavior again whenever a new plant connects nearby, because each new plant changes the shared network's effective strength.
How Keentel Engineering helps here: Keentel performs multi-plant EMT studies for shared weak areas, using vendor models where available and documented sensitivity bounds where they are not. We help transmission providers and owners coordinate droops, gains and release logic across plants, so that a new interconnection does not create post-fault overvoltage problems for the plants already there.
19. Battery storage and hybrid plant specifics
19.1 Charging, discharging and idle states
A battery energy storage system can be discharging, charging or idle when a fault occurs, and each state changes the post-fault picture:
BESS state at fault
Post-fault effect
Discharging at full power
Similar to a PV plant: active current must be restored after clearing; reactive release and active recovery interact as in Section 4
Charging at full power
The plant was absorbing active power, so the network angle and voltage drop were in the opposite direction; when charging current is interrupted during the fault, the plant's effect on voltage reverses; on recovery, the reinstated charging current lowers voltage, which can partly offset overshoot
Idle, or regulating voltage at zero active power
No active power recovery to offset reactive release; the full residual reactive current appears as overvoltage; often the worst case for post-fault overshoot
Providing frequency response or regulation
Active power setpoint changing during the event; PPC and energy management logic may command changes during the recovery window
Night-time and idle conditions deserve special attention because they combine three aggravating factors: no active power to offset reactive release, light system load with higher pre-fault voltages, and collector cable charging that may already be pushing reactive power into the grid.
19.2 DC-link energy in battery and PV inverters
The DC-link capacitor of an inverter stores a small amount of energy. Any mismatch between the power flowing in from the DC source and the power flowing out to the AC network changes that energy and therefore the DC voltage:

Worked example 13 — DC-link rise after clearing
A 4 MVA power conversion system has a DC-link capacitance of 20 mF at a nominal DC voltage of 1,500 V. The stored energy is ½CV² = 22.5 kJ.
| Power mismatch | Duration | Energy added | DC voltage after the transient | Rise |
|---|---|---|---|---|
| 2 MW | 5 ms | 10 kJ | about 1,803 V | about 20% |
| 1 MW | 5 ms | 5 kJ | about 1,658 V | about 11% |
| 2 MW | 2 ms | 4 kJ | about 1,628 V | about 8.5% |
A few milliseconds of mismatch are enough to raise the DC link by 10 to 20%. That is why DC choppers, fast current control and coordinated DC voltage protection matter during fault clearing, and why DC-link behavior must be represented in EMT studies. For a battery that is charging, the direction of the mismatch reverses, but the same sensitivity applies.
19.3 Hybrid plants and shared PPCs
In a hybrid plant, a single PPC typically coordinates PV inverters and BESS power conversion systems behind one POI. The two resource types may have different fault ride-through firmware, different release logic and different overvoltage settings. Common problems include:
PV inverters and BESS units exiting fault mode at different thresholds, so one resource is following the PPC while the other is still in fault mode;
the PPC distributing post-fault reactive commands to whichever resource is available first, concentrating the injection in one part of the collector system;
different overvoltage protection on the two resource types, so one trips and the other does not, changing reactive balance abruptly;
energy management logic that changes BESS dispatch during the recovery window.
The study and specification guidance in this guide applies to each resource type separately and to their coordination through the PPC. Keentel's companion guide on power plant controllers covers hybrid reactive dispatch in more detail.
19.4 Grid-forming storage as a neighbor
When a grid-forming BESS shares a POI or a weak area with grid-following PV or wind, the BESS can stiffen the voltage and reduce overshoot for the whole site, as discussed in Section 14. The benefit depends on the BESS being available: in service, with enough current headroom and with state of charge that allows it to respond. Studies should include cases with the BESS out of service or at its current limit, and the plant's ride-through design should not depend on the BESS unless its availability is assured and documented.
How Keentel Engineering helps here: Keentel studies battery storage and hybrid plants in every operating state, including charging, idle and night-time conditions that are often the worst cases for post-fault overvoltage. We review DC-link protection and chopper behavior with suppliers, coordinate fault-mode exit and overvoltage settings between PV and BESS equipment, and design PPC logic that keeps hybrid plants inside their envelopes whatever each resource is doing.
20. Testing, commissioning and field verification
20.1 What can and cannot be tested in the field
A plant's post-fault behavior cannot be tested by applying a real fault to the transmission system. Verification therefore combines several kinds of evidence:
| Evidence | What it proves | Limitations |
|---|---|---|
| Type tests of the inverter (including fault ride-through tests with a voltage-dip generator) | The inverter's fault entry, reactive current and recovery behavior at the unit level | Strong test source; does not reproduce weak-grid interaction |
| Hardware-in-the-loop (HIL) testing of the PPC and inverter controls against a real-time grid model | Controller logic, freeze, anti-windup, mode transitions, communication timing | Accuracy depends on the grid and plant model |
| EMT studies with vendor code | Plant-level behavior at the POI across SCR, fault types and dispatch | Model fidelity must be demonstrated |
| Staged commissioning tests | PPC response to voltage and reactive setpoint steps, capability, mode changes, communication timing | Small disturbances; no fault-level events |
| Natural disturbance recordings | Actual plant behavior during real faults | Events occur when they occur; data must be captured |
IEEE 2800.2 organizes these into design evaluation, as-built installation evaluation, commissioning tests and post-commissioning monitoring. The transmission provider decides which are required.
20.2 Commissioning tests that matter for post-fault behavior
Keentel recommends adding the following to standard commissioning in weak areas:
1. Settings and firmware audit. Confirm that every inverter and the PPC run the firmware and settings used in the EMT study, including fault-mode thresholds, hold times, ramp rates, high-voltage response and protection.
2. PPC freeze test. With the PPC in service, inject a simulated voltage dip into the PPC's voltage measurement (through a test set or the controller's test mode) and confirm that the integrator freezes, holds for the specified time after recovery and resumes without a step.
3. Communication latency measurement. Measure the time from a PPC setpoint change to the response of the last inverter; compare with the delay assumed in the study.
4. Voltage step tests. Apply ±1% and ±2% voltage reference steps and compare rise time, overshoot and settling with the EMT and positive-sequence models.
5. Capacitor bank interlocks. Verify blocking during simulated disturbances and fast tripping on inverter trip or overvoltage.
6. Baseline recording. Capture a high-resolution baseline with the PRC-028-1 recorders for later comparison.
20.3 Monitoring with PRC-028-1 data
PRC-028-1 requires fault recording at high sampling rates and dynamic disturbance recording at the main power transformer, with time synchronization, at IBRs. For post-fault overvoltage, those records are the only reliable way to see:
the instantaneous voltage peaks after clearing at the MPT high side and collector feeders;
the reactive current flowing at the instant of clearing and its release rate;
which inverters tripped and on which element, when combined with inverter sequence-of-events logs; and
whether capacitor banks were in service.
Because PRC-028-1 data need be retrievable for only a limited period, plants should export and preserve records automatically for any event that produces a fault ride-through mode entry, not only for events that cause a trip. Near-misses, where the plant rode through but terminals came within a few percent of a protection pickup, are the best early warning available.
How Keentel Engineering helps here: Keentel writes commissioning test plans for IBR plants in weak areas that include settings audits, PPC freeze and anti-windup tests, latency measurement and model comparison, and we witness factory, HIL and site tests. After commissioning, we review disturbance recordings against the validated models so that owners see near-misses before they become trips.
21. NERC compliance, event analysis and planning
21.1 PRC-029-1: ride-through
PRC-029-1 requires applicable IBRs to ride through voltage and frequency excursions within the criteria in its attachments, and it provides for documentation of equipment limitations for existing plants under defined conditions. For the LVRT-to-HVRT problem, PRC-029-1 matters in two ways:
a trip on post-fault overvoltage inside a mandatory ride-through region is a performance failure, whether or not the plant rode through the preceding dip; and
the documentation the Generator Owner keeps on settings, equipment capability and any limitations must explain how the plant will behave after clearing, not only during the fault.
Owners should confirm against the approved standard and their Regional Entity's guidance how voltage is measured for PRC-029-1 purposes, how consecutive excursions are treated and how exemptions are documented.
21.2 PRC-030-1: unexpected output changes
PRC-030-1 requires Generator Owners to identify qualifying changes in IBR real power output (a complete loss, or at least 20 MW and at least 10% of gross nameplate within four seconds, subject to defined exclusions), analyze each within 90 days, and develop and implement corrective action plans. A post-fault overvoltage trip of part of a plant is exactly the kind of event PRC-030-1 is designed to catch.
The R2 analysis must determine root cause, document ride-through and reactive power performance, decide whether corrective action is needed and assess whether the same root cause applies at the owner's other IBRs. For an LVRT-to-HVRT event, a defensible analysis shows:
the fault, its clearing and the POI voltage profile, from relay and recorder data;
the reactive current at clearing and its release, from recorder and inverter data;
PPC state through the event, from PPC logs;
the inverter terminal voltage, calculated or measured, at the tripped units;
the protective element that operated and its setting; and
the contribution of shunt devices, grounding and neighboring plants.
Keentel's companion guide on PRC-030-1 covers the procedural requirements in detail.
21.3 MOD-026-2: model verification
MOD-026-2 requires verification that the models of generator control systems, including IBR plant controllers and the inverter controls that the models represent, match actual behavior. The post-fault parameters in Section 15, especially reactive current hold times, active power recovery rates and plant controller freeze thresholds, are the parameters most likely to be wrong in a model and most likely to matter in a weak grid. Verification should include them explicitly, using disturbance recordings where staged tests cannot exercise them.
21.4 TPL-001-5.1: planning studies
Transmission Planners must study the system's performance for planning events, including the behavior of IBRs. Planning models that do not represent post-fault tripping will overstate the system's performance. Where EMT studies show that a plant trips after clearing under certain conditions, the planner needs that information, either as model changes or as documented limitations, so that TPL-001-5.1 assessments reflect reality. Conversely, mitigation that prevents post-fault tripping should be reflected in the models so that planners do not impose unnecessary constraints.
21.5 FAC-002 and interconnection studies
Under FAC-002 and FERC Order No. 2023 procedures, interconnection studies are increasingly where post-fault overvoltage is first identified. Transmission providers in weak areas now commonly require EMT studies with vendor models, weak-grid screening and specific ride-through demonstrations before an interconnection agreement is executed. Identifying the problem at that stage, and fixing it with settings, is far cheaper than discovering it during the first summer of operation.
| Standard or order | Relevance to post-fault overvoltage | Typical evidence |
|---|---|---|
| PRC-029-1 | Ride-through of post-fault HV excursions | Settings, envelope coordination, limitation documentation |
| PRC-024-4 | Synchronous condensers and synchronous units at the POI | Protection settings within no-trip zones |
| PRC-028-1 | Data to prove what happened | Fault and dynamic disturbance records |
| PRC-030-1 | Analysis and correction of trips | R2 analyses, CAPs, fleet reviews |
| MOD-026-2 | Correct models of recovery logic | Verification reports with post-fault parameters |
| MOD-032 | Data submittal to planners | Updated models and parameters |
| TPL-001-5.1 | System performance with realistic IBR behavior | Planning cases using verified models |
| FAC-002 | Interconnection studies | EMT and ride-through study reports |
| FERC Order No. 901 | Basis for the IBR standards program | Not directly evidenced; frames the obligations |
| FERC Order No. 2023 | Interconnection process and model requirements | Models with the interconnection request, updated at milestones |
How Keentel Engineering helps here: Keentel supports Generator Owners, Transmission Planners and transmission providers across PRC-029-1, PRC-030-1, MOD-026-2, MOD-032, TPL-001-5.1 and FAC-002. We perform root-cause analyses of post-fault trips within the 90-day window, write corrective action plans that fix the problem across the fleet, and update models and verification records so that compliance and engineering tell the same story.
22. Specifying a plant that will not trip after clearing
22.1 Specification checklist
Owners and EPC contractors can prevent most LVRT-to-HVRT problems by writing the right requirements into inverter, PPC and plant specifications before purchase. Keentel recommends that specifications require:
Ride-through envelopes at the RPA, with the inverter supplier confirming in writing that terminal-level protection will not trip inside them, given the plant's impedance and reactive operating range.
Post-fault reactive current release that is adjustable (hold time, ramp rate, voltage-dependent release) and can be set to release within about one cycle where studies require it.
High-voltage reactive response, symmetrical to the low-voltage response, with adjustable threshold and gain.
Negative-sequence current injection during unbalanced faults, consistent with IEEE 2800.
Overvoltage protection based on RMS or sequence quantities with time delays, coordinated with the HVRT envelope, plus a separately documented equipment-protection limit.
DC-link overvoltage management during and after faults, with documented thresholds.
PPC freeze, post-recovery hold, clamping and back-calculation anti-windup, with all parameters adjustable and reflected in RMS and EMT models.
Communication architecture and latency stated as a performance requirement for the PPC loop.
Capacitor bank and filter logic that blocks switching during disturbances and trips banks on inverter trips or sustained overvoltage.
Collector grounding that maintains effective grounding in all credible configurations, or arresters and inverter islanding detection rated for the alternative.
EMT and RMS models of the exact firmware and settings, with model quality reports and a commitment to update them after any change.
Test support: HIL testing of the PPC freeze and recovery logic, and access to inverter event logs and settings files for post-event analysis.
22.2 Twelve questions to ask about any IBR plant in a weak area
1. What is the weakest credible SCR and ESCR at the POI, including planned outages and future plants?
2. How much reactive current will the inverters be injecting at the instant of fault clearing for a nearby fault?
3. How long do the inverters hold fault-mode reactive current after recovery, and how fast do they ramp it down?
4. Is a high-voltage reactive response enabled, and at what threshold and gain?
5. Does the PPC freeze during faults, for how long after recovery, and does that cover the full measurement and communication delay?
6. Does the PPC have clamping and back-calculation anti-windup?
7. What is the highest inverter terminal voltage during a post-fault excursion, at the worst feeder end?
8. Which inverter overvoltage elements are peak-detected, and how do their settings compare with the transient overvoltage ride-through characteristic?
9. Which capacitor banks and filters will be in service, and what happens to them if inverters trip?
10. Is the collector effectively grounded in every configuration, and are arresters rated for the worst case?
11. Do the RMS and EMT models represent the field settings for all of the above, and when were they last verified?
12. What will the PRC-028-1 recorders capture if the plant trips after a fault, and is the data preserved automatically?
23. Key takeaways
1. A plant can pass LVRT and fail HVRT in the same event. The danger window is the first few hundred milliseconds after fault clearing.
2. The mechanism is simple. Residual reactive current times network reactance: ΔV ≈ Iq/SCR on the plant base.
3. Inverter terminals are the critical location. They sit several percent above the POI when the plant injects reactive power.
4. Controller windup and delay extend the problem. Freeze, hold and anti-windup logic must cover the full loop delay.
5. Shunt capacitance can turn a partial trip into a cascade. Trip or block capacitors when inverters trip.
6. Grounding governs unbalanced-fault overvoltage. Keep collectors effectively grounded and arresters rated for the worst configuration.
7. Most problems are fixed with settings. Fast reactive release, high-voltage absorption and PPC freeze logic reduced sustained overshoot by more than an order of magnitude in Keentel's model.
8. Only EMT studies with real control code can prove a plant will not trip. Generic positive-sequence models cannot see the first cycle after clearing.
9. Compliance follows engineering. PRC-029-1, PRC-030-1, MOD-026-2 and TPL-001-5.1 all depend on models and settings that represent post-fault behavior correctly.
10. Validate the inverters, the PPC and the network together. The problem lives in their interaction, not in any one of them.
Part C —Case Studies
Case Study 1 — West Texas 345 kV wind and solar hub: the trips nobody could see in the planning model
Situation. A 300 MW solar plant shares a 345 kV switching station in West Texas with a 250 MW wind plant and is electrically close to two other solar projects. The area's weighted short-circuit ratio under credible outage conditions is about 1.6. Over its first year, the solar plant rode through every recorded transmission fault in the positive-sequence sense: POI voltage recovered and output returned within about a second. But after three of those faults, between 40 and 70 MW of inverters went offline and restarted five minutes later. Each event was large enough to qualify under PRC-030-1, and the owner faced three analyses in parallel.
Analysis. Keentel aligned the POI relay records, the plant's dynamic disturbance recorder data, PPC logs and inverter sequence-of-events logs to a common time base. The pattern was the same in all three events. Every tripped inverter logged a fast AC overvoltage code within 20 to 40 ms of fault clearing, and every tripped inverter sat on one of the three longest 34.5 kV feeders. The POI voltage peaked at 1.14 to 1.18 pu for less than 50 ms, inside the transmission provider's high-voltage envelope. The inverters, however, held their fault-mode reactive current for a fixed 100 ms after voltage recovered above 0.9 pu, as their default settings specified. An EMT model of the plant with the supplier's control code, benchmarked against the recordings, reproduced terminal voltages of about 1.22 to 1.24 pu at the feeder ends, against a fast overvoltage element set at 1.20 pu with a two-cycle delay. The wind plant's post-fault reactive injection, released at about the same time, added roughly 0.02 pu at the POI.
The positive-sequence planning model showed no trip, for two reasons: its reactive current hold time parameter had been left at zero, and it represented the plant as a single aggregated inverter at the collector bus, with no feeder-end voltage spread.
Engineered solution. Keentel worked with the inverter supplier to:
replace the fixed 100 ms hold with voltage-dependent release, so that reactive current follows measured voltage within about one cycle once voltage exceeds 0.95 pu;
enable high-voltage reactive absorption above 1.10 pu with a gain of 2;
move the fast overvoltage element to a positive-sequence RMS basis at 1.25 pu with a delay coordinated with the transmission provider's envelope, while keeping the supplier's equipment-protection limit at its original, higher, peak-based value; and
verify, across SCRs from 1.4 to 4 and all fault types, that the new release did not cause a voltage sag or repeated fault-mode entry.
The PPC's freeze logic was extended from fault duration only to fault duration plus 400 ms, covering its measured 280 ms loop delay. The positive-sequence model was re-parameterized with the correct hold time and a two-feeder equivalent preserving the highest terminal voltage, and the MOD-026-2 verification record was updated. Keentel also shared the findings, with the owner's consent, with the wind plant's owner and the transmission provider, because the wind plant's release timing contributed.
Outcome. The settings were deployed fleet-wide to the owner's two other plants with the same inverter platform, which the PRC-030-1 extent-of-condition review had flagged. In the next two transmission faults of similar severity, the solar plant rode through with no inverter trips, and the recorded terminal voltages matched the EMT predictions to within 0.02 pu. All three PRC-030-1 analyses were completed within the 90-day window, with a single corrective action plan covering all three plants.
Case Study 2 — Southwest 230 kV solar plant: the controller that kept pushing
Situation. A 250 MW solar plant in the desert Southwest is connected at 230 kV at the end of a 90-mile line, with an SCR of about 2.2 system-intact and about 1.7 with a parallel 230 kV line out for maintenance. During a maintenance outage, a fault on a nearby 230 kV line was cleared in its zone 2 time of about 20 cycles because of a communication problem in the pilot scheme. The plant rode through the long dip. After clearing, the POI voltage rose to about 1.12 pu and stayed above 1.10 pu for almost 2 s before falling, overshooting to about 0.93 pu, and recovering. Several inverters tripped on a time-delayed overvoltage element set at 1.10 pu for 1.5 s, and the transmission operator asked the owner for an explanation.
Analysis. The PPC regulated POI voltage with a PI controller and droop. Its voltage measurement came from a revenue-class meter through a protocol gateway with an average delay of about 300 ms, plus a 200 ms filter. Its freeze logic used a voltage threshold of 0.80 pu. During the long fault, the POI voltage was about 0.85 pu, so the PPC never froze. It integrated a 0.15 pu error for about 0.33 s of fault plus another 0.5 s of delayed measurement after clearing. Keentel's reconstruction showed the integrator reaching a reactive command about 0.4 pu above the pre-fault value, which the PPC then distributed to the inverters as the fault-mode exit completed. At SCR 1.7, that command raised the POI by about 0.2 pu before the controller's own feedback, slowed by the same delay, pulled it back, and then overshot in the other direction.
Two further findings mattered. The time-delayed overvoltage element at 1.10 pu for 1.5 s sat inside the transmission provider's requirement to ride through for much longer between 1.05 and 1.10 pu and for about 1 s between 1.10 and 1.20 pu at the RPA, and the inverter terminals ran about 0.04 pu above the POI. And the PPC's planning model had a freeze threshold of 0.90 pu, not the 0.80 pu configured in the field, so the model had predicted correct behavior.
Engineered solution. Keentel recommended, and the PPC supplier implemented:
freeze on any of three conditions: POI voltage below 0.92 pu or above 1.08 pu, any inverter reporting fault ride-through mode, or a fault flag from the POI relay over a hardwired input;
a post-recovery hold of 0.8 s, longer than the measured total loop delay;
an integrator clamp at the plant's reactive capability and back-calculation anti-windup;
a direct, lower-latency voltage measurement for the control loop from a dedicated transducer, reducing measurement delay from about 500 ms to about 100 ms; and
gain scheduling with a lower integral gain when the transmission operator's breaker status shows the parallel line out.
The inverter time-delayed overvoltage element was moved, with manufacturer approval, to settings coordinated with the applicable envelope after accounting for the terminal-to-POI offset. The planning model's freeze threshold was corrected to match the field, and the MOD-026-2 verification included a staged PPC test with simulated dips injected at the controller input.
Outcome. HIL tests reproduced the original event and showed the new logic limiting post-fault overshoot to about 1.04 pu with no oscillation. Six months later, a similar delayed-clearing event occurred during another maintenance outage; the plant rode through, with a POI overshoot of 1.05 pu settling in under 1 s.
Case Study 3 — Midwest 138 kV battery storage plant: the capacitor bank that outlasted the inverters
Situation. A 150 MW, 600 MWh battery storage plant in the Midwest is connected at 138 kV with an SCR of about 3.5. To meet the 0.95 power factor requirement at the POI while charging at full power, the original design added a 30 Mvar switched capacitor bank and a 5 Mvar harmonic filter on the 34.5 kV bus. At night, while charging at light load, a nearby single-line-to-ground fault was cleared normally. About a third of the plant's power conversion systems tripped on a DC-link fault code. The remaining units then tripped over the next half-second on AC overvoltage, and an arrester on one collector feeder failed.
Analysis. Keentel's analysis found a chain of four mechanisms:
1. DC-link transient. The power conversion systems were charging the battery at about 60% of rating. During the fault, their AC current was limited; at clearing, the sudden voltage recovery produced a DC-link voltage excursion that exceeded a DC overvoltage threshold on one hardware variant. Those units tripped.
2. Uncompensated capacitance. Before the fault, the inverters had been absorbing about 20 Mvar to offset the capacitor bank and filter, because the PPC's slow reactive control had switched the bank in during an earlier evening low-voltage period and never switched it out. When a third of the inverters tripped, their absorption disappeared, and the remaining inverters, still exiting fault mode, could not pick it up immediately. With about 700 MVA of short-circuit capacity at the 34.5 kV bus, the step was roughly 3% at the bus and more at the feeder ends.
3. Residual reactive injection. The remaining inverters held their fault-mode capacitive current for 150 ms after clearing, adding further rise.
4. Ground-fault overvoltage on an islanded feeder. One collector feeder breaker had opened on a sympathetic ground-fault trip. The inverters on that feeder continued to run for about 300 ms before detecting the island. The feeder had no zero-sequence source with its breaker open, and its arresters, rated 22 kV MCOV for an effectively grounded system, saw unfaulted-phase voltages approaching line-to-line voltage.
Engineered solution. The corrective action plan included:
a firmware update on the affected hardware variant, with DC-link chopper settings verified in EMT;
capacitor bank logic changed so that the bank is used only when the inverters' reactive range is exhausted, is blocked from switching during and for 30 s after any voltage disturbance, and trips within 100 ms if more than 20% of inverters trip or if 34.5 kV bus voltage exceeds 1.08 pu for 200 ms;
removal of the post-fault reactive current hold, replaced by voltage-dependent release, and enabling high-voltage reactive absorption;
correction of the feeder ground-fault relay settings to eliminate the sympathetic trip;
faster islanding detection and cessation for collector feeder islands; and
replacement of collector arresters with 29 kV MCOV units on feeders where islanding cannot be ruled out within the arresters' TOV capability, after a grounding study confirmed the TOV levels.
Outcome. The plant returned to service with updated models and settings. The owner's PRC-030-1 analysis identified two sister plants with the same capacitor bank logic, and the logic change was applied to all three. Over the following year, the plant rode through eleven recorded faults, including two at night while charging, without a trip.