A Coordinated Electric System Interconnection Review—the utility’s deep-dive on technical and cost impacts of your project.
Challenge: Frequent false tripping using conventional electromechanical relays
Solution: SEL-487E integration with multi-terminal differential protection and dynamic inrush restraint
Result: 90% reduction in false trips, saving over $250,000 in downtime
The three operating regions you have to design to
| Device | Output vs voltage | Response | Best suited to | Main limitations |
|---|---|---|---|---|
| Mechanically switched capacitor or reactor | Proportional to voltage squared | Seconds; discrete steps; limited switching operations per day | Steady-state reactive supply, voltage profile, loss reduction | No dynamic capability; step voltage change on switching; capability collapses when most needed |
| Static var compensator | Capacitive branches proportional to voltage squared | A few cycles; continuously controllable | Continuous control where cost matters and deep voltage support is not the driver | Square-law capability loss; harmonic filters are part of the plant and interact with the network |
| STATCOM | Approximately proportional to voltage — constant current capability | One to two cycles closed loop; converter response faster still | Voltage stability margin, weak interconnections, fast disturbance recovery, flicker and unbalance compensation | Higher capital cost; converter losses; adds a converter and its control dynamics to the network |
| Synchronous condenser | Governed by machine capability and excitation | Excitation response in the hundreds of milliseconds; inherent inertial response instantaneous | System strength and inertia, short-circuit contribution, black start support | Rotating plant with maintenance and losses; slower controlled response than a converter |
| STATCOM with energy storage | Reactive as a STATCOM, plus real power within the storage rating | As STATCOM for reactive; real power limited by storage | Where a real power deficiency is part of the problem | Cost and complexity of the storage; different failure and maintenance profile |
| Service area | What we do for SST campuses | Typical deliverables |
|---|---|---|
| Grid interconnection | Site screening, large-load applications, independent studies, utility and RTO coordination in ERCOT, NYISO, PJM and other markets | Screening reports, application data packages, load flow, contingency and stability studies, study review memos |
| EMT modeling | Model requirements, vendor model review, campus aggregation, ride-through, weak-grid, control interaction and load-oscillation studies | EMT model specifications, model acceptance reports, PSCAD study reports, SCR screening |
| MV/MVDC system studies | AC and DC short-circuit, DC protection philosophy, AC protection, arc flash, grounding, insulation coordination | Study reports, protection philosophy documents, settings files, arc flash labels, interface control documents |
| Power quality | Emission requirements, frequency scans, IEEE 519-2022 compliance, filter sizing, flicker assessment | Harmonic study reports, filter specifications, monitoring plans |
| Substation and transmission design | HV/EHV substations, MV collectors, transmission lines, utility interface protection | Physical and electrical drawing packages, specifications, bills of material, protection and control design |
| NERC compliance | Registration and applicability, ride-through requirements, model validation, monitoring, compliance programs | Applicability assessments, compliance programs, evidence packages, model validation reports |
| Owner's engineer and QA/QC | SST, storage and substation specifications, design reviews, FAT and SAT plans and witnessing, multi-unit QA | Specifications, review comments, test plans, witness reports, due diligence reports |
| Onsite generation and BESS | Role definition and sizing, DC bus control architecture, fire and code compliance coordination, performance testing | Sizing studies, control architecture documents, specifications, test procedures |
Storage and generation
| Term | Meaning |
|---|---|
| AFE | Active front end. The actively switched AC/DC stage of an SST that connects to the MV grid and sets its grid behavior. |
| Aggregated model | A model in which many converters are represented by a smaller number of equivalent converters to make campus-scale simulation practical. |
| Arc flash | The release of energy from an electric arc fault, assessed as incident energy at a working distance to set PPE and safe work practices. |
| BESS | Battery energy storage system. |
| Blocking | Turning off all converter switches so the converter stops feeding current, used to limit DC faults. |
| Composite load model | A positive-sequence load model that combines several load types, such as motors, electronics and static loads. |
| DAB | Dual active bridge. An isolated DC/DC converter topology with active bridges on both sides of a high-frequency transformer. |
| DC-link | The internal DC capacitor bank between converter stages. |
| EMT | Electromagnetic transient simulation. Time-domain simulation with microsecond time steps, used to study fast converter and network behavior. |
| FAT | Factory acceptance test. |
| Grid-forming | A converter control mode that sets its own voltage and frequency reference rather than following the grid's, providing support to weak grids. |
| HIL | Hardware-in-the-loop testing, in which a real controller is tested against a real-time simulation. |
| IBR | Inverter-based resource. Generation or storage connected to the grid through power electronics. |
| Insulation coordination | Matching the insulation strength of equipment to the voltage stresses the system produces, with surge protection where needed. |
| ISC/IL | The ratio of available short-circuit current to maximum demand load current at the point of common coupling, used to set IEEE 519 limits. |
| ISOP | Input-series, output-parallel. A modular converter arrangement that shares a high input voltage across cells in series and combines their outputs in parallel. |
| Large load | A load large enough to affect transmission system reliability. Definitions vary, for example 75 MW and above under Texas SB 6, or loads above 20 MW in the federal rulemaking proposal. |
| LVDC | Low-voltage DC, such as 800 VDC or ±400 VDC rack distribution. |
| MFT | Medium-frequency transformer. The compact isolation transformer inside an SST, operating at kilohertz frequencies. |
| MMC | Modular multilevel converter. A converter built from many submodules with their own capacitors, producing a stepped multilevel waveform. |
| MVDC | Medium-voltage DC distribution, roughly 1 kV to 35 kV DC in common usage. |
| OE | Owner's engineer. An independent engineer representing the owner's technical interests. |
| PCC / POI | Point of common coupling / point of interconnection, where the campus connects to the utility system and where compliance is usually assessed. |
| PLL | Phase-locked loop. The control element that tracks grid voltage phase and frequency. |
| Positive-sequence model | A fundamental-frequency, balanced dynamic model used in PSS®E, PSLF and similar tools. |
| Ride-through | The ability to stay connected and keep operating during and after a grid disturbance within defined limits. |
| SAT | Site acceptance test. |
| SCR | Short-circuit ratio. Available short-circuit power divided by converter rating, a measure of grid strength. |
| SiC | Silicon carbide, a wide-bandgap semiconductor material that allows higher voltage, higher frequency switching. |
| SST | Solid-state transformer. A power electronic converter with a high-frequency isolation stage that replaces a 60 Hz transformer and rectifier chain. |
| Supraharmonics | Emissions in the 2 kHz to 150 kHz range, above the range covered by most harmonic limits. |
| TDD | Total demand distortion. Harmonic current distortion relative to maximum demand current, used in IEEE 519. |
| WSCR | Weighted short-circuit ratio. An SCR screen that accounts for several inverter-based plants sharing a network area. |
Links were current at publication (November 2026). Large-load rules, NERC actions and standards editions are changing quickly, so confirm current versions before relying on them.
Large-load reliability and NERC
- NERC Publishes Incident Review and Guidance on Voltage-Sensitive Large Load Integration, NERC
- Reliability Insights: Large Computational Load Risks Due to Voltage Sensitivity, NERC, September 2026
- NERC Seeks to Address Reliability Impacts from Large Load Integration, NERC presentation to FERC, April 2025
- NERC issues Level 3 Alert to address immediate risks data center loads pose to the grid, Renewable Energy World, May 2026
- NERC Voltage-Sensitive Loads, Keentel Engineering
Federal and state large-load rules
- FERC Docket RM26-4, Interconnection of Large Loads, FERC
- FERC Establishes Proceeding to Consider DOE Directive on Large Load Transmission Interconnection Rulemaking, McGuireWoods, October 2025
- Texas Senate Bill 6 Ushers in Major Overhaul of Large Load Interconnection and Grid Access Rules, Bracewell, July 2025
- Public Utility Commission of Texas Issues Proposed Rules for Large Load Interconnections, Foley & Lardner, March 2026
Solid-state transformers and DC data center power
- Solid State Transformer project, Open Compute Project
- Novel Solid-State Transformer Supports 800-V DC Power in AI Data Centers, Electronic Design
- How SSTs are Reshaping Data Center Infrastructure, Microchip Technology
Standards referenced (consult the publisher for the current edition)
Step 5 — options. Replacing or retrofitting the drives with active-front-end or 18-pulse units at about 5% THDi gives a TDD of about 1.5%. An active harmonic filter sized for the 5th and 7th could achieve a similar result at the facility level. A passive 5th-harmonic tuned filter would also work but must be checked for resonance with the utility system and with any future capacitors.
What this means for you.
The same drives can be compliant on a strong system and non-compliant on a weak one. Ask your utility for the maximum short-circuit current at the PCC early in design. If the ratio is below 50, plan for low-harmonic drives or filtering from the start; it is much cheaper than retrofitting.
9. Inverter-based resources: solar, storage and wind
Solar PV, battery energy storage and full-converter wind turbines use pulse-width-modulated inverters with output filters. They are generally low-distortion sources. IEEE Std 1547-2018 (distribution-connected resources) and IEEE Std 2800-2022 (transmission-connected resources) limit their current distortion — total rated-current distortion (TRD) of 5% with individual limits by order, measured against rated current rather than present output. In practice, quality inverters measure 1–3% at rated output.
Three cautions apply:
- Percentages rise at low output. At 10% of rated output a 2% distortion (of rated current) looks like 20% THD. Limits referenced to rated current, like TDD, avoid this trap.
- Inverters change the system's impedance. Plant collector cables, inverter output filters and capacitor banks add capacitance. They can create resonances near the 5th to 13th harmonics on the 34.5 kV collector or at a 138 kV, 230 kV or 345 kV point of interconnection, amplifying background distortion that the plant did not create.
- Background distortion matters. Inverters can absorb or amplify existing voltage distortion depending on their control design. Utilities increasingly require harmonic impedance studies for new plants, sometimes using electromagnetic transient (EMT) simulation.
Keentel's articles on harmonic resonance and on
weak-grid inverter stability cover these interactions in depth.
10. Data centers and other electronic facilities
Data centers are a special case because almost all their load is electronic. Points to check:
- UPS rectifiers. Double-conversion UPS units with IGBT rectifiers typically draw less than 5% THDi at rated load, rising at low load. Older six-pulse or 12-pulse thyristor UPS rectifiers may need input filters.
- Server and network power supplies. Modern units with active power factor correction have low 3rd harmonic. Legacy equipment does not. Measure a representative panel rather than assuming.
- 208Y/120 V and 415Y/240 V distribution. Check neutral current and transformer K-factor as in Sections 4 and 7.
- Generator operation. Test UPS and generator compatibility at the actual load level. Generator THDv can be three to four times the utility THDv for the same load.
- Cooling plant. Chiller, pump, fan and cooling distribution unit drives often contribute more low-order harmonics than the IT load. Specify low-harmonic drives where the facility is large relative to the utility source.
- Large-load interconnection. Utilities and grid operators now treat large data centers as high-impact loads. Harmonic studies and power quality monitoring are increasingly part of interconnection requirements, alongside ride-through and dynamic studies.
11. How a harmonic study is done
A harmonic study answers four questions: How much harmonic current will the facility inject? What voltage distortion will it cause? Will any resonance amplify it? What is the cheapest reliable fix? Keentel's typical workflow:
- Gather data. Single-line diagram; utility short-circuit data (maximum and minimum) at the PCC; utility background distortion if known; transformer impedances; cable lengths; capacitor banks and filters; drive, UPS and inverter data sheets with harmonic spectra.
- Measure existing conditions. For existing facilities, install class-compliant power quality meters at the PCC and key buses for at least one week, capturing 10-minute and 3-second data up to the 50th harmonic.
- Build the model. Represent sources as harmonic current injections and the network as frequency-dependent impedances, including transformer phase shifts that can cancel 5th and 7th harmonics between delta-delta and delta-wye units.
- Run a frequency scan. Plot driving-point impedance versus frequency at each important bus to find resonances, for all credible system configurations (tie breakers open/closed, capacitor steps in/out, generator versus utility).
- Run harmonic load flow. Calculate harmonic currents and voltages and compare them with IEEE 519 at the PCC and with equipment limits (IEEE 18 for capacitors, C57.110 for transformers) inside the facility.
- Design mitigation. Compare options for performance, cost, losses, footprint and future flexibility.
- Verify. Measure again after installation and document compliance with the statistical criteria.
12. Fixing harmonics: options compared
800 VDC vs. 1,500 VDC for AI Data Center Power Distribution: Choosing the Right Voltage Class — A US Engineering Guide
November 12, 2026 | Blog
Part A — 800 VDC vs. 1,500 VDC at a Glance
AI training and inference clusters have pushed rack power far past anything the traditional data center was designed for. A few years ago, a 15 kW rack was considered dense. Today, accelerator racks are commonly specified from 100 kW to more than 200 kW, and industry roadmaps describe racks of 400 kW, 600 kW and eventually a megawatt or more. At these levels the familiar 480Y/277 V AC to 415 V or 208 V AC to 48/54 V DC chain starts to break down. The currents become enormous, the copper becomes heavy and expensive, the power shelves crowd the compute out of the rack, and every extra conversion stage adds heat that has to be removed by the same cooling plant that is already working hard to remove the heat of the chips.
The industry response has been to move the power distribution inside the data hall to high-voltage DC. Instead of carrying hundreds of amperes of 415 V AC to each rack, a central rectifier converts AC to DC once, and a DC busway carries power at several hundred to well over a thousand volts to a DC/DC converter at the rack. Two voltage classes dominate the conversation:
- 800 VDC: the class that industry rack roadmaps have converged on for the first generation of high-voltage DC AI racks. It can be built as a unipolar 0/800 V system or as a bipolar ±400 V system. Equipment is emerging from many suppliers, and it fits comfortably under the 1,000 V boundary that shapes most US electrical codes and product standards.
- 1,500 VDC: the class that solar photovoltaic (PV) and battery energy storage system (BESS) plants adopted over the past decade to cut balance-of-system cost. It halves the current again compared with 800 V and slashes conductor losses, but it sits right at the edge of the low-voltage DC rules, demands more insulation and clearance, and has a much thinner ecosystem of data-center-grade products.
The question every owner, developer and design engineer is now asking is simple to state and hard to answer: which voltage class should we build? This guide is Keentel Engineering's full-depth answer. It works through the physics, the conductor sizing, the conversion efficiency, the grounding, the insulation, the fault and arc-flash behavior, the code and listing landscape, the utility interconnection, the reliability, the cost and the timeline. It closes with a decision matrix, a design checklist, three short anonymous scenarios and 30 detailed FAQs.
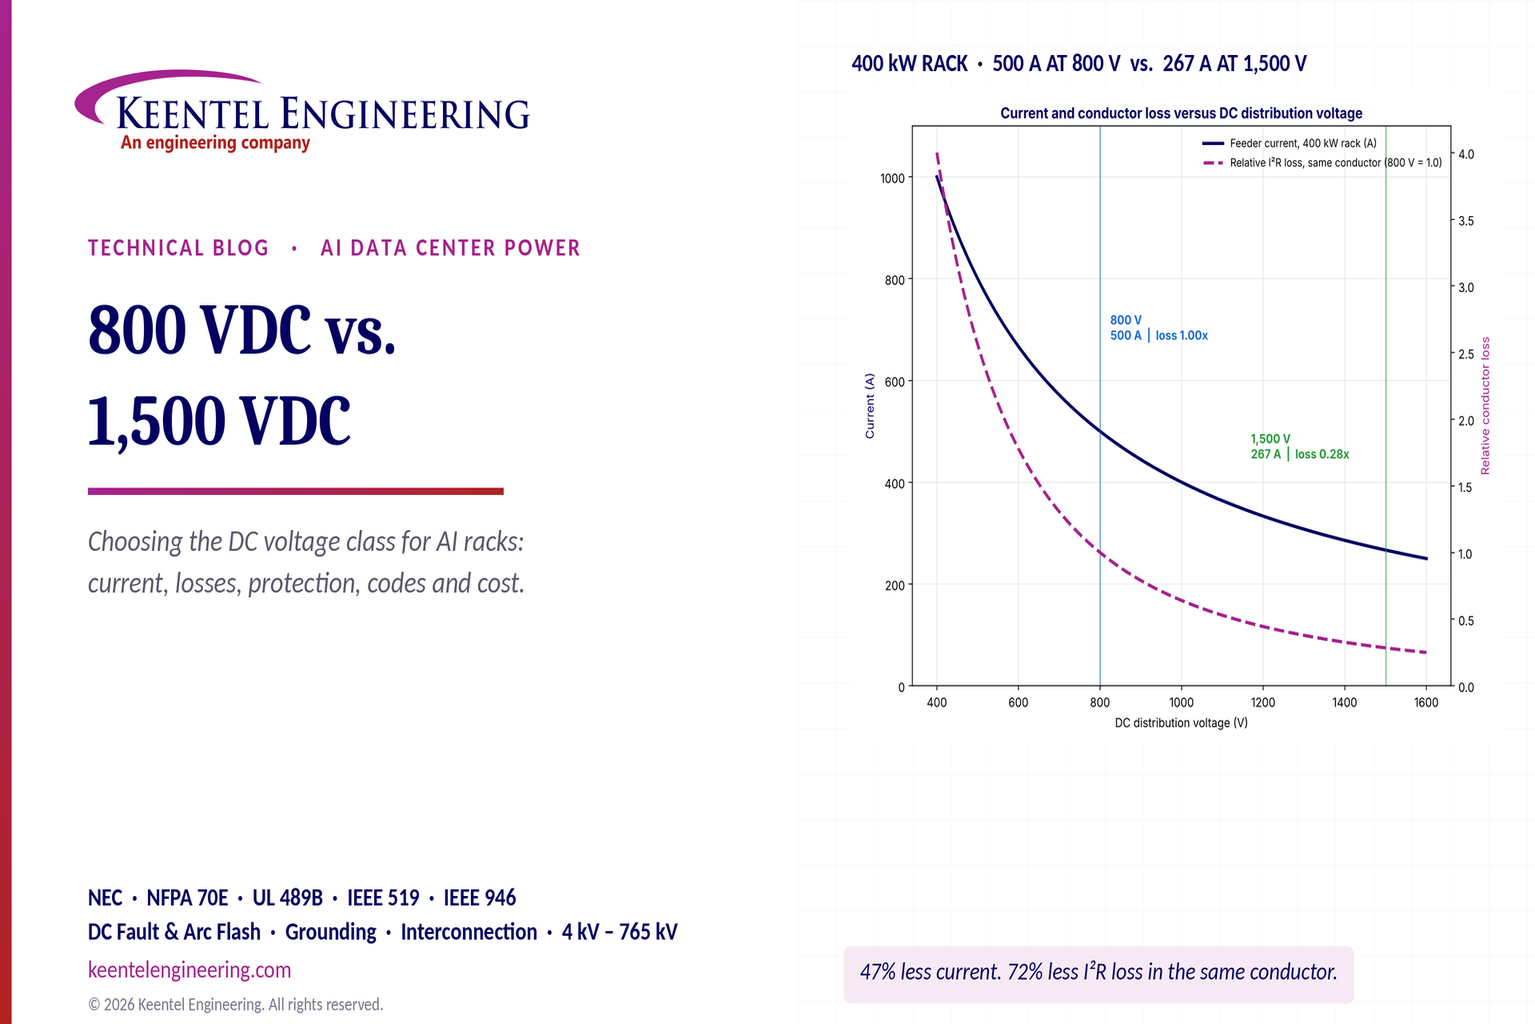
In plain terms: raising the DC voltage from 800 V to 1,500 V cuts the current by about 47% and the conductor heating by about 72% for the same cable. That is real, but conductor loss is only a small part of the total loss between the utility and the chip. Most of the loss is in the conversion stages, and a 1,500 V system can lose more in its rack converters than it saves in its cables. The right answer depends on distances, rack power, equipment availability, code readiness and how the system is grounded and protected.
This guide focuses on the voltage-class decision itself. Keentel Engineering has published companion articles that go deeper on related topics: 800 VDC rack fault protection, 800 VDC UPS and energy storage architectures, 800 VDC power for chillers, CDUs and racks, the low-voltage DC data center framework, how a 1 GW data center is put together, and data center rack engineering. Where those articles cover a topic in detail, this one summarizes and refers to them rather than repeating them.
Who this guide is for
This guide is written for the people who have to make, defend or implement the voltage-class decision:
- Owners and developers who need to understand the trade-offs well enough to set priorities, approve a design basis and explain the choice to investors and lenders.
- Design engineers who need the equations, worked examples and checklists to size conductors, model efficiency, design grounding and protection and prepare code compliance documentation.
- Operations and facilities teams who will maintain the system and need to understand the safety, training and procedural implications of each voltage class.
- Utility and transmission planners who want to understand how high-voltage DC data center designs affect the large-load behavior they see at the point of interconnection.
- Inspectors and AHJs who are being asked to approve DC distribution systems that are new to the data center environment.
Each section of Part B ends with a short note on how Keentel Engineering supports that part of the work. Part C gives three short anonymous scenarios, and Part D answers 30 of the most common questions in detail.
How to read the numbers
The worked examples in this guide use round, illustrative values: copper resistivity at 75°C, a busway current density of 1.6 A/mm², converter efficiencies typical of current technology and an energy price of $0.07/kWh. They are chosen to show how the comparison works, not to predict the result for any particular project. Change the distances, the efficiencies or the energy price and the conclusion may change, which is exactly the point. A voltage-class decision should always be made with project-specific data, real product test results and the code edition adopted where the facility will be built.
How data center power got here
It helps to see the 800 V versus 1,500 V debate as the latest step in a long trend of pushing voltage closer to the load.
- Early enterprise data centers distributed 208Y/120 V AC to racks of a few kilowatts, with double-conversion UPS systems and server power supplies converting to 12 V DC inside each server.
- Higher-density facilities moved to 415Y/240 V AC distribution in North America, removing a transformer stage and raising rack power to the tens of kilowatts.
- Hyperscale designs introduced rack-level power shelves converting AC to a 12 V and later 48 V DC rack bus, with battery backup units in the rack. The 48–54 V rack bus cut current inside the rack by a factor of four compared with 12 V.
- 380–400 V DC distribution was trialed and deployed in some data centers and telecom sites from the late 2000s, showing that DC distribution in buildings is practical, but it remained a niche because the AC ecosystem kept improving.
- AI accelerator racks of 100 kW and more pushed the 54 V rack bus to thousands of amperes and filled racks with power shelves. The response, laid out in industry 800 VDC rack roadmaps, is to bring high-voltage DC to the rack and convert to 54 V or lower only at the point of use.
- The next step being discussed is whether 800 V is enough for racks approaching a megawatt and halls of hundreds of megawatts, or whether 1,500 V, MV-fed solid-state transformers or MV DC will be needed.
Each step raised the distribution voltage, cut current and removed conversion stages. Each step also ran into the same constraints: equipment availability, codes and listings, safety and protection, and workforce readiness. The 800 V versus 1,500 V decision is the same pattern again.
Key terms used in this guide
- AFE (active front end): a PWM-controlled rectifier that draws near-sinusoidal current and regulates its DC output voltage. It acts as a boost converter, so its DC output must exceed the AC peak.
- AHJ (authority having jurisdiction): the organization or official responsible for enforcing the code and approving equipment and installations.
- Bipolar DC system: a DC system with positive and negative poles and a midpoint, such as ±400 V or ±750 V.
- Busway: a prefabricated enclosed busbar system, often with plug-in tap-off units to feed racks along a row.
- Clearance and creepage: the shortest distance through air and along an insulating surface, respectively, between conductive parts.
- Constant-power load: a regulated converter that draws more current when its input voltage falls, presenting a negative incremental input impedance.
- DC/DC converter (rack converter, power shelf): the converter that steps the high-voltage DC bus down to the rack or board voltage.
- ESWC (electrically safe work condition): the NFPA 70E state in which equipment has been isolated, locked out, tested for absence of voltage and, where needed, grounded.
- HRG (high-resistance grounding): grounding through a resistor that limits ground-fault current to a few amperes.
- IMD (insulation monitoring device): a device that continuously measures insulation resistance between an ungrounded or high-resistance grounded system and ground.
- L/R time constant: the ratio of circuit inductance to resistance, which governs how fast DC fault current rises and how hard it is to interrupt.
- Maximum system voltage: the highest voltage the system can reach in service, including regulation tolerance, battery float and other conditions; the value that equipment ratings and code thresholds apply to.
- NRTL (nationally recognized testing laboratory): a laboratory recognized by OSHA to test and certify products to US safety standards.
- PCC (point of common coupling): the point at which harmonic limits under IEEE 519 are evaluated, usually where the facility connects to the utility.
- PD (partial discharge): a localized electrical discharge that only partly bridges insulation, eroding it over time.
- SiC (silicon carbide): a wide-bandgap semiconductor used in modern high-efficiency rectifiers and converters.
- SSCB (solid-state circuit breaker): a breaker that interrupts current with semiconductors rather than mechanical contacts.
- SST (solid-state transformer): a power-electronic converter that replaces a 60 Hz transformer and rectifier, converting MV AC to LV DC through a high-frequency isolation stage.
- Unipolar DC system: a two-wire DC system with one pole grounded or referenced near ground, such as 0/800 V.
The power path both architectures share
Both voltage classes can follow the same electrical path from the utility to the GPU:
Utility → MV switchgear → transformer → AC/DC rectifier → DC switchgear → DC busway → rack DC/DC converter → GPU servers
In US practice the utility side looks like this:
- Transmission service: large AI campuses take service at 138 kV, 230 kV or 345 kV through a customer-owned or utility-owned substation. Smaller sites take service at the distribution level.
- Medium-voltage (MV) distribution: the campus distributes at 13.8 kV or 34.5 kV through MV switchgear, ring buses or loop feeders.
- MV/LV transformation: unit-substation transformers step down to 480Y/277 V for the AC switchgear and mechanical loads, or to a dedicated secondary voltage chosen for the rectifier.
- Rectification: the AC/DC rectifier creates the high-voltage DC bus, either from 480 V AC or directly from a dedicated transformer secondary, and in future designs possibly directly from MV through a solid-state transformer (SST).
- DC distribution: DC switchgear, DC busway or cable carry power to the rows and racks.
- Rack conversion: a DC/DC converter in or beside each rack steps the bus down to the 48 V or 54 V rack bus, or in some roadmaps directly to 12 V or lower at the server board.
The high-voltage DC distribution boundary begins at the rectifier output and ends at the rack DC/DC converter input. Everything upstream is conventional 60 Hz AC power engineering. Everything downstream of the rack converter is low-voltage DC at levels that the GPU, memory and network electronics actually use.
How Keentel helps here: Keentel Engineering designs the full chain, from the 138–345 kV utility interconnection and MV distribution to the DC bus and rack interface. We develop one-line diagrams, define the AC/DC boundary and select the voltage class with documented trade-offs, so the owner sees the whole system rather than one piece of it.
Where the DC voltage boundary sits
The phrase "800 VDC" or "1,500 VDC" describes only one segment of the system: the DC bus between the rectifier and the rack converter. That segment typically spans 20 to 200 meters inside a data hall, and sometimes several hundred meters on a campus backbone. The rest of the chain, from the utility meter to the rectifier and from the rack converter to the chip, is the same or very similar for both voltage classes.
This matters because the debate is often framed as if the whole facility changes. It does not. The voltage class changes:
- The current, conductor size and loss in the DC segment.
- The rectifier design and how it is fed from the AC system.
- The rack converter design, including its semiconductor voltage class, topology and efficiency.
- The grounding, insulation, protection and safety rules that apply to the DC segment.
- The code articles, product standards and listings that apply to equipment on the DC segment.
- The qualifications and procedures for people who work on or near that segment.
It does not change the utility interconnection voltage, the MV distribution, the cooling plant or the chip. Engineers can make the voltage-class decision on its own merits once that boundary is clear.
The headline numbers
For a single 400 kW rack, Ohm's law gives the feeder current directly:
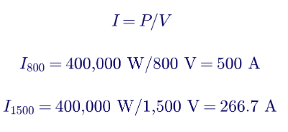
The current at 1,500 V is 53.3% of the current at 800 V, a reduction of about 47%. Because resistive loss in a conductor is I²R, the loss in the same conductor falls with the square of the current ratio:

So the same cable or busway carrying the same 400 kW loses about 72% less energy as heat at 1,500 V than at 800 V. For a 1 MW rack, the currents are 1,250 A at 800 V and 667 A at 1,500 V, and the same ratios apply.
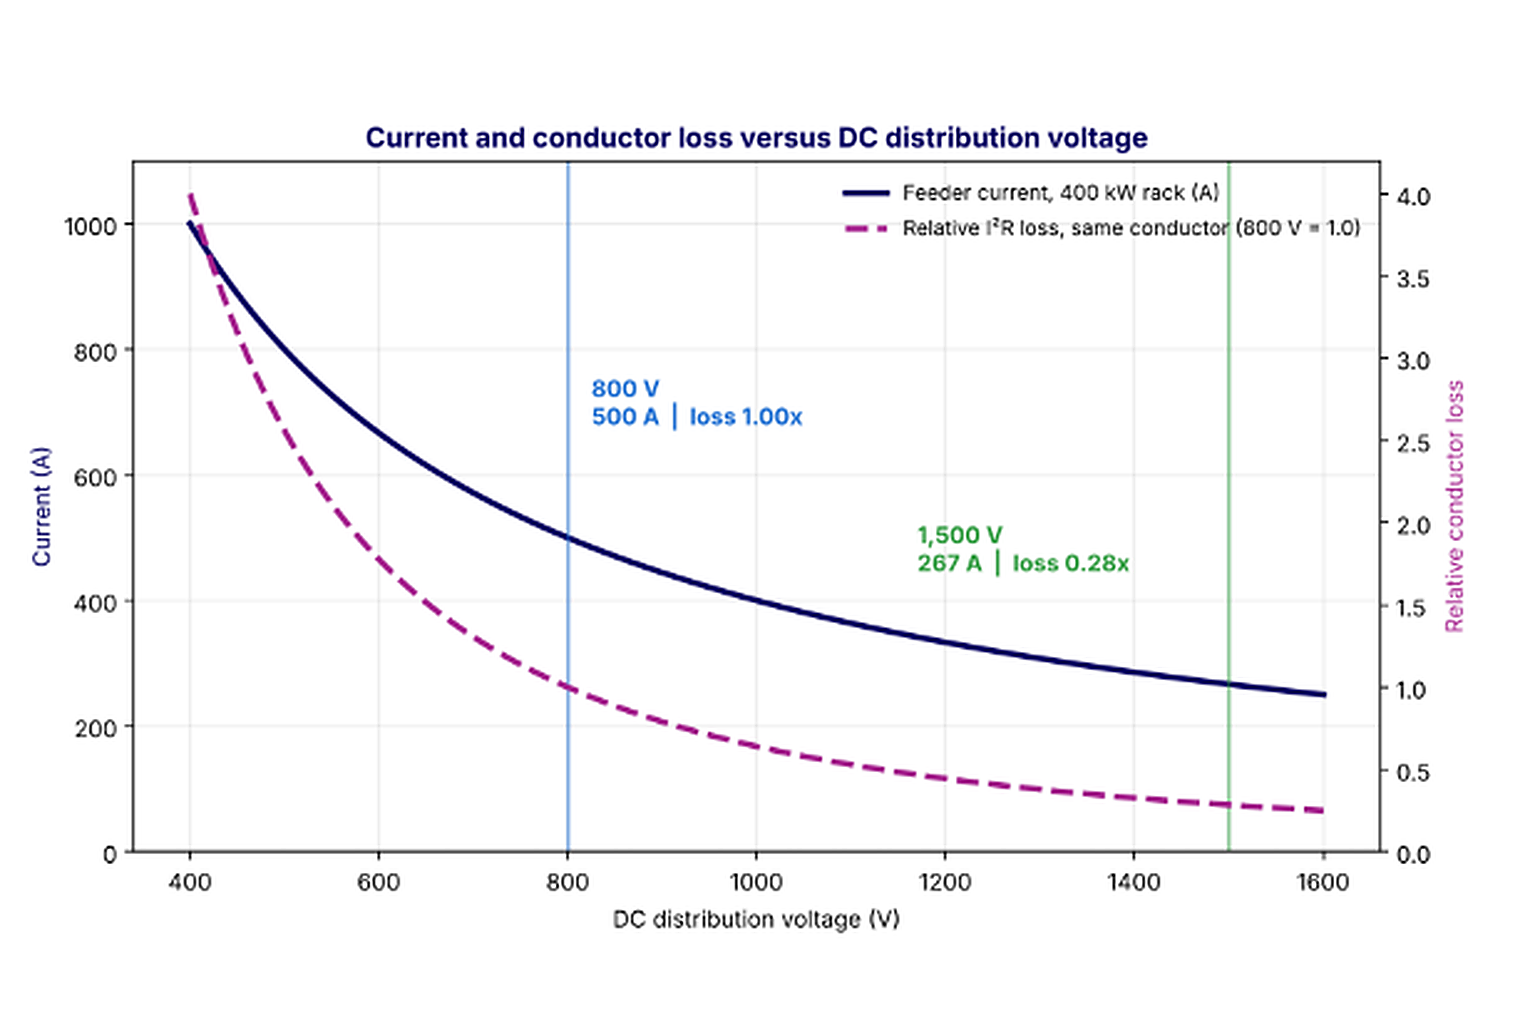
Figure 1. Feeder current and relative I²R loss versus DC distribution voltage for a 400 kW rack. Current falls as 1/V; conductor loss in a fixed conductor falls as 1/V².
These numbers are correct and they are the core of the case for 1,500 V. They are also the start of the analysis, not the end. The rest of this guide explains why.
The comparison, reviewed line by line
The table below summarizes the comparison that often circulates for these two voltage classes, together with Keentel Engineering's review of each line. The aim is not to criticize the comparison, which is a useful one-page summary, but to show where the engineering detail changes the conclusion.
| Comparison line | 800 VDC | 1,500 VDC | Keentel review |
|---|---|---|---|
| Distribution voltage | 800 VDC | 1,500 VDC | Correct. Note that "800 V" may be 0/800 V or ±400 V, and "1,500 V" may be 0/1,500 V or ±750 V. Voltage to ground differs by a factor of two between these options. |
| Current, 400 kW rack | 500 A | 267 A (about 47% lower) | Correct: 400,000/800 = 500 A and 400,000/1,500 = 266.7 A. |
| I²R loss, same cable | 1.00x | about 0.28x (about 72% lower) | Correct: (800/1,500)² = 0.284. |
| Conductor size, same loss | Baseline | about 50–60% smaller | Needs qualification. For equal loss the area can be about 72% smaller (ratio 0.284). In practice ampacity usually governs, and then the area is about 45–65% smaller. Busway sized on current density is about 47% smaller. |
| Distribution efficiency, typical | about 98.0–98.5% | about 98.5–99.0% | Illustrative. Cable or busway loss alone is normally well under 1–2% and depends entirely on length and conductor size. End-to-end efficiency is dominated by conversion stages. |
| System complexity | Lower | Higher (higher voltage, insulation) | Broadly correct. Complexity rises with insulation, clearances, DC interruption and safety boundaries. |
| Equipment and ecosystem maturity | Emerging (more suppliers) | Early adoption (fewer suppliers) | Correct for data-center-grade products. Note that 1,500 V has a mature ecosystem in PV and BESS, which helps at the rectifier and storage end but not at the rack end. |
| Applicable use | Near-term AI data centers (100–200+ kW per rack) | Large-scale AI and HPC (200–400+ kW per rack) | A reasonable starting framing. Distance and campus scale matter more than rack power alone. |
How Keentel helps here: We turn one-page comparisons into a project-specific study. Keentel Engineering models the actual distances, rack powers, converter efficiencies and protection schemes for your site and reports the trade-off in kilowatts, tons of copper, dollars and code requirements.
Correction 1: conductor size depends on what governs the design
The statement that conductors can be "about 50–60% smaller at the same loss" mixes two different design criteria.
If loss governs (the conductor is sized to hold losses or voltage drop to a target percentage), then the required resistance can rise in proportion to V²/P. At 1,500 V, the conductor can have 3.52 times the resistance for the same percentage loss, which means 28.4% of the cross-sectional area. That is a 72% reduction, more than the 50–60% quoted.
If ampacity governs (the conductor must carry the current without overheating, which is the usual case for short runs inside a data hall), the area scales with current raised to a power between about 1.25 and 1.6 for cables, because larger conductors dissipate heat less effectively per unit of area. A 47% reduction in current then gives an area that is about 54% to 63% smaller. For busbars and busways designed at a fixed current density, the area falls in direct proportion to current, so it is about 47% smaller.
So the 50–60% figure is a reasonable approximation for ampacity-governed cable, but it is not the "same loss" number. The distinction matters because it tells the designer which constraint is driving cost on a given run.
Correction 2: distribution efficiency is not system efficiency
A distribution efficiency of 98.0–98.5% for 800 V and 98.5–99.0% for 1,500 V implies distribution losses of 1.5–2.0% and 1.0–1.5%. Those values are possible for a long DC backbone, but they are high for a typical in-hall busway. A well-designed 50–100 m busway at 800 V typically loses well under 1% at full load, and less at partial load because loss scales with the square of current.
More importantly, distribution loss is only one term. The full chain from the MV bus to the 54 V rack bus includes a transformer (about 98.8–99.3% efficient), a rectifier (about 97.5–98.5%), the DC distribution (about 99–99.7%) and the rack DC/DC converter (about 97–98.5%). The conversion stages together lose four to five times more energy than the distribution. A design that saves 0.4% in the busway but loses 0.8% more in its rack converters is a net loss.
Correction 3: the rectifier input voltage matters
Diagrams often show both architectures rectifying from 480 V AC. That works naturally for 800 V and less naturally for 1,500 V:
- For 800 V: a three-phase active front end (AFE) rectifier needs a DC bus of at least the peak line-to-line voltage, √2 × 480 = 679 V, plus margin for a +10% high line, about 747 V. An 800 V bus fits that requirement well, which is one reason 800 V pairs so cleanly with 480 V AC infrastructure.
- For 1,500 V: a diode or thyristor bridge from 480 V gives only about 648 V of DC. An AFE is a boost converter and can in principle regulate a 1,500 V bus from 480 V, but that is a ratio of about 2.2 times the AC peak, which raises ripple current, switching stress and device voltage class compared with a better-matched input. The common approach, borrowed from PV and BESS practice, is a dedicated MV/LV transformer with a secondary chosen for the DC bus: roughly 600–690 V AC for an AFE (the range 1,500 V PV and BESS converters typically use) or roughly 1,100 V AC for a diode rectifier.
A 1,500 V system is therefore usually fed from its own transformer secondary rather than from the 480 V switchgear. That changes the transformer specification, the AC switchgear voltage class (and therefore the NEC articles that apply to it) and the protection design.
Correction 4: "same 48 V output" hides a harder rack converter
Both architectures can deliver the same 48 V or 54 V output to GPU servers, as the comparison correctly notes. But the rack DC/DC converter in a 1,500 V system has a step-down ratio of about 28:1 to 54 V, compared with about 15:1 for an 800 V system. The 800 V converter can use widely available 1,200 V silicon carbide (SiC) MOSFETs. The 1,500 V converter needs 2,000 V, 2,300 V or 3,300 V class devices, or a series-stacked or multilevel topology built from lower-voltage devices. Each of these choices tends to cost some efficiency, power density or cost at today's technology level.
Eight findings for decision makers
1. The physics is not in dispute. At the same power, 1,500 V carries 53% of the current of 800 V and loses 28% of the conductor heat in the same conductor.
2. The savings are proportional to distance. Over a 30 m row busway the conductor savings are small. Over a 300 m campus backbone they are large. Distance should drive the voltage-class decision at least as much as rack power.
3. Conversion efficiency dominates. Rectifier and rack converter efficiency, not cable loss, decide end-to-end efficiency. Ask for measured efficiency curves at 20%, 50% and 100% load for every converter in both options.
4. The 1,000 V line matters in the US. An 800 V system with ±400 V grounding keeps every conductor at 400 V or less to ground. A 1,500 V system moves into the 1.1–5 kV row of the NFPA 70E DC shock-approach table and sits at the very edge of the low-voltage DC thresholds in the current NEC.
5. DC protection is the hard part at either voltage. There is no current zero in DC. Breakers, fuses and solid-state devices must force current to zero against the system voltage, and the job is harder at 1,500 V.
6. Arc flash is not simply worse at 1,500 V. For the same power and the same per-unit source stiffness, maximum-power arc energy is similar. What changes is that arcs are much easier to sustain at 1,500 V, so mitigation must assume the arc will not self-extinguish.
7. Ecosystem maturity favors 800 V for racks today. 1,500 V equipment is mature in PV and BESS, which makes it attractive for backbones and storage, but rack-level 1,500 V products are early.
8. Hybrids are likely. A 1,500 V campus or hall backbone feeding 800 V row distribution can capture much of the conductor benefit where distances are long while keeping the rack interface on the more mature 800 V ecosystem. The extra DC/DC stage must earn its place, and the break-even distance is calculable.
How Keentel helps here: Keentel Engineering performs independent DC architecture studies that test each of these findings against your site. We do not sell equipment, so our recommendation follows the engineering and the owner's priorities.
What 800 VDC does well
The advantages commonly cited for 800 VDC stand up to engineering review:
- Lower insulation and voltage-withstand requirements. Clearances, creepage distances, insulation thickness and test voltages are all lower, which means smaller, cheaper and more compact equipment.
- An emerging ecosystem of compatible equipment. Rectifiers, DC switchgear, busways, rack power shelves, DC breakers and battery systems at 800 V are being developed by many suppliers in parallel, which supports competitive procurement and multiple sourcing.
- Alignment with high-density AI rack roadmaps. Industry 800 VDC rack roadmaps define rack-level interfaces, connectors and power shelves that equipment makers are designing toward.
- Simpler rack-level conversion. The 800 V to 54 V converter uses mature 1,200 V SiC devices and well-understood resonant topologies.
- A natural fit with 480 V AC. An AFE rectifier from 480 V AC produces an 800 V bus with comfortable modulation margin.
- Bipolar grounding option. A ±400 V configuration keeps voltage to ground at 400 V, which simplifies insulation to ground, reduces touch-voltage hazards and aligns with existing 380–400 V DC telecom and data center practice.
What 1,500 VDC does well
The advantages commonly cited for 1,500 VDC also hold up:
- Significantly lower distribution current. About 47% lower than 800 V at the same power.
- Potential reductions in copper. Typically 45–65% less conductor area per circuit, depending on whether ampacity or loss governs, which can mean tens of tons less copper for a large hall.
- Lower conductor losses over long feeders. The loss advantage grows with distance, which makes 1,500 V attractive for campus backbones and for feeding halls from a central rectifier plant.
- A good fit for centralized, high-power DC distribution. Fewer, larger rectifiers can feed more load over longer distances.
- Scalability for very large campuses. As racks approach 1 MW and halls approach hundreds of megawatts, the current at 800 V becomes difficult to manage, while 1,500 V keeps it within practical busway ratings.
- Mature upstream products. 1,500 V DC is standard in utility-scale PV and BESS, so rectifier power stages, DC combiners, DC-rated fuses and breakers, cables rated for 1,500 V or 2,000 V DC and battery racks exist and are listed for those markets.
The engineering challenges both must solve
Higher-voltage DC distribution, at either class, requires careful attention to:
- DC circuit breakers and fault interruption. No natural current zero, very fast rise of fault current from capacitors, and the need for selectivity among many parallel loads.
- Insulation coordination and electrical clearances. Steady DC stress, transient overvoltages, partial discharge and contamination.
- Arc-fault and ground-fault protection. Detecting high-impedance faults on systems that may be ungrounded or high-resistance grounded, and limiting arc energy.
- Equipment certification and regulatory compliance. Listings, code articles and authority having jurisdiction (AHJ) acceptance for products that are new to the data center.
- Power conversion efficiency and thermal management. Converter losses become heat in the rack or the hall that the liquid or air cooling must remove.
- Maintenance safety and system reliability. Qualified-person training, lockout/tagout (LOTO) and verification procedures for DC, stored-energy discharge and redundancy schemes that keep the cluster running during maintenance.
The rest of this guide takes these challenges one by one, with the 800 V versus 1,500 V difference in each.
How Keentel helps here: From DC short-circuit studies and protection coordination to DC arc-flash labels and NEC/AHJ submittals, Keentel Engineering covers each of these challenges with a single coordinated team, from 4 kV distribution to 765 kV transmission.
Part B — Engineering Guide: Choosing the DC Voltage Class
1. The physics: current, loss and voltage drop
Every comparison of DC voltage classes starts with three relationships. For a DC circuit delivering power P at voltage V through a two-conductor loop of length L (one way) with conductor resistivity ρ and cross-sectional area A:
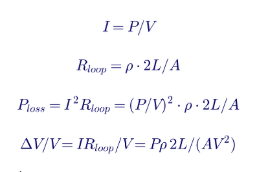
Three consequences follow directly:
- Current scales as 1/V. Doubling the voltage halves the current.
- Loss in a given conductor scales as 1/V². Doubling the voltage cuts the loss to a quarter.
- Percentage voltage drop in a given conductor scales as 1/V². The absolute drop scales as 1/V, and it is divided by a larger V.
Going from 800 V to 1,500 V is a factor of 1.875 in voltage. Current falls to 1/1.875 = 0.533 and loss in the same conductor falls to 1/1.875² = 0.284.
Resistivity at operating temperature
Copper resistivity is 1.72 × 10⁻⁸ Ω·m at 20°C and rises by about 0.393% per degree Celsius. At a 75°C conductor temperature, the value used for most US ampacity calculations, it is about 2.09 × 10⁻⁸ Ω·m. Aluminum is about 1.6 times higher. Loss and drop calculations should always use the operating temperature, not the 20°C value, or they will understate losses by about 20%.

A worked example at fixed current density
Busways and busbars are often designed at a fixed current density J, for example about 1.6 A/mm² for a copper busway (actual values depend on the product, enclosure, ventilation and temperature rise rating). At fixed current density, the percentage loss over a loop of length 2L is:

That formula is useful because it shows that at the same current density, the loss fraction depends only on distance and voltage. Using ρ at 75°C and J = 1.6 A/mm²:
| One-way length | 800 VDC loss | 1,500 VDC loss | Difference |
|---|---|---|---|
| 50 m | 0.42% | 0.22% | 0.20 points |
| 100 m | 0.84% | 0.45% | 0.39 points |
| 300 m | 2.51% | 1.34% | 1.17 points |
Two points stand out. First, inside a typical data hall (runs of 30–100 m), the absolute difference between the voltage classes is a few tenths of a percent. Second, on campus backbones of several hundred meters, the difference exceeds a full percentage point and starts to rival the differences between converter technologies.
Note that this comparison holds current density constant, which means the 1,500 V busway also uses about 47% less copper. If the designer instead used the same busway at both voltages, the 1,500 V loss would be 28.4% of the 800 V loss rather than 53%.
How Keentel helps here: Keentel Engineering builds load-flow and voltage-drop models of the full DC network, including busway impedance at operating temperature, connector resistance and load diversity, so the loss numbers in the design basis are defensible rather than rules of thumb.
2. Conductor sizing and copper
Three ways to size a DC conductor
A DC conductor is sized by whichever of these three constraints is most demanding:
- Ampacity. The conductor must carry the continuous current without exceeding its insulation temperature rating. In the NEC, continuous loads are generally sized at 125% of the continuous current, and ampacity tables such as NEC Table 310.16 (with the appropriate corrections and adjustments) or busway listings apply. Check that the cable's voltage rating covers the DC system voltage; many building wire types are rated 600 V or 1,000 V, which matters for 1,500 V systems.
- Voltage drop. The DC/DC converters at the racks have an input voltage window. The worst-case drop from rectifier to the farthest rack, at maximum load and minimum rectifier output, must keep the rack within that window with margin.
- Loss economics. The owner may choose a larger conductor than ampacity requires because the energy saved over the life of the facility exceeds the extra copper cost. This is often decisive at 800 V on long runs.
Equal-loss sizing
If loss governs, the area for a target loss percentage is:
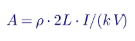
where k is the target loss fraction. For a 400 kW rack, a 60 m one-way run and k = 1%, the required copper area is about 157 mm² per pole at 800 V and about 45 mm² per pole at 1,500 V. The ratio is 0.284, as expected.
Ampacity-limited sizing
But at 500 A, a 157 mm² cable is too small to carry the current. A conductor in the range of 240–300 mm² (or about 500–600 kcmil) would typically be needed at 800 V, depending on installation conditions. At 267 A the ampacity requirement is roughly 95–120 mm² (about 4/0 AWG to 250 kcmil). Ampacity governs both voltages here, and the ratio of areas is about 0.40–0.50 rather than 0.284.
The general rule:
- Short runs inside a hall: ampacity governs. 1,500 V saves roughly 45–65% of the copper area for cable and about 47% for busway at a fixed current density.
- Long runs on a campus: loss or voltage drop governs. 1,500 V saves up to 72% of the copper area for the same loss, or delivers 72% lower loss for the same copper.
Copper mass for a 50 MW hall
Consider an illustrative 50 MW AI hall with 125 racks of 400 kW, each fed by a dedicated two-conductor run averaging 60 m one way, sized at a current density of 1.6 A/mm². Copper density is 8,960 kg/m³.

| Quantity | 800 VDC | 1,500 VDC |
|---|---|---|
| Current per rack | 500 A | 266.7 A |
| Copper area per pole | 312.5 mm² | 166.7 mm² |
| Copper mass, 125 racks | about 42 metric tons | about 22 metric tons |
| Difference | Baseline | about 20 metric tons less |
At a copper price on the order of $10 per kilogram, 20 tons is about $200,000 of raw metal. Installed cost savings are larger because smaller conductors mean smaller raceways, lighter supports, smaller terminations and less labor. Still, on a 50 MW hall that may cost several hundred million dollars to build and fit out, copper savings alone rarely decide the voltage class. They are one factor among many.
Real designs rarely run individual feeders to each rack. Row busways with plug-in tap-off units are more common, which changes the numbers but not the ratio. The ratio of copper at fixed current density is 0.533 regardless of topology.
Busway ratings and availability
Most busway products used in US data centers today are listed under UL 857 for 600 V AC or less. DC ratings, and ratings above 600 V, are newer. Busways for 800 V DC are entering the market alongside industry 800 VDC rack roadmaps. Busways for 1,500 V DC exist for PV and BESS collection systems but are less common in data-center plug-in formats. Confirm the voltage rating, DC rating, short-circuit withstand rating and tap-off unit ratings before committing to either voltage class.
How Keentel helps here: Keentel Engineering sizes DC conductors and busways for ampacity, voltage drop, short-circuit withstand and life-cycle loss, and checks every product's DC voltage and fault ratings against the design, so the specification survives procurement and AHJ review.
3. Distribution efficiency versus end-to-end efficiency
Where the losses are
The table below shows illustrative full-load efficiencies for each stage in three architectures, from the MV bus to the 54 V rack bus. They are representative of current technology but are not data for any specific product. Actual values must come from manufacturer test data at the operating points of interest.
| Stage | 800 VDC | 1,500 VDC | Hybrid 1,500/800 |
|---|---|---|---|
| MV/LV transformer | 99.0% | 99.0% | 99.0% |
| AC/DC rectifier | 98.0% | 98.3% | 98.3% |
| DC distribution (backbone or hall) | 99.3% | 99.65% | 99.6% |
| Intermediate DC/DC, 1,500 to 800 V | not used | not used | 98.8% |
| Row distribution at 800 V | included above | included above | 99.6% |
| Rack DC/DC to 54 V | 98.0% | 97.2% | 98.0% |
| End to end | 94.41% | 94.26% | 93.47% |

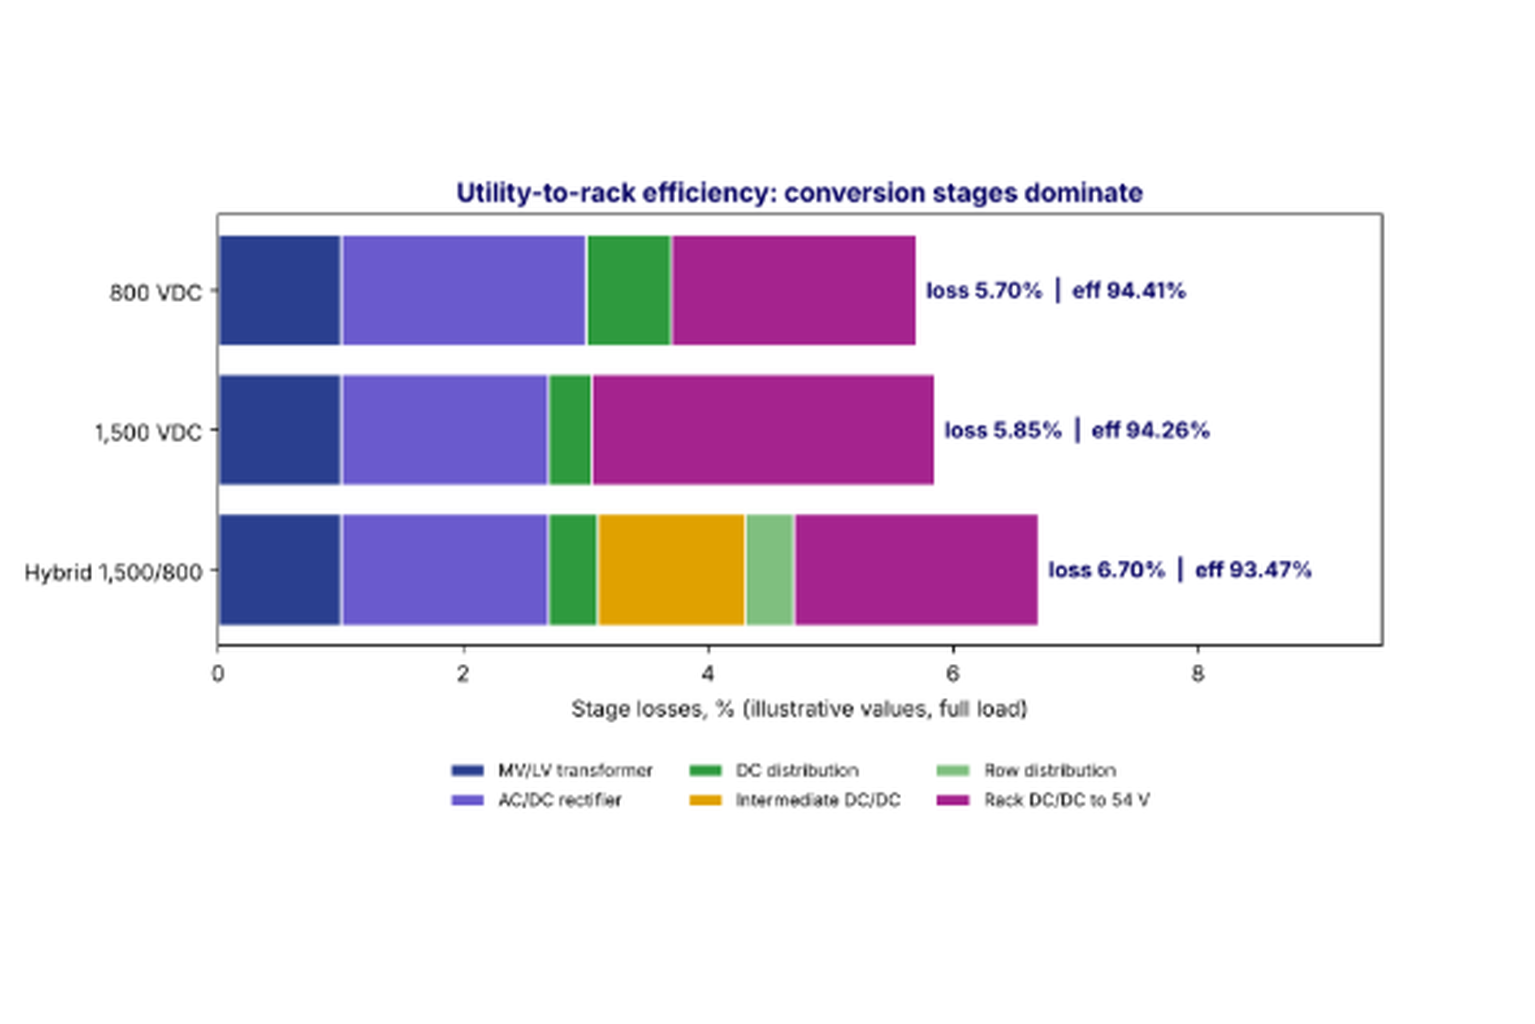
Figure 2. Utility-to-rack loss by stage for three architectures (illustrative values at full load). Conversion stages, not distribution, dominate. A small change in rack converter efficiency outweighs the busway advantage of 1,500 V.
What the example shows
- The 1,500 V system wins on distribution (0.35% versus 0.7% loss) and slightly on the rectifier (a higher-voltage DC bus means lower DC-side current and lower conduction losses in the rectifier output stage).
- The 1,500 V system loses on the rack converter. In this illustration, the 28:1 step-down with higher-voltage devices costs 0.8 points.
- Net result: 800 V is slightly ahead at 94.41% versus 94.26%, a difference of about 0.15 points, or about 60 kW on a 40 MW average load.
- The hybrid is behind both in this short-distance example, because its intermediate DC/DC stage costs 1.2% and the distances are too short to recover it.
Change the assumptions and the answer changes. If a future 1,500 V rack converter reaches 98.0%, the 1,500 V system leads by about 0.65 points. If the hall is long, distribution savings grow. That is precisely why this decision should be made with project-specific numbers.
Partial load matters
AI clusters do not run at nameplate all the time. Training jobs may hold a cluster at 70–90% of its power budget for weeks, while inference and mixed workloads vary more. Conductor loss scales with the square of load, so at 60% load the distribution loss is only 36% of its full-load value. Converter loss has a fixed component (switching, magnetics core loss, control and fans) that makes efficiency drop at light load. Efficiency comparisons should therefore be made across a weighted load profile, for example 25%, 50%, 75% and 100% of rated load with weights that reflect the expected duty.
Annual energy and cost
For an illustrative 50 MW hall with a 100 m busway sized for 1% loss at full load at 800 V, operating at a constant 80% load:
- 800 V distribution loss: 0.8² × 1% × 50 MW = 320 kW.
- 1,500 V distribution loss, same busway: 320 × 0.284 = 91 kW.
- Difference: about 229 kW, or about 2.0 GWh per year.
- Value at $0.07/kWh: about $140,000 per year, before the cooling energy needed to remove that heat.
That is real money, but it is in the same range as the 60 kW-per-40 MW rack converter penalty in the efficiency example above, which is worth about $37,000 per year at the same price, and it is much smaller than the effect of a one-point change in rectifier or rack converter efficiency (about 400 kW, or roughly $245,000 per year).
Verifying efficiency claims
Efficiency figures in brochures and comparison charts are often measured under ideal conditions: nominal input voltage, full load, a cool ambient and new components. Before relying on them in a voltage-class decision, ask:
- What was measured, and between which terminals? A rectifier efficiency may or may not include its input transformer, filters, fans or auxiliary power. A rack converter efficiency may or may not include its input protection, pre-charge circuit and cooling fans.
- At what load points? Peak efficiency at 50% load can be a point or more higher than efficiency at 10% or 100% load.
- At what input voltage and temperature? Efficiency typically falls at the edges of the input window and at high ambient or coolant temperature.
- To what test method? A documented test method, witnessed or certified, is worth far more than a datasheet number.
- What is the uncertainty? Measuring a 98% efficient converter to ±0.1% requires careful instrumentation, because a small error in input or output power measurement becomes a large error in loss.
On site, efficiency can be verified during commissioning with calibrated DC and AC power analyzers at several load bank steps. Measured losses then become the baseline for the operating model, and differences from the design assumptions can be traced to specific components. For a decision as consequential as the DC voltage class, an owner should insist that every efficiency number in the comparison comes with its measurement conditions, and that both voltage classes are compared on the same basis.
Cooling and heat
Every watt of electrical loss becomes a watt of heat. Loss in the busway warms the hall air or the overhead space. Loss in the rack converter adds to the heat load in the rack, which in liquid-cooled racks may be removed by air or by a cold plate depending on the power shelf design. Loss in a central rectifier room is removed by that room's cooling. When comparing architectures, assign each loss to the cooling system that removes it and include the associated cooling energy, not just the electrical loss.
How Keentel helps here: Keentel Engineering builds end-to-end efficiency models from manufacturer test data, weights them by your expected load profile and converts the result into annual energy, cost and cooling load. The model becomes a living tool for procurement, because every bid can be scored against the same baseline.
4. The rectifier front end and the AC system
Rectifier options
The rectifier converts 60 Hz AC to the DC bus and is the main interface between the data center and the utility. The main options are:
- Six-pulse diode or thyristor bridge. Simple and efficient, but draws large 5th and 7th harmonic currents and a DC voltage that varies with the AC voltage. Rarely acceptable alone at the power levels of AI halls.
- 12-pulse or 18-pulse rectifiers. Use phase-shifting transformer windings to cancel the lower-order harmonics. Common in large DC systems. The transformer becomes part of the rectifier and is often custom.
- Active front end (AFE). A PWM-controlled three-phase converter using IGBTs or SiC MOSFETs. Draws near-sinusoidal current at near-unity power factor, regulates the DC bus voltage independent of AC voltage, can provide reactive power support and can ride through some AC disturbances. The DC bus must be higher than the peak AC line-to-line voltage.
- Solid-state transformer (SST). Converts MV AC (for example 13.8 kV or 34.5 kV) directly to the DC bus with high-frequency isolation, eliminating the 60 Hz transformer. Promising for both voltage classes and especially attractive at 1,500 V, but still at an early commercial stage for data center use.
800 V from 480 V AC
An AFE needs a DC bus voltage of at least the peak of the AC line-to-line voltage, with extra margin for high-line conditions and control headroom:

At +10% high line, the minimum is about 747 V. An 800 V bus gives a comfortable but not lavish margin. A ±400 V bipolar bus fits the same requirement across the full pole-to-pole voltage. This natural fit with the 480Y/277 V system that US data centers already use is one of the strongest practical arguments for 800 V.
1,500 V from a dedicated secondary
To produce 1,500 V from a diode bridge, the AC line-to-line voltage needs to be about 1,500/1.35 = 1,111 V. An AFE only needs its DC bus to exceed the AC peak with margin, so it can work from a lower secondary. PV inverters and BESS power conversion systems built on 1,500 V DC commonly connect to transformer windings of roughly 600–690 V AC, which gives an AC peak of about 850–975 V and a comfortable boost ratio to 1,500 V. A 1,500 V AFE fed directly from 480 V is possible but works at a ratio of about 2.2, with higher ripple current and switching stress.
The practical implications for a US site:
- The MV/LV transformer is specialized. A 13.8 kV or 34.5 kV primary with a 600–690 V or roughly 1,100 V secondary is common in PV and BESS plants but is not a stock data center unit. Lead times and spares need attention.
- The AC switchgear between the transformer and the rectifier may operate above 600 V and, for a diode rectifier, above 1,000 V AC, which changes the NEC articles and the product listings that apply to it.
- The rectifier is likely integrated with its transformer as a packaged skid, similar to PV and BESS practice, rather than fed from general-purpose 480 V switchgear.
- Mechanical loads (chillers, pumps, CRAHs and CDUs) still need 480 V AC or their own DC supply, so the site has two LV systems.
Harmonics and IEEE 519
The rectifier plant is the dominant harmonic source on an AI campus. IEEE 519-2022 sets current distortion limits at the point of common coupling (PCC) with the utility, based on the ratio of short-circuit current to load current, and voltage distortion limits on the utility bus. A 100 MW-class campus at 138 kV or 230 kV may still have a relatively low short-circuit ratio at its PCC, which tightens the current limits.
Both voltage classes face the same harmonic challenge for the same power. The choice of rectifier technology (AFE versus multi-pulse) matters far more than the DC voltage. AFE rectifiers produce harmonics around the switching frequency and its sidebands, which are small but can excite resonances with cable capacitance and power factor correction capacitors. A harmonic study with frequency scans should be part of every large DC data center design.
Power quality and load dynamics
AI training workloads can create large, synchronized power swings as thousands of accelerators move between compute and communication phases. The rectifier plant passes these swings to the AC system unless energy storage on the DC bus or controls in the rectifiers smooth them. This affects:
- Utility voltage flicker and oscillation. Repetitive power swings at frequencies of a fraction of a hertz to tens of hertz can interact with generator controls and other loads.
- Rectifier and transformer thermal cycling.
- Interconnection requirements. Utilities and transmission planners in the US are increasingly asking large loads for ride-through capability, ramp limits and dynamic models.
The DC voltage class affects how storage is integrated (see Section 13), but the obligation to manage the load profile is the same.
How Keentel helps here: Keentel Engineering performs IEEE 519 harmonic studies with frequency scans, rectifier specification and transformer design review, and electromagnetic transient (EMT) modeling of rectifier controls and load swings. We support utility large-load interconnection studies at 138 kV, 230 kV and 345 kV, including the dynamic models utilities now require.
5. The rack DC/DC converter
Step ratio and topology
The rack converter takes the bus voltage down to the rack or board voltage. Typical roadmaps target 48–54 V for the rack bus, with further conversion on the server board to 12 V, then to the sub-volt core voltages. Some designs skip the 54 V rack bus and convert directly from the high-voltage bus to 12 V or lower.
| Parameter | 800 VDC input | 1,500 VDC input |
|---|---|---|
| Step ratio to 54 V | about 15:1 | about 28:1 |
| Typical primary device class | 1,200 V SiC MOSFET | 2,000–3,300 V SiC, or stacked 1,200 V devices |
| Device voltage utilization | 800/1,200 = 67% | 1,500/2,000 = 75%; 1,500/3,300 = 45%; stacked 750/1,200 = 63% |
| Common topologies | LLC resonant, dual active bridge, phase-shifted full bridge | Input-series output-parallel (ISOP) modules, multilevel LLC, three-level DAB |
| Ecosystem | Emerging, multiple suppliers | Early, few suppliers |
Why the device class matters
Power semiconductors are rated by their blocking voltage, but designers do not run them at their rating. Two effects drive derating:
- Transient overvoltage. Switching transients and bus disturbances add to the steady voltage. Designers typically keep the steady bus at 60–70% of device rating to leave room.
- Cosmic-ray-induced failure. High-energy neutrons can trigger single-event burnout in power devices. The failure rate rises steeply with the applied voltage as a fraction of rating, so long-life, high-reliability designs keep the steady voltage well below rating. This is why a 1,500 V bus is rarely run on 2,000 V devices without careful analysis, and why 3,300 V devices or stacked lower-voltage devices are common in 1,500 V converters.
Higher-voltage devices generally have higher on-resistance and higher switching energy for the same die area, which costs efficiency or requires more silicon. Stacked designs need voltage balancing between modules and more control complexity. None of this is a fundamental barrier, and 1,500 V converter technology is improving quickly, but at today's technology level it tends to mean a slightly less efficient or more expensive rack converter for 1,500 V.
Isolation
Most rack converters provide galvanic isolation between the high-voltage bus and the rack bus. Isolation keeps the 48–54 V side at a safe voltage to ground regardless of where the high-voltage bus is referenced, which simplifies the safety design of the servers. The isolation barrier must be rated for the full working voltage to ground plus transients. At 1,500 V (or 750 V to ground for a midpoint-grounded system) the transformer insulation, creepage and partial discharge requirements are higher than at 800 V.
Hot-swap and connectors
Rack power shelves are typically hot-swappable. Hot-plugging a converter onto an 800 V bus requires connectors rated to make and break under load or interlocks that prevent it, inrush limiting for the converter's input capacitance and touch-safe connector design. At 1,500 V, connector arcing on disconnection is more persistent, creepage distances are larger and the inrush energy is higher. Industry 800 VDC rack roadmaps address connector and busbar interfaces for the 800 V class; comparable rack-level interfaces for 1,500 V are less developed.
How Keentel helps here: Keentel Engineering reviews rack power shelf and converter specifications against the DC bus design: input voltage window, transient tolerance, isolation rating, inrush, hot-swap interlocks and fault contribution, so the rack and the distribution system are designed as one system.
6. System grounding: the decision that changes everything
Pole-to-pole voltage is not voltage to ground
The label "800 VDC" or "1,500 VDC" normally refers to the voltage between the positive and negative poles. The voltage between each pole and ground depends on how the system is grounded, and voltage to ground drives insulation design, shock hazard, ground-fault behavior and, in some cases, code applicability.
| Configuration | Pole-to-pole | Positive to ground | Negative to ground | Notes |
|---|---|---|---|---|
| Unipolar, negative grounded (0/800 V) | 800 V | 800 V | 0 V | Simple. Full voltage to ground on one pole. A ground fault on the positive pole is a short circuit. |
| Bipolar, midpoint grounded (±400 V) | 800 V | 400 V | 400 V | Halves voltage to ground. Allows 400 V loads between one pole and midpoint if a neutral is distributed. |
| Bipolar, midpoint high-resistance grounded (±400 V HRG) | 800 V | about 400 V normal | about 400 V normal | Limits ground-fault current to a few amperes. A first ground fault shifts the pole voltages to 0 V and 800 V. |
| Unipolar, negative grounded (0/1,500 V) | 1,500 V | 1,500 V | 0 V | Full 1,500 V to ground on one pole. Rare for data centers. |
| Bipolar, midpoint grounded (±750 V) | 1,500 V | 750 V | 750 V | Keeps voltage to ground below 1,000 V. Common in some PV and BESS designs as a floating or high-resistance midpoint. |
| Ungrounded (floating) with insulation monitoring | 800 V or 1,500 V | Floats; set by insulation leakage | Floats | Common in PV, BESS and some DC distribution. A first ground fault does not trip but must be found and cleared. |
What a ±750 V system buys
A midpoint-grounded 1,500 V system has the same 47% current reduction and 72% conductor loss reduction as a unipolar 1,500 V system, because the current depends on pole-to-pole voltage. But each pole is only 750 V from ground, so:
- Insulation to ground is designed for 750 V working voltage plus transients rather than 1,500 V.
- Touch voltage on a single-pole contact with a grounded person is 750 V rather than 1,500 V.
- Pole-to-pole insulation and clearances must still be designed for 1,500 V.
- Ground faults on one pole drive current through the midpoint grounding path, which must be designed and protected.
Similarly, a ±400 V system keeps each pole at 400 V to ground. This is one reason the 800 V class aligns well with existing 380–400 V DC data center and telecom practice: much of the insulation-to-ground and touch-voltage engineering is the same.
Solid, high-resistance or ungrounded?
- Solidly grounded systems produce a high ground-fault current that protective devices can detect and clear quickly. They limit the overvoltage on unfaulted poles. They also make every ground fault a trip, which may take a rack or a row offline.
- High-resistance grounded (HRG) systems limit ground-fault current to a few amperes, which avoids arc damage on the first fault and allows operation to continue while the fault is located. The unfaulted pole rises to full pole-to-pole voltage relative to ground during the fault, so insulation to ground must be rated for full pole-to-pole voltage anyway.
- Ungrounded systems with insulation monitoring behave similarly to HRG. An insulation monitoring device (IMD) measures the insulation resistance of each pole to ground and alarms on a first fault. A second fault on the other pole is a short circuit.
The important consequence: if the system is HRG or ungrounded, the insulation to ground must withstand full pole-to-pole voltage during a first fault. The advantage of a ±750 V configuration for insulation is then smaller, although touch voltage under normal conditions is still lower.
Ground-fault detection at DC
AC ground-fault relays rely on zero-sequence current measured by current transformers. DC systems need different sensors:
- Residual current sensing with DC-capable Hall-effect or fluxgate sensors around both poles.
- Insulation monitoring devices, which inject a low-frequency test signal or measure pole-to-ground voltage balance to estimate insulation resistance.
- Ground-fault location systems, which inject a tracer signal and use portable or fixed sensors on each branch to locate the faulted circuit without de-energizing the bus.
- Midpoint current monitoring in midpoint-grounded systems.
How Keentel helps here: Keentel Engineering develops DC grounding studies that select the grounding configuration, size grounding resistors and conductors, specify IMDs and ground-fault location systems, and verify insulation ratings for faulted-pole conditions. The grounding decision is made early, with the rest of the design built around it.
7. Insulation coordination, clearance and creepage
DC stress is different from AC stress
Under AC, electric stress reverses polarity 120 times per second. Under DC, it is constant. That changes how insulation ages and fails:
- Space charge accumulates in polymer insulation under DC, distorting the internal field. Insulation designed for AC may not perform the same at the equivalent DC voltage.
- Surface contamination under DC can attract and hold conductive particles, especially in dusty or humid environments, which increases surface tracking risk.
- Polarity reversals (for example, during some fault or maintenance conditions) can be particularly stressful for insulation that has accumulated space charge.
- Partial discharge (PD) behaves differently under DC; the discharge repetition rate is much lower than under AC but can still erode insulation over time, especially when ripple or transients are present.
Clearance and creepage
Clearance is the shortest distance through air between conductive parts. Creepage is the shortest distance along an insulating surface. Product standards set minimums based on working voltage, the expected transient overvoltage (overvoltage category), the pollution degree of the environment and the material's comparative tracking index (CTI, here in the materials sense, not the coordination time interval used in protection).
The values below are illustrative, based on the general approach of IEC 60664-1 for a pollution degree 2 environment (normal indoor equipment) and insulating materials in material group III. Product-specific standards (for example UL 62368-1 for information technology equipment, UL 891 for switchboards or UL 489 and UL 489B for circuit breakers) set the actual requirements, and those requirements govern.
| Parameter (illustrative) | 800 V working voltage | 1,500 V working voltage |
|---|---|---|
| Creepage, pollution degree 2, material group III | about 8 mm | about 15 mm |
| Clearance, rated impulse 6 kV | about 5.5 mm | not typical for this class |
| Clearance, rated impulse 8 kV | not typical for this class | about 8 mm |
| Relative busbar spacing | Baseline | about 1.5–2 times larger |
| Insulation test voltage (typical approach) | Baseline | higher in proportion to working voltage and impulse rating |
The practical effect is that equipment at 1,500 V is physically larger for the same current rating, or uses more expensive insulating materials and barriers to stay compact. For busways, tap-off units, connectors and rack power shelves, where space is precious, this is a real cost.
Transient overvoltages on the DC bus
Sources of transient overvoltage on the DC bus include:
- Switching of rectifiers and converters, including fast voltage edges from SiC devices.
- Interruption of fault current by breakers, fuses or solid-state devices, which produces an overvoltage proportional to the circuit inductance and the rate of current change.
- Transferred surges from the AC system through the rectifier.
- Resonance between busway inductance and converter input capacitance.
Surge protective devices (SPDs) rated for DC and for the system voltage, metal-oxide varistors or transient voltage suppressors inside solid-state breakers, and proper snubbing are needed at either voltage. At 1,500 V the SPD ratings are higher and the clamping voltages must still fall within the equipment's withstand.
Partial discharge in busways and connectors
At 800 V, partial discharge is usually not a concern in well-designed equipment, because the voltage is below the inception voltage of most air gaps and insulation systems. At 1,500 V, and particularly with fast voltage edges superimposed, PD inception becomes a real design consideration for busbar insulation, connectors and the isolation transformers inside converters. PD testing is part of the type testing of many 1,500 V PV and BESS products and should be requested for 1,500 V data center equipment.
How Keentel helps here: Keentel Engineering performs insulation coordination studies for DC systems, including transient overvoltage analysis with EMT models, SPD selection and coordination, and review of equipment clearances, creepage and PD test data against the actual system voltages and grounding.
8. DC fault current: where it comes from and how fast it rises
Sources of DC fault current
A short circuit on the DC bus is fed from several sources at once:
- Rectifiers. Depending on topology and controls, a rectifier may limit its output current electronically (AFE with current limit), feed fault current through its diodes (diode or uncontrolled AFE with freewheeling diodes), or feed through a combination as controls react. AFE converters often block or limit within milliseconds, but their freewheeling diodes can still conduct AC-side fault current unless the AC breaker or a series device opens.
- DC bus and converter capacitance. The output capacitors of rectifiers and the input capacitors of every rack converter discharge into the fault. This contribution rises extremely fast, limited mainly by the inductance of the bus and cable, and can reach very high peaks in microseconds.
- Energy storage on the DC bus. Batteries connected directly or through converters can supply sustained fault current.
- Rack converters operating in reverse. Usually small, but bidirectional converters can contribute.
Rate of rise
The initial rate of rise of capacitor discharge current is set by the voltage across the loop inductance:

For a loop inductance of 10 μH, di/dt is 80 A/μs at 800 V and 150 A/μs at 1,500 V. In one millisecond, an uninterrupted capacitor discharge could in principle reach tens of kiloamperes before resistance and capacitor depletion limit it. This is why DC protection must act in microseconds to low milliseconds, and why solid-state circuit breakers are so attractive for DC distribution.
Prospective fault current at the same power
If the 800 V and 1,500 V systems are designed for the same power and the same per-unit source impedance (that is, each source can deliver the same multiple of its rated current into a bolted fault), then the fault current at 1,500 V is 53% of the fault current at 800 V, but the fault power (V × I) is the same. This is a useful mental model: higher voltage does not automatically mean more fault energy. It means less current at higher voltage for the same power.
In practice, the per-unit source impedance is not the same. Capacitor banks at 1,500 V store more energy per farad, rectifier current limits differ and battery systems at 1,500 V may have different internal resistance. A DC short-circuit study with realistic source models is the only reliable way to find the fault currents.
Worked example: capacitor energy
Stored energy in a capacitor is:

A rack power shelf with 10 mF of input capacitance stores 3.2 kJ at 800 V. The same capacitance at 1,500 V stores 11.25 kJ. But designers size capacitance for hold-up energy and ripple, not for a fixed number of farads. To store the same 3.2 kJ at 1,500 V, only 2.84 mF is needed. The point is not that 1,500 V stores more energy, but that the energy is delivered at higher voltage and lower current. Across a hall of hundreds of racks, the total stored energy on the bus can reach megajoules, which matters for both fault energy and safe maintenance (see Section 11).
DC time constant
DC fault current from a rectifier source rises with a time constant equal to the circuit L/R. Fuses and breakers are tested and rated at specific L/R time constants. A device rated for a 1 ms time constant may not clear a fault safely in a circuit with a 15 ms time constant. The circuit time constant must be calculated and compared with the device rating. This is equally important at 800 V and 1,500 V, but device ratings at long time constants are harder to obtain at 1,500 V.
How Keentel helps here: Keentel Engineering performs DC short-circuit studies using IEEE 946 methods, IEC 61660-1 methods and EMT simulation, with realistic models of rectifiers, capacitors, batteries and busways. We report peak current, rate of rise, time constant and quasi-steady current at every bus, so every protective device can be checked against its actual duty.
9. Interrupting DC: breakers, fuses and solid-state devices
No current zero
An AC breaker opens its contacts and draws an arc, then waits for the next natural current zero (every 8.33 ms at 60 Hz) to extinguish it. DC has no current zero. A DC breaker must create an arc voltage greater than the system voltage to force the current to zero:

Mechanical DC breakers do this by stretching the arc and splitting it into many short arcs in an arc chute. Each short arc contributes a cathode and anode voltage drop, and the total arc voltage rises with the number of plates. At 1,500 V, more plates, longer arc paths or more series poles are needed than at 800 V. A common approach in PV and BESS is to connect two or more poles of a breaker in series per DC pole, using the breaker's DC rating for that configuration.
Mechanical breakers
- Molded-case circuit breakers (MCCBs) are available with DC ratings. UL 489 covers DC ratings for many products. UL 489B covers molded-case breakers for photovoltaic systems, with ratings up to 1,500 V DC; these are used widely in PV and BESS but are listed for those applications.
- Low-voltage power circuit breakers with DC ratings exist, covered by standards such as UL 1066 and ANSI C37.14 for DC power circuit breakers, used for traction, industrial and mining DC systems.
- Interruption time for mechanical DC breakers is typically several milliseconds to tens of milliseconds, by which time capacitor discharge current has already peaked.
Fuses
DC-rated fuses, including those for PV (UL 248-19 and the IEC 60269-6 gPV class) and for semiconductor protection, can be very fast and are available at 1,000 V and 1,500 V DC. Fuses are attractive for converter and branch protection because they limit current before it peaks, if correctly selected. Their weaknesses are that they must be replaced after operation, they have limited selectivity margin when many are in series and their DC ratings depend on the circuit time constant.
Solid-state circuit breakers (SSCBs)
An SSCB uses power semiconductors to interrupt current in microseconds. It detects the fault (often by current magnitude or rate of rise), turns the semiconductors off and diverts the inductive energy into a metal-oxide varistor or similar absorber. Advantages:
- Speed: interruption in a few microseconds limits peak fault current to a small multiple of load current.
- Arc-free: no arc inside the device, which reduces maintenance and helps arc-flash mitigation.
- Programmable: trip curves, current limiting and coordination logic can be adjusted.
Disadvantages:
- Conduction loss: semiconductors in series with the load conduct continuously, adding loss, often in the range of 0.1–0.3% of throughput depending on the device and current. This partly offsets the busway savings at either voltage.
- Isolation: semiconductors do not provide a visible air-gap isolation. A mechanical disconnect is still needed for safe isolation.
- Ratings and cost: at 1,500 V, SSCBs need higher-voltage devices or series stacks, with higher conduction loss and cost.
Hybrid breakers combine a mechanical contact for low-loss conduction with a solid-state path for interruption, offering a compromise between speed and loss.
Selectivity
A DC distribution system with hundreds of racks needs selectivity: a fault in one rack should be cleared by that rack's protection without tripping the row or the hall. With capacitor-dominated fault currents rising in microseconds, traditional time-current coordination is difficult. Approaches include:
- Current-limiting fuses or SSCBs at the rack that clear before upstream devices can respond.
- Rate-of-rise or directional detection that identifies which branch is faulted.
- Communication-based zone-selective interlocking between devices.
- Limiting the capacitance on each branch and decoupling it from the bus with inductance or controlled pre-charge circuits.
Selectivity is harder at 1,500 V mainly because fewer devices with suitable ratings exist, not because the physics is fundamentally different.
How Keentel helps here: Keentel Engineering performs DC protection coordination studies that combine time-current analysis with transient simulation, so selectivity is shown for the microsecond-scale capacitor discharge as well as the millisecond-scale rectifier contribution. We specify breakers, fuses and SSCBs with verified DC ratings and time constants for your actual system. Our companion article on 800 VDC rack fault protection goes deeper on the rack-level scheme.
10. DC arc flash
Why DC arcs are different
A DC arc, once established, has no current zero to help it extinguish. If the source voltage can supply the arc voltage plus the drop in the circuit, the arc burns until something interrupts it or the gap grows too long. The arc voltage is roughly a constant plus a component proportional to gap length. At 800 V, many short-gap arcs are self-sustaining. At 1,500 V, arcs are sustainable over longer gaps and can survive conditions that would extinguish an 800 V arc.
Calculation methods
US practice for DC arc flash has relied on several published methods, referenced in the informative annexes of NFPA 70E:
- Maximum power method (Doan). Assumes the arc operates at the maximum power that the source can deliver, which occurs when the arc voltage is half the system voltage and the arc current is half the bolted-fault current. Simple and conservative.
- Stokes and Oppenlander and Paukert models. Use empirical arc voltage-current characteristics to solve iteratively for arc current, giving more realistic and usually lower results.
- Enclosure multiplier. For arcs in a box, NFPA 70E guidance suggests multiplying open-air results by a factor (commonly 3) to account for focusing of energy toward the opening.
IEEE 1584-2018 covers AC systems only; it does not provide a DC method.
Maximum power method, worked
The maximum arc power is:

and the incident energy at distance D (in cm) for arc duration T (in seconds) is, using the published form of the maximum power method:

with V in volts and I in amperes. For a working distance of 45.7 cm (18 inches) and an arc duration of 100 ms:
| Case | System voltage | Bolted-fault current | Open air | In enclosure (×3) |
|---|---|---|---|---|
| 800 V bus | 800 V | 50 kA | about 9.6 cal/cm² | about 28.7 cal/cm² |
| 1,500 V bus, same power and per-unit source | 1,500 V | 26.7 kA | about 9.6 cal/cm² | about 28.7 cal/cm² |
| 1,500 V bus, same bolted-fault current | 1,500 V | 50 kA | about 17.9 cal/cm² | about 53.8 cal/cm² |
The first two rows illustrate the point from Section 8: for the same power and per-unit source impedance, maximum-power incident energy is the same at both voltages. The third row shows what happens if a 1,500 V bus is built with the same fault current as an 800 V bus: incident energy nearly doubles.
What actually drives DC arc flash
- Clearing time. Incident energy is proportional to arc duration. A fast SSCB or current-limiting fuse can cut it by an order of magnitude.
- Source stiffness. Large capacitor banks, battery systems and rectifiers without current limiting all increase fault current.
- Arc sustainability. At 1,500 V, assume arcs will sustain and do not take credit for self-extinction.
- Working distance and enclosure geometry. Busway tap-off units and rack power shelves are often worked on at close distances.
Mitigation
- Fast protection: SSCBs, current-limiting fuses and arc detection that trips upstream devices.
- Current limiting in rectifiers and converters: electronic current limits that hold fault current to a defined multiple of rating.
- Remote racking and remote switching: keep people away from the arc.
- Maintenance modes: temporary faster settings while people are working.
- De-energized work: with safe discharge of stored energy (see Section 11).
- Touch-safe design: finger-safe connectors and barriers that prevent the initiating contact.
How Keentel helps here: Keentel Engineering performs DC arc-flash studies using NFPA 70E Annex D methods, with fault currents from detailed DC short-circuit models and clearing times from the actual protective devices. We produce labels, PPE category guidance and mitigation options with before-and-after incident energy, and coordinate with the AC arc-flash study for the rectifier input side.
11. Shock, approach boundaries and stored energy
NFPA 70E DC shock approach boundaries
NFPA 70E provides a table of DC shock approach boundaries (Table 130.4(E)(b) in recent editions). The rows are organized by nominal voltage range, and the 800 V and 1,500 V classes fall into different rows. The values below are typical of recent editions and must be checked against the edition adopted by your organization.
| NFPA 70E DC row (typical values; verify edition) | Limited approach, fixed circuit part | Restricted approach |
|---|---|---|
| 300 V to 1 kV (includes 800 V) | about 1.0 m (3 ft 6 in) | about 0.3 m (1 ft 0 in) |
| 1.1 kV to 5 kV (includes 1,500 V) | about 1.5 m (5 ft 0 in) | about 0.5 m (1 ft 5 in) |
A 1,500 V system therefore requires larger approach boundaries, which affects maintenance access, work procedures and, in some cases, physical layout. For bipolar systems, the boundary is generally based on the highest voltage between any two conductors that a worker could contact, which is the pole-to-pole voltage.
Shock hazard
DC is generally considered less likely than 60 Hz AC to cause ventricular fibrillation at the same current, but DC shocks cause muscle contraction at make and break, burns at higher currents and can be lethal. At 800 V or 1,500 V, any direct contact across the poles is potentially fatal. Grounding configuration matters for single-pole contact: a ±400 V system presents 400 V to ground, a ±750 V system presents 750 V and a unipolar system presents full voltage.
Stored energy and safe discharge
A DC distribution system stores energy in:
- Rectifier output capacitors.
- Busway and cable capacitance (small but nonzero).
- Rack converter input capacitors, which across a hall may total far more than the rectifier capacitance.
- Batteries and supercapacitors connected to the DC bus.
Opening the rectifier and rack breakers does not remove this energy. Safe work requires:
- Discharge circuits with known time constants, on every device with significant capacitance.
- Verification of absence of voltage with meters rated for the DC voltage and measurement category.
- Discharge time labels on equipment.
- Isolation of batteries, which cannot be discharged and must be disconnected.
- Temporary protective grounding where appropriate, applied with devices rated for the available DC fault current.
At 1,500 V, test equipment, voltage detectors and grounding sets must be rated for the higher voltage. Equipment rated for 1,000 V (CAT III or CAT IV 1,000 V meters, for example) is not sufficient.
Electrically safe work condition at DC
NFPA 70E requires an electrically safe work condition (ESWC) before work on de-energized equipment. For DC systems, the procedure must include identifying all sources (including batteries and back-feed from other rectifiers through paralleled buses), opening and locking each disconnect, verifying discharge of stored energy, and testing for absence of voltage on each pole and between each pole and ground.
How Keentel helps here: Keentel Engineering develops DC electrical safety programs and procedures: shock and arc-flash boundaries, ESWC procedures for DC, discharge time calculations, equipment labeling and qualified-person training content. We align the DC program with the site's existing NFPA 70E program so one set of rules covers both AC and DC.
12. Codes, standards and listings in the US
The 1,000 V AC and 1,500 V DC thresholds
US electrical codes and product standards have long used 600 V and 1,000 V as dividing lines between low-voltage and higher-voltage rules. Recent NEC editions reorganized higher-voltage requirements into dedicated articles, and in many places use "1000 volts ac, 1500 volts dc" as the threshold for those rules. For example, in the 2023 NEC the articles for branch circuits, feeders and services (Article 235), underground installations (Article 245), overhead conductors (Article 305), conductors (Article 315) and equipment (Article 495) are titled as applying to systems over 1,000 V AC and 1,500 V DC. Confirm the exact text in the edition your jurisdiction has adopted; some jurisdictions are still on the 2017 or 2020 NEC, and the 2026 NEC is now being adopted in some states.
Implications:
- 800 V DC sits well below the low-voltage DC threshold. Most low-voltage articles apply, with DC-specific requirements in articles such as those for DC microgrids, energy storage and information technology equipment where applicable.
- 1,500 V DC sits exactly at the threshold. A nominal 1,500 V system is within the low-voltage DC rules in editions that use the 1,500 V DC limit, but any operating condition above the threshold (for example a float or equalize voltage on batteries, or rectifier regulation tolerance) raises questions. PV practice handles this by calculating the maximum system voltage and keeping it at or below 1,500 V, as NEC 690.7 requires for PV. A data center DC bus marketed as "1,500 V" may in fact run at a nominal value somewhat below 1,500 V to keep its maximum within the threshold and the equipment ratings.
Relevant NEC articles (check the adopted edition)
- Article 100: definitions, including DC voltage terminology.
- Article 110: general requirements, working space, marking and arc-flash labeling.
- Article 240: overcurrent protection, including DC-rated devices.
- Article 250: grounding and bonding, including DC system grounding provisions.
- Article 645: information technology equipment rooms, where applicable.
- Article 690: solar PV systems, the main established source of 1,500 V DC practice and terminology.
- Article 706: energy storage systems.
- Article 712: DC microgrids, which addresses DC systems in buildings and includes provisions on system grounding, marking and protection.
- Articles 235, 245, 305, 315 and 495: higher-voltage systems, relevant if any part of the system exceeds the low-voltage thresholds.
Product standards and listings
The NEC requires equipment to be listed or approved for its use. For DC data center equipment, the relevant product standards include:
- UL 489: molded-case circuit breakers, including DC ratings.
- UL 489B: molded-case breakers for PV, up to 1,500 V DC.
- UL 1066 and IEEE C37.14: low-voltage power circuit breakers and DC power circuit breakers.
- UL 248 series: fuses, including UL 248-19 for PV fuses.
- UL 891: switchboards, which in recent editions covers DC ratings for many products; check scope and ratings for the voltage class.
- UL 857: busways, traditionally 600 V and below; DC and higher-voltage ratings are new and should be confirmed product by product.
- UL 62368-1: information technology equipment safety, the main standard for rack power supplies and converters.
- UL 1741 and UL 62109: power conversion equipment for distributed energy, often used for PV and BESS converters.
- UL 9540 and UL 9540A: energy storage systems and fire testing; UL 1973 for batteries.
- Connector standards such as UL 1977 for component connectors and UL 6703 for PV connectors, plus product-specific DC ratings for rack and busway connectors.
- PV wire and DC cable listed for 1,000 V, 1,500 V or 2,000 V DC (for example UL 4703 PV wire rated 2,000 V DC in some products) and other cable types with DC voltage ratings.
Many 1,500 V products exist, but they are listed for PV and BESS use. Using a PV-listed breaker in a data center DC bus may be acceptable to an AHJ if the listing, the ratings and the application match, but this needs to be confirmed early. Data-center-specific listings at 800 V are emerging faster than at 1,500 V because industry roadmaps have concentrated there.
When a listing does not exist
If a product is not listed for the application, options include:
- Field evaluation by a nationally recognized testing laboratory (NRTL) or other field evaluation body, following standards such as NFPA 790 and NFPA 791.
- AHJ approval based on engineering documentation, test reports and equivalency arguments.
- Choosing a different product that is listed.
Field evaluation adds schedule and cost to every unit and is not a sustainable approach for hundreds of rack power shelves. It can be reasonable for a small number of large, custom items such as a rectifier skid.
Insurers, owners' standards and local amendments
Code compliance is the minimum. Many data center owners also design to their own engineering standards, and property insurers often apply loss-prevention requirements of their own, for example on separation of electrical rooms, battery siting, fire detection and suppression. These requirements were largely written for AC distribution and lead-acid or lithium-ion UPS batteries, and they may not yet address DC busways at 800 V or 1,500 V in the data hall. Engage the insurer and the owner's standards group early, share the DC protection and arc-flash approach and agree how the requirements will be applied.
Local amendments to the NEC also vary. Some large jurisdictions adopt the NEC with significant local changes, and some lag several editions behind. A design that relies on the 1,500 V DC threshold of a recent edition may need a different compliance path in a jurisdiction still on an older edition, where the relevant thresholds may be written differently. Confirm the adopted edition and amendments at the start of design, not at permit submittal.
NFPA 70E, NESC and other rules
- NFPA 70E governs electrical safety in the workplace, including DC shock and arc-flash boundaries.
- The NESC (ANSI C2) applies to utility-owned facilities, including the utility side of the interconnection substation. It does not normally govern premises wiring inside the data center.
- OSHA 29 CFR 1910 Subpart S sets federal electrical safety requirements in general industry workplaces.
- IEEE 946 (DC auxiliary power systems for generating stations) and IEEE 1709 (MVDC on ships) are useful references for DC system design practice, although neither is written for data centers.
- IEC 60364 defines low voltage as up to 1,000 V AC and 1,500 V DC. It is useful context for international sites and for products designed to IEC standards, but it is not a US code.
How Keentel helps here: Keentel Engineering prepares NEC and NFPA 70E compliance documentation for DC systems, reviews listings and ratings for every major product, supports field evaluation where it is needed and meets with the AHJ early to agree the compliance path. For 1,500 V designs we confirm the maximum system voltage and its relationship to code thresholds and equipment ratings.
13. Energy storage and ride-through
Why storage belongs on the DC bus
AI clusters need ride-through for utility disturbances, smoothing of rapid load swings and in many designs a short bridge to standby generation. Putting storage directly on the DC bus, or connecting it through a DC/DC converter, avoids the double conversion of a traditional AC UPS and gives the fastest response.
1,500 V BESS integration
Utility-scale BESS products are built around 1,500 V DC battery strings. A 1,500 V data center bus can in principle connect to these strings through a DC/DC converter with a modest voltage ratio, or in some designs directly. This is one of the strongest arguments for 1,500 V on large campuses: the storage ecosystem is mature, listed under UL 9540 and tested under UL 9540A for fire safety, and available at hundreds of megawatt-hours.
800 V BESS integration
At 800 V, battery strings in the 700–900 V range can be built from fewer modules in series. Battery products designed for 800 V data center buses are emerging alongside industry 800 VDC rack roadmaps. A DC/DC interface converter decouples the battery voltage, which varies with state of charge, from the regulated bus.
What the voltage class changes
- String design. A 1,500 V string has about twice as many cells in series as an 800 V string, with more complex cell balancing but lower current for the same power.
- Fault contribution. Batteries are stiff sources. At either voltage, the DC short-circuit study must include them, and battery-side protection must be rated for the battery's prospective fault current.
- Fire safety and siting. UL 9540A test results, NFPA 855 spacing and room requirements and local fire code requirements apply at both voltages. Siting large batteries inside or near the data hall is a major design decision regardless of voltage class.
- Maintenance. Batteries cannot be de-energized. Work on battery strings and their DC buses always involves energized parts, and the hazard at 1,500 V is greater.
Grid interaction
Storage on the DC bus can absorb rapid AI load swings so that the rectifiers present a smoother load to the utility, and can support ride-through of utility voltage sags so that the load does not drop off the grid during transmission faults. Both functions are increasingly important to utilities and transmission planners, who are concerned about large loads disconnecting during faults and about oscillations from rapidly varying loads. Our companion article on 800 VDC UPS and energy storage architectures covers storage integration in more detail.
How Keentel helps here: Keentel Engineering designs DC-coupled storage systems, including battery string sizing, DC/DC interface specification, UL 9540 and NFPA 855 compliance, fault contribution analysis and ride-through control studies. We model the combined behavior of the rectifiers, storage and load in EMT and positive-sequence tools to support utility interconnection requirements.
14. Hybrid architectures: 1,500 V backbone, 800 V row
The idea
A hybrid architecture uses 1,500 V where distances are long and power is concentrated, and 800 V where distances are short and the rack ecosystem matters:
MV → transformer → rectifier → 1,500 V campus or hall backbone → 1,500/800 V DC/DC → 800 V row busway → 800/54 V rack converter → servers
Benefits:
- Low current on the long backbone, saving copper and loss where the distance is greatest.
- 800 V at the rack, using the more mature rack-level ecosystem.
- Natural integration of 1,500 V BESS on the backbone.
- Fault and arc-flash containment, because the intermediate DC/DC stage can limit fault current into each row.
- Galvanic isolation between backbone and row, if the intermediate converter is isolated, which simplifies grounding.
Costs:
- An extra conversion stage, with its own loss (perhaps 1–1.5%), cost, footprint, cooling and reliability.
- Two DC voltage classes on site, with two sets of procedures, spares and training.
Break-even distance
The extra stage pays for itself only if the backbone is long enough that the distribution savings exceed its loss. At a fixed current density J, the loss fraction per one-way meter is 2ρJ/V. The saving per meter of 1,500 V over 800 V is:

With ρ at 75°C and J = 1.6 A/mm², this is about 0.0039% per meter. For an intermediate stage loss of 1%:

So at this current density, the hybrid only beats an all-800 V design on efficiency if the backbone is longer than roughly 250 m one way. At a higher current density (smaller conductors) the break-even distance shortens; with a more efficient intermediate stage it also shortens. If the copper is sized for low loss rather than ampacity, the saving per meter is smaller and the break-even distance lengthens.
The hybrid can also be justified on non-efficiency grounds: copper reduction, BESS integration, fault containment or campus-scale distribution between buildings. But the efficiency arithmetic should be done honestly.
Alternatives
- MV AC distribution to each hall, with rectifiers at the hall. Keeps the long runs at 13.8 kV or 34.5 kV AC, where current is tiny, and puts DC only inside the hall. This is the most common approach today and is hard to beat for campus-scale distance.
- MV DC distribution. Using several kilovolts DC for campus distribution is technically possible and studied for very large campuses but has a much less mature ecosystem.
- SST from MV directly to the hall DC bus. Combines the transformer and rectifier and can produce either voltage class.
How Keentel helps here: Keentel Engineering evaluates hybrid, MV AC and MV DC alternatives side by side with a single model, including break-even distances, copper, conversion losses, protection and code paths. We help owners choose where on the campus the AC/DC boundary and each DC voltage boundary should sit.
15. Reliability, availability and maintainability
Component count and failure modes
Reliability is driven by the number and quality of components in the power path and by how redundancy is arranged. Moving from 800 V to 1,500 V changes reliability through:
- Semiconductor voltage stress and cosmic-ray susceptibility, which require careful derating at 1,500 V.
- Insulation stress, with higher electric fields and potential for partial discharge.
- Connector and contact reliability, with arcing on any loose or degraded connection more likely to sustain and cause damage.
- More series devices in stacked converters and series-pole breakers.
- Fewer field-proven products, meaning less operating history to base failure rates on.
In favor of 1,500 V, lower current means lower thermal stress on conductors, joints and contacts for the same design, and possibly fewer parallel paths.
Redundancy schemes
Both voltage classes support the same redundancy concepts:
- N+1 rectifiers paralleled on a common bus.
- 2N with two independent DC buses feeding each rack through dual inputs.
- Block or distributed redundancy, with rows fed from reserve rectifier blocks through transfer switches or DC/DC interfaces.
- Storage on the bus to carry the load through rectifier or utility failures.
The choice of redundancy scheme usually has a larger effect on availability than the choice of voltage class.
Maintainability and workforce
Maintenance on DC equipment at 800 V can draw on existing training for 480 V AC systems, 380–400 V DC telecom systems and PV and BESS maintenance. At 1,500 V, technicians need to be qualified for higher-voltage DC work, with suitable PPE, tools and test equipment. The pool of qualified technicians for 1,500 V DC is primarily in the PV and BESS industry. Data center operators planning 1,500 V should budget for training and procedures early.
How Keentel helps here: Keentel Engineering performs reliability and availability analysis of DC architectures using component failure data and redundancy modeling, and reviews maintainability: access, isolation points, spares strategy and workforce qualification. We present the results so owners can compare options on availability, not just efficiency.
16. Cost: where the money goes
Cost categories that change with voltage class
| Cost category | 800 VDC | 1,500 VDC | Comment |
|---|---|---|---|
| Conductors and busway | Baseline | Lower, about 45–65% less copper | Savings grow with distance. Partly offset by higher insulation and clearance requirements. |
| Raceway, supports, terminations | Baseline | Lower | Smaller conductors mean smaller trays, lighter supports and fewer parallel sets. |
| MV/LV transformers | Standard 480 V secondaries possible | Specialized secondaries | 1,500 V usually needs a dedicated secondary voltage. |
| Rectifiers | Emerging data center products | PV and BESS power stages adaptable | Price per kW is similar for similar technology; volume and competition differ. |
| DC switchgear and breakers | Emerging | Available for PV and BESS; fewer data center products | Listing and AHJ acceptance may add cost at 1,500 V. |
| Rack converters | Emerging, multiple suppliers | Early, few suppliers | Higher device voltage class and insulation add cost at 1,500 V today. |
| Energy storage interface | DC/DC to 800 V bus | Close match to 1,500 V BESS | Favors 1,500 V for large BESS. |
| Protection and arc-flash mitigation | Baseline | Higher | More demanding interruption, larger boundaries, higher-rated test equipment. |
| Engineering, listing, AHJ | Baseline | Higher | More first-of-a-kind effort at 1,500 V. |
| Training and procedures | Builds on 480 V AC and 400 V DC practice | Draws on PV/BESS practice | 1,500 V requires additional qualification. |
| Energy cost over life | Baseline | Lower distribution loss; possibly higher converter loss | Net depends on the end-to-end efficiency model. |
Life-cycle cost model
A defensible comparison uses a life-cycle cost model that includes:
- Capital cost of every item that differs between options, with escalation and contingency appropriate to product maturity.
- Energy cost from the end-to-end efficiency model weighted by the expected load profile, including the cooling energy for each loss.
- Maintenance cost, including test equipment, PPE, training and spares.
- Availability cost, the value of lost compute from expected outages, using the reliability model.
- Schedule risk, the cost of delays from product availability, listing or AHJ acceptance.
- Residual value and flexibility, including how easily the system can adapt to the next generation of racks.
For most first-generation AI halls, the energy and copper savings of 1,500 V are modest compared with the schedule risk of a less mature ecosystem. For very large campuses with long distances and large BESS, the balance can tip the other way.
How Keentel helps here: Keentel Engineering builds life-cycle cost models for DC architectures that tie together our efficiency, reliability and protection studies, and presents the results in a form that owners, developers and lenders can use for investment decisions.
17. Utility interconnection and large-load studies
The voltage class is invisible to the utility, mostly
The utility sees the AC side of the rectifier plant. Whether the DC bus is 800 V or 1,500 V does not change the utility's basic interconnection requirements. What the utility does care about:
- Load size and ramp rates. AI campuses of hundreds of megawatts to gigawatts are among the largest loads on many US transmission systems.
- Ride-through behavior. Whether the load stays connected during transmission faults and voltage sags, or drops off and returns, which can destabilize the grid.
- Power quality. Harmonics under IEEE 519, flicker and oscillations from AI load swings.
- Reactive power and power factor. AFE rectifiers can operate at unity or provide reactive support.
- Dynamic models. Validated models of the load for planning and operations studies.
The DC voltage class indirectly affects these through the rectifier technology, the storage integration and the control strategy.
US interconnection context
Large loads typically connect at 138 kV, 230 kV or 345 kV, sometimes at 500 kV or 765 kV for the largest campuses. Interconnection involves the transmission owner and, in organized markets, the regional transmission organization or independent system operator. Studies typically include:
- Steady-state power flow for thermal and voltage limits under normal and contingency conditions.
- Short-circuit studies for breaker duty at the point of interconnection.
- Dynamic stability studies, including the response of the load to faults.
- Power quality and harmonic studies.
- Electromagnetic transient (EMT) studies where the load is dominated by power electronics, which AI campuses are.
NERC has been examining the reliability impacts of large loads, including computational loads that are sensitive to voltage disturbances and can disconnect in large blocks, and US utilities and planners are adding requirements for large-load ride-through, modeling and data. Expect these requirements to keep evolving.
What the DC design should provide
- Ride-through specifications for rectifiers and DC-bus storage that match utility requirements.
- Ramp-rate control through storage or rectifier controls to keep AI load swings within agreed limits.
- Validated models of the rectifier plant for positive-sequence and EMT studies.
- Harmonic data for the rectifier plant at different load levels.
How Keentel helps here: Keentel Engineering supports large-load interconnection from application to energization: load-flow, short-circuit, dynamic and EMT studies, harmonic studies, model development and validation, and coordination with the transmission owner and system operator. We work at transmission voltages from 69 kV to 765 kV and on the customer substation and MV systems behind them.
18. Cooling, thermal and space impacts
Where the heat goes
- Rectifier rooms or skids at the hall perimeter or outdoors, removed by air or liquid cooling.
- Busways in the hall, adding heat to the space.
- Rack converters inside or beside the racks, adding heat to the rack's air or liquid cooling.
For a 400 kW rack with a 98% efficient converter, about 8.2 kW of heat is produced by the converter alone. At 97.2% it is about 11.5 kW. The difference of about 3.4 kW per rack, across 125 racks, is about 420 kW of heat, which needs cooling capacity. This is one more reason why the rack converter efficiency dominates the voltage-class comparison.
Space
Rack space is the most valuable real estate in an AI data center. The rack converter's power density determines how much of the rack it occupies and whether it can be moved to a sidecar or a separate power rack. 800 V converters currently have a power density advantage because of mature device and magnetics technology. At the hall level, 1,500 V busways are smaller in cross-section, which helps overhead congestion where busways, liquid cooling piping and network trays compete for space. Our companion articles on 800 VDC power for chillers, CDUs and racks and on data center rack engineering cover the rack and mechanical interface in detail.
How Keentel helps here: Keentel Engineering coordinates electrical and mechanical design, allocating loss heat to the right cooling system and checking busway, piping and tray routing in the overhead space, so the electrical design does not create hidden cooling or space problems.
19. The decision matrix
Weighted scoring
The matrix below shows one way to structure the decision. The weights and scores are illustrative and should be set by each owner for each project. Scores are 1 (unfavorable) to 5 (favorable).
| Criterion | Weight | 800 VDC | 1,500 VDC | Hybrid 1,500/800 |
|---|---|---|---|---|
| End-to-end efficiency (short distances) | 15% | 4 | 4 | 3 |
| End-to-end efficiency (long distances) | 5% | 3 | 5 | 4 |
| Copper and installation cost | 10% | 3 | 5 | 4 |
| Rack equipment availability | 15% | 4 | 2 | 4 |
| Protection and arc-flash maturity | 10% | 4 | 3 | 3 |
| Code and listing readiness | 15% | 4 | 2 | 3 |
| Safety and workforce readiness | 10% | 4 | 3 | 3 |
| BESS integration | 5% | 3 | 5 | 5 |
| Scalability to 1 MW racks and GW campuses | 10% | 3 | 5 | 4 |
| Schedule risk | 5% | 4 | 2 | 3 |
| Weighted score (illustrative) | 100% | 3.70 | 3.40 | 3.50 |
With these weights, 800 VDC leads for a near-term project. Increase the weight on long distances, BESS and scalability, or assume rapid maturation of 1,500 V products, and the result shifts toward 1,500 V or a hybrid. The value of the matrix is that it makes the assumptions visible and lets the project team argue about weights rather than conclusions.
A simple decision guide
- Choose 800 VDC when the project must be energized within the next one to three years, rack power is up to a few hundred kilowatts, distances inside the hall are short, the team wants multiple suppliers and listed products, and code and workforce readiness are priorities.
- Choose 1,500 VDC when rack power and campus scale are very large, distances are long, large 1,500 V BESS is part of the design, the owner is willing to lead on listings and AHJ acceptance and the schedule allows for an early-adopter ecosystem.
- Consider a hybrid when a campus backbone is longer than the break-even distance, large BESS integration is needed or fault containment between rows is a priority, while the rack interface stays on the 800 V ecosystem.
- Keep MV AC to the hall as the baseline for campus-scale distance, and use DC only where it clearly wins.
How Keentel helps here: Keentel Engineering facilitates the decision with owners and design teams: we set up the criteria, run the studies that feed each score and document the decision so it can be revisited as products and codes mature.
20. Adoption timeline and readiness
Where each class stands
- 800 VDC: industry rack roadmaps have converged on this class for the next generations of high-density AI racks, with first deployments expected in the 2026–2028 window. Rectifiers, DC switchgear, busways, rack power shelves, DC protection and storage interfaces are being developed by many suppliers. Listings and codes are catching up.
- 1,500 VDC: mature in utility-scale PV and BESS for about a decade, with listed breakers, fuses, cables and converters for those uses. Data center rack-level products are at an early stage. Adoption in data centers is most likely first in backbones, storage interfaces and very large campuses.
- MV DC and SST-based architectures: in research, pilot and early commercial stages; likely to matter for gigawatt-scale campuses later in the decade.
What to watch
- Listings for data center DC switchgear, busway and rack power shelves at each voltage.
- Code changes in upcoming NEC cycles addressing DC distribution in buildings, information technology equipment and DC microgrids.
- NFPA 70E updates to DC arc-flash and shock guidance.
- Device technology for 2–3.3 kV SiC and for SSCBs, which affects 1,500 V converter efficiency and protection.
- Utility and NERC requirements for large loads.
- Supply chain for MV/LV transformers, which affects all architectures.
Designing for flexibility
Owners building now can preserve options by:
- Reserving space and pathways for future rectifier and storage additions.
- Choosing busway and cable ratings that leave margin for higher voltage where cost-effective.
- Specifying modular rectifier plants that can be reconfigured.
- Separating the hall DC bus from the campus distribution so that the backbone can change independently.
How Keentel helps here: Keentel Engineering tracks codes, standards and product developments for DC distribution and builds flexibility into designs so that today's 800 V hall can grow into tomorrow's architecture without stranded investment.
21. DC bus control, regulation and stability
Who sets the voltage?
On an AC system, the utility and the generators set the voltage and frequency. On a DC data center bus, the rectifiers set the voltage, and the way they share load and respond to disturbances is a design choice. Common approaches:
- Master-slave control: one rectifier regulates voltage and the others follow a current command. Simple but has a single point of failure unless the master role transfers automatically.
- Droop control: each rectifier lowers its output voltage slightly as its current rises, so paralleled units share load without communication. The bus voltage varies with load by a designed amount, typically one to a few percent.
- Centralized or hierarchical control: a supervisory controller adjusts setpoints to restore nominal voltage, balance loading, manage storage and respond to utility events, while local droop provides fast sharing.
The voltage class does not change these approaches, but it changes the numbers. A 2% droop is 16 V at 800 V and 30 V at 1,500 V. Rack converter input windows, storage converter setpoints and protection thresholds must all account for the full range of bus voltage, including droop, regulation tolerance, transients and the voltage during storage discharge.
Constant-power loads and negative impedance
Tightly regulated DC/DC converters draw constant power: when their input voltage falls, they draw more current. Their small-signal input impedance is therefore negative:
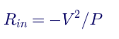
For a 1 MW rack at 800 V, R is about −0.64 Ω. At 1,500 V it is about −2.25 Ω. For an 8 MW row, the values are about −0.08 Ω and −0.28 Ω. A negative input impedance interacting with the inductance and capacitance of the busway and input filters can cause oscillations or instability on the bus. The classic design check, often called the Middlebrook criterion, requires that the output impedance of the source and filter network be much smaller in magnitude than the input impedance of the load across the frequency range of interest.
Because the magnitude of V²/P is 3.5 times larger at 1,500 V for the same power, the 1,500 V system has more margin on this criterion for a given network impedance. In practice, both voltage classes need stability analysis, active damping in converter controls and careful choice of input filter capacitance, because large AI clusters connect thousands of constant-power converters to the same bus.
AI load dynamics on the DC bus
Synchronized training workloads can swing rack power by a large fraction of rating in milliseconds. On the DC bus, these swings appear as current steps that the rectifiers and storage must follow. The design must ensure:
- Voltage stays within the rack converter window during the largest credible load step, including droop and rectifier response time.
- Rectifier current limits are not reached during normal swings, or storage carries the excess.
- Controls do not excite oscillations between rectifiers, storage converters and rack converters.
- The AC side sees a smoothed profile where the utility or interconnection agreement requires it.
Pre-charge and energization
Energizing a DC bus with hundreds of rack converters means charging a very large total capacitance. Without pre-charge, inrush current could trip protection or damage contacts. Rectifiers typically ramp the bus voltage under current limit, and rack converters use pre-charge resistors or active inrush control when connected to a live bus. At 1,500 V, the energy to be absorbed in pre-charge resistors for the same capacitance is 3.5 times higher, although designers can use less capacitance for the same stored energy.
How Keentel helps here: Keentel Engineering performs DC bus stability and control studies with EMT models of rectifiers, storage and constant-power rack loads. We check impedance criteria, simulate AI load steps and utility events, and specify droop, current limits, pre-charge and damping, so the bus is stable from first energization to full load.
22. Worked design example: a row of 1 MW racks
The problem
Industry roadmaps point toward racks of about 1 MW. Consider a row of eight 1 MW racks, 8 MW in total, fed from a DC switchgear lineup 60 m away through a feeder, then along a 40 m row busway with the racks spread evenly along it.
Current
| Item | 800 VDC | 1,500 VDC |
|---|---|---|
| Rack current | 1,250 A | 667 A |
| Row current (8 MW) | 10,000 A | 5,333 A |
| Copper area per pole at 1.6 A/mm² | 6,250 mm² | 3,333 mm² |
A 10,000 A DC row busway is far beyond the rating of most plug-in busway products, which typically top out in the range of about 5,000–6,000 A. At 800 V, the row would need two or more parallel busways, a split into half-rows each with its own feeder, or a higher current-density product. At 1,500 V, a single busway in the 5,000–6,000 A class could serve the whole row.
This is the strongest scalability argument for 1,500 V: as rack power approaches a megawatt, the practical limits of busway ratings, rack-level connectors and tap-off units are reached at 800 V much sooner.
Voltage drop
At a fixed current density, the drop per meter of conductor is ρJ, about 0.0334 V per meter at 75°C and 1.6 A/mm². For the 60 m feeder (120 m of conductor in the loop) and the 40 m busway with evenly distributed load (equivalent to the full current over half the length, or 40 m of conductor in the loop), the total drop to the far end is about:

That is about 0.67% at 800 V and about 0.36% at 1,500 V. Voltage drop is not the governing constraint at either voltage over these distances. Equipment ratings, ampacity and loss economics are.
Protection
- 800 V: the row feeder must interrupt fault currents from a 10,000 A-class source plus the capacitance of eight 1 MW racks. Protective devices with suitable DC ratings at 10,000 A continuous are large and few. Splitting the row into two 5,000 A half-rows makes protection easier and adds selectivity.
- 1,500 V: the 5,333 A feeder is within the range of available DC breakers, but the device must be rated for 1,500 V DC at the circuit's time constant. Rack-level protection at 667 A and 1,500 V needs SSCBs or fuses rated for the voltage.
Conclusion for this example
At 1 MW per rack, 800 V is still workable but pushes busway, connector and breaker ratings hard, requiring parallel paths and more equipment. 1,500 V keeps the row within single-device ratings but requires a less mature rack converter and protection ecosystem. This is why industry roadmaps that start at 800 V for today's racks also anticipate higher voltages, or MV-fed SSTs, for the generations that follow.
How Keentel helps here: Keentel Engineering runs worked designs like this one for your actual row, hall and campus layouts, comparing equipment counts, ratings, losses and protection at each voltage class, so scalability is tested before the first hall is built.
23. Lessons from 1,500 V PV and BESS and from 380 V DC data centers
What PV and BESS taught the industry
Utility-scale PV moved from 1,000 V to 1,500 V DC during the 2010s. The benefits were real: longer strings, fewer combiner boxes, less cable and fewer inverters per megawatt. The industry also learned that:
- DC arc faults are a real fire risk. Loose connectors, damaged cables and poor terminations caused arcing faults and fires, leading to arc-fault detection requirements for many PV systems and better connector practices.
- Connector quality and compatibility matter. Mixing connectors from different manufacturers, even if nominally compatible, has been a source of failures.
- Insulation monitoring and ground-fault detection need care. Ungrounded and functionally grounded PV arrays rely on IMDs and residual current detection, and false or missed alarms are common if settings and installation are poor.
- Workforce training takes time. Qualified technicians, procedures and tooling for 1,500 V DC were built up over several years.
- Equipment ratings must cover the maximum system voltage, not the nominal. PV designers calculate maximum voltage at the coldest expected temperature and keep it within ratings.
What 380 V DC data centers taught the industry
DC distribution at about 380–400 V was trialed and deployed in a number of data centers and telecom facilities from the late 2000s onward. Lessons included:
- Efficiency gains were real but modest compared with high-efficiency AC UPS systems, because the AC alternatives also improved.
- Ecosystem breadth was the main barrier. IT equipment with DC inputs, DC-rated connectors, breakers and power strips were available from fewer suppliers than AC equivalents, which limited adoption.
- Safety and protection practices worked when designed properly, including midpoint grounding and touch-safe connectors.
The 800 V class today benefits from both lessons: rack roadmaps are creating an ecosystem from the start, and the protection and grounding approaches are borrowed from proven 400 V DC and 1,500 V PV practice.
How Keentel helps here: Keentel Engineering's teams have designed and studied PV, BESS and DC systems as well as data centers. We bring field lessons from 1,500 V renewable plants and DC distribution to AI data center projects, so owners avoid repeating known mistakes.
24. Monitoring, metering and the digital twin
What to measure
A high-voltage DC data center benefits from dense measurement:
- DC voltage and current at every rectifier, feeder, row busway and rack input, with DC-capable sensors.
- Insulation resistance of each pole to ground, continuously, through IMDs.
- Ground-fault current in midpoint grounding resistors.
- Temperatures of busway joints, connectors and tap-off units, through fixed sensors or periodic thermography.
- Power quality on the AC side: harmonics, flicker, voltage sags and swells, frequency.
- Rectifier and converter status: efficiency, temperatures, alarms and event logs.
- Storage status: state of charge, state of health, cell temperatures and alarms.
- Protection events: time-stamped trip records from breakers, SSCBs and relays, with waveform capture where available.
Revenue and sub-metering
DC energy metering is less mature than AC metering. If the site bills tenants or allocates energy cost, the metering accuracy, DC meter certification and calibration should be planned from the start. Many sites meter on the AC side of each rectifier and allocate using DC measurements.
Digital twin
A calibrated model of the DC network, fed by live measurements, can track losses, predict thermal hot spots, test protection changes before they are made and support operations during abnormal conditions. Building the model during design and calibrating it during commissioning makes it a valuable operations tool.
How Keentel helps here: Keentel Engineering specifies DC monitoring and metering systems and builds network models that can be maintained as operational digital twins, linking design studies to day-to-day operations.
25. Common mistakes in voltage-class decisions
- Comparing only conductor loss. End-to-end efficiency, dominated by conversion, decides the energy outcome.
- Using nominal instead of maximum voltage. Equipment ratings and code thresholds apply to maximum system voltage, including regulation tolerance and battery float.
- Ignoring the grounding configuration. ±400 V and 0/800 V are very different for insulation and touch voltage; so are ±750 V and 0/1,500 V.
- Assuming AC products work on DC. Breakers, switches, fuses and meters rated for AC may have no DC rating or a much lower one.
- Assuming PV listings cover data center use. They may, but only if the listing scope, ratings and application align and the AHJ agrees.
- Overlooking the rack converter. Its efficiency, density, reliability and availability at each input voltage may decide the whole comparison.
- Ignoring circuit time constants. DC device ratings depend on L/R, and data center buses with long busways and large inductances may exceed them.
- Leaving out stored energy. Hundreds of rack input capacitors and storage systems change both fault behavior and maintenance safety.
- Underestimating workforce and procedures. A 1,500 V system needs 1,500 V-rated tools, PPE and qualified people from day one.
- Forgetting the utility. Rectifier behavior during grid faults, harmonics and AI load swings are interconnection issues regardless of DC voltage.
- Not baselining MV AC. For campus distances, MV AC distribution to each hall is often the strongest alternative.
- Not documenting assumptions. Products and codes are changing quickly; a decision record lets the team revisit the choice when they do.
How Keentel helps here: Keentel Engineering's independent design reviews check for each of these mistakes, whether we are the designer of record or reviewing another firm's design for an owner, developer or lender.
26. Commissioning and testing
DC distribution systems need a commissioning plan that adds DC-specific tests to familiar AC practice:
- Insulation resistance testing of busways, cables and switchgear, pole to pole and pole to ground, with test voltages appropriate to the system voltage. Equipment rated for 1,500 V needs higher test voltages than 800 V.
- DC withstand (hipot) testing of busways and assemblies as required by the manufacturer and standards.
- Polarity verification at every connection point, including rack inputs. A polarity error on a DC bus can destroy converters.
- Grounding verification, including midpoint grounding resistors, IMD settings and alarm functions, and ground-fault location systems.
- Protective device testing: breaker and SSCB trip tests, settings verification and coordination checks.
- Rectifier commissioning: AC-side protection, pre-charge, voltage regulation, current sharing between paralleled units, current limit and fault behavior.
- Load bank testing at multiple load levels to verify voltage regulation, efficiency and thermal performance.
- Storage integration tests: transfer, ride-through and load-smoothing functions.
- Thermography of busways, joints and connectors under load.
- Integrated systems testing (IST), simulating utility failures, rectifier failures, breaker trips and maintenance scenarios.
- Arc-flash label verification against the as-built protective device settings.
How Keentel helps here: Keentel Engineering develops and witnesses DC commissioning plans, from factory acceptance tests of rectifiers and switchgear to site acceptance tests, protective device testing and integrated systems testing. Our protection and testing engineers bring the same discipline we apply to MV switchgear SAT to the DC side.
27. Design checklist
Use this list at the start of every high-voltage DC data center design:
- Define the DC boundary: where the rectifier output begins and where the rack converter input ends.
- Choose the voltage class: 800 V, 1,500 V or hybrid, with the decision matrix documented.
- Choose the grounding configuration: unipolar or bipolar, solid, HRG or ungrounded with IMD.
- Set the maximum system voltage, including regulation tolerance and battery float, and confirm it against code thresholds and equipment ratings.
- Select the rectifier technology: AFE, multi-pulse or SST, and its AC supply voltage.
- Size conductors and busways for ampacity, voltage drop, short-circuit withstand and life-cycle loss.
- Model end-to-end efficiency with manufacturer data at a weighted load profile.
- Perform DC short-circuit studies with capacitor, rectifier and battery contributions.
- Develop the DC protection scheme with selectivity at microsecond and millisecond scales.
- Perform DC arc-flash studies and plan mitigation.
- Define shock boundaries, ESWC procedures and stored-energy discharge.
- Confirm listings and AHJ acceptance for every major product.
- Integrate storage with fault, fire safety and ride-through analysis.
- Coordinate with the utility on large-load requirements, harmonics and models.
- Allocate heat and space with the mechanical design.
- Plan commissioning with DC-specific tests.
- Plan training and spares for the voltage class chosen.
How Keentel helps here: Keentel Engineering can take ownership of every item on this list, or supplement an existing design team on the items where specialist DC experience is needed.
28. Writing the specification: what to ask suppliers
Whichever voltage class is chosen, the procurement documents determine whether the design intent survives. The following items should appear in specifications for DC data center equipment. They also make bids comparable across voltage classes if the owner is still deciding.
System definition
- Nominal, minimum and maximum system voltage, including regulation tolerance, droop, transients and the maximum voltage during storage charging or float.
- Grounding configuration and the maximum voltage to ground under normal and first-fault conditions.
- Prospective fault current and circuit time constant at each point of connection, from the DC short-circuit study.
- Environmental conditions: ambient temperature, humidity, altitude, pollution degree and, for liquid-cooled racks, the potential for leaks near DC equipment.
Rectifiers
- Efficiency curves at 10%, 25%, 50%, 75% and 100% load, at nominal and extreme AC input voltages, measured to a stated test method.
- AC input harmonics at each load level, for the IEEE 519 study.
- Ride-through performance for AC voltage sags and interruptions of defined depth and duration.
- Output regulation, droop and current-sharing characteristics, current limit and short-circuit behavior.
- Controls interface for supervisory control, storage coordination and utility ramp-rate limits.
- Models for load-flow, short-circuit, dynamic and EMT studies, with validation data.
- Listings and the standards under which they were obtained.
DC switchgear, busway and protective devices
- DC voltage, current and interrupting ratings, with the time constant at which each DC rating applies.
- Short-circuit withstand ratings for busway and switchgear bus at the actual prospective fault current.
- Pole configuration for breakers, including series-pole arrangements needed to reach the DC voltage rating.
- Clearing times and current-limiting characteristics for fuses and SSCBs, and conduction loss for SSCBs.
- Isolation provisions, lockable disconnects and visible-break capability.
- Arc-flash mitigation features, remote operation and maintenance modes.
- Listings and their scope, especially for products originally listed for PV or BESS.
Rack converters and power shelves
- Efficiency curves across the input voltage window and load range.
- Input voltage window, transient tolerance and behavior at the window limits.
- Isolation rating, creepage and clearance, and PD test results for 1,500 V products.
- Input capacitance, pre-charge method and inrush limits.
- Fault contribution and internal protection.
- Hot-swap interlocks and connector ratings for make and break under load.
- Reliability data: FIT rates, derating policy for semiconductors (including cosmic-ray derating) and field history.
Energy storage
- UL 9540 listing and UL 9540A test data, and NFPA 855 compliance approach.
- String voltage range across state of charge and temperature.
- Prospective fault current and battery-side protection.
- Interface converter performance for ride-through and load smoothing.
Documentation and testing
- Factory acceptance tests with witness points, including DC withstand, PD where applicable, protection functions and efficiency verification.
- Site acceptance tests and integration testing support.
- Operation and maintenance manuals with DC-specific safety procedures, discharge times and test equipment requirements.
How Keentel helps here: Keentel Engineering writes DC equipment specifications, evaluates bids against a common technical and efficiency baseline and witnesses factory and site acceptance testing as the owner's engineer, so the equipment delivered is the equipment the design assumed.
29. Fire protection and the liquid-cooled hall
DC equipment near liquid
Most high-density AI racks are liquid cooled, with coolant distribution units, manifolds and quick disconnects in or near the racks, and in many halls overhead or underfloor piping running alongside the DC busway. A coolant leak onto energized DC equipment can create a conductive path, a ground fault or a sustained arc. Design measures at either voltage class include:
- Physical separation of busway and piping, or piping routed below busways so drips cannot fall onto them.
- Drip shields and barriers over tap-off units and rack power connections.
- Leak detection with alarms and, where justified, automatic isolation of the affected circuit.
- Insulation monitoring that detects the drop in insulation resistance caused by moisture before it becomes a fault.
- Dielectric coolants in some designs, with their own compatibility and fire-safety considerations.
At 1,500 V, a conductive film of liquid is more likely to sustain a surface arc and creepage distances are larger, so these measures carry more weight.
Fire detection and suppression
DC arcs can ignite insulation and plastics, and batteries add a thermal runaway hazard. Fire protection for DC data center spaces should consider:
- Early detection with aspirating smoke detection in electrical rooms, busway spaces and battery rooms.
- Arc-fault detection where available, to trip the circuit before an arc becomes a fire.
- Suppression compatible with energized DC equipment, recognizing that water-based systems may not de-energize the hazard and that clean-agent systems need enclosure integrity.
- Battery-specific measures from NFPA 855 and UL 9540A results, including spacing, ventilation and explosion control where needed.
- Emergency shutdown that isolates rectifiers and storage and discharges or isolates stored energy, with clear signage for first responders.
First responders
Firefighters are trained for AC electrical hazards and increasingly for PV and BESS. A data center DC bus at 800 V or 1,500 V, with batteries that cannot be de-energized, needs clear labeling, pre-incident plans, emergency shutdown procedures and coordination with the local fire department.
How Keentel helps here: Keentel Engineering coordinates DC electrical design with fire protection engineers and mechanical designers, reviews leak and arc hazards in liquid-cooled halls and prepares emergency shutdown and first-responder documentation for DC systems and storage.
30. The decision on one page
If you remember only a few things from this guide, make them these:
- Physics: 1,500 V carries 53% of the current and loses 28% of the conductor heat of 800 V in the same conductor. Those numbers are correct.
- System efficiency: conversion stages dominate. A fraction of a point in rack converter or rectifier efficiency outweighs the busway savings over typical in-hall distances.
- Distance: 1,500 V earns its place on long runs. At a fixed current density of 1.6 A/mm² the loss difference is about 0.4 points per 100 m, and a hybrid backbone with a 1% intermediate stage breaks even at about 250 m.
- Scale: as racks approach 1 MW, 800 V row currents reach 10,000 A per 8 MW row and push busway, connector and breaker ratings to their limits. 1,500 V keeps rows within single-device ratings.
- Grounding: ±400 V and ±750 V keep voltage to ground below 1,000 V; the choice of solid, high-resistance or ungrounded operation decides insulation, protection and continuity.
- Protection: DC has no current zero, capacitor discharge rises in microseconds and arcs are easier to sustain at 1,500 V. Fast, current-limiting protection is essential at both voltages.
- Codes and listings: 800 V sits comfortably below the low-voltage DC thresholds. 1,500 V sits at the threshold, so its maximum system voltage must be controlled, and many products are listed for PV and BESS rather than data centers.
- Safety: NFPA 70E places 800 V and 1,500 V in different DC shock-approach rows, with larger boundaries and higher-rated tools and PPE at 1,500 V.
- Ecosystem and schedule: 800 V has the momentum of industry rack roadmaps and multiple suppliers. 1,500 V has a mature PV and BESS ecosystem upstream but an early one at the rack.
- Answer: for most near-term AI halls, 800 VDC. For very large campuses, long backbones and large storage, 1,500 VDC or a hybrid deserves a serious study. Always baseline against MV AC to each hall.
How Keentel helps here: Keentel Engineering can turn this one page into a project-specific decision, with studies, models and documentation that stand up to owners, lenders, utilities and AHJs.
Part C — Three Short Anonymous Scenarios
The scenarios below are composites drawn from the kinds of questions owners and developers bring to Keentel Engineering. Names, locations and identifying details are omitted, and numbers are rounded and illustrative.
Scenario 1: a 60 MW retrofit hall on an existing campus
An owner planned to convert an existing hall to liquid-cooled AI racks of about 150 kW, with first racks needed within 18 months. The hall already had 13.8 kV distribution and 480 V unit substations, and the longest run from the electrical room to the farthest row was about 70 m.
The owner's team had seen the 1,500 V loss numbers and asked whether they should skip 800 V entirely. Keentel's study showed:
- Distribution savings at 1,500 V of about 0.3 percentage points at full load over the 70 m runs, or roughly $80,000 per year at the owner's energy price.
- A rack converter efficiency gap of 0.5–0.8 points in the bids available at the time, which more than offset the distribution savings.
- Existing 480 V unit substations that could feed 800 V AFE rectifiers directly, while 1,500 V would have required new transformers with dedicated secondaries.
- Listed 800 V products from several suppliers, compared with one supplier offering 1,500 V rack equipment, then without a data center listing.
The owner chose an 800 V system with ±400 V midpoint high-resistance grounding, insulation monitoring and current-limiting protection at each rack. The decision record identified the conditions under which a later hall should revisit 1,500 V.
Lesson: for short in-hall distances and tight schedules, the ecosystem and the rack converter efficiency outweigh the conductor savings.
Scenario 2: a greenfield multi-hall campus with a central energy plant
A developer planned a campus of four halls of about 200 MW each, with a central rectifier and storage plant intended to serve two halls through a DC backbone of about 400 m, alongside conventional 34.5 kV AC distribution to the other halls. The developer wanted to use utility-scale 1,500 V BESS for ride-through and load smoothing.
Keentel compared three options for the two DC-served halls: all-800 V from the central plant, all-1,500 V and a 1,500 V backbone feeding 800 V halls through intermediate DC/DC converters. Findings:
- The 400 m backbone at 800 V would have needed very large busway or cable sets and lost about 3% at the chosen current density.
- The hybrid reduced backbone loss by more than 1.5 points, exceeding the 1–1.2% loss of the intermediate converters, and integrated the 1,500 V BESS directly on the backbone.
- The intermediate converters also limited fault current into each hall, reducing arc-flash energy on the 800 V side.
- Compared with 34.5 kV AC to each hall, however, the hybrid was close on efficiency and more expensive, and its value rested mainly on the BESS integration and the central plant concept.
The developer adopted the hybrid for the central-plant halls as a pilot and kept 34.5 kV AC distribution with hall-level 800 V rectifiers for the remaining halls.
Lesson: 1,500 V earns its place on long backbones and with large storage; the comparison must include MV AC as a baseline.
Scenario 3: protection and arc flash on a 1,500 V pilot
An operator built a small 1,500 V pilot row using PV-listed breakers and a BESS-derived rectifier. The commissioning team asked Keentel to review the protection and labeling before energization. Keentel found:
- Breakers applied with series poles that met the voltage rating, but the circuit time constant at the main bus exceeded the time constant at which the breaker's DC rating was established.
- Rack converter input capacitance across the row that could deliver a very fast discharge into a busway fault, peaking before the mechanical breakers could respond.
- Arc-flash labels that had been based on an AC-style calculation and did not reflect DC arc sustainability at 1,500 V.
- Test equipment in the field kit rated only for 1,000 V.
The fixes included current-limiting fuses at each tap-off, a revised main breaker selection, a DC arc-flash study with the maximum power method and enclosure factors, updated labels and new test equipment rated for the voltage. The AHJ accepted the pilot after reviewing the revised documentation.
Lesson: at 1,500 V, borrowed PV and BESS products can work, but every rating, time constant and procedure must be checked against the data center application.
Part D — Frequently Asked Questions
The questions below are the ones owners, designers, operators and inspectors ask most often about 800 VDC and 1,500 VDC distribution. Each answer stands on its own, so some points from Parts A and B are repeated where they are needed to answer the question completely.
1. Why are AI data centers moving to high-voltage DC at all?
Because rack power has grown by an order of magnitude. At 400 kW, a 415 V AC rack feed would draw about 556 A per phase, and a 54 V DC rack bus would carry about 7,400 A. Those currents need enormous copper, create large losses and leave little room in the rack for compute. Distributing at 800 V or 1,500 V DC cuts current to 500 A or 267 A for the same power, removes the AC power supplies from the servers and eliminates one or more conversion stages. High-voltage DC also integrates naturally with battery storage and can simplify ride-through. The result is a power chain that is smaller, simpler and potentially more efficient, provided the conversion stages, protection and safety are engineered well.
2. Is 1,500 VDC always more efficient than 800 VDC?
No. At the same power, 1,500 V reduces current by about 47% and conductor loss in the same conductor by about 72%. But conductor loss is a small part of the total loss between the utility and the chip. The rectifier and the rack DC/DC converter usually lose several times more than the busway. Today, rack converters for a 1,500 V input generally need higher-voltage semiconductors or stacked topologies, and may be slightly less efficient than 800 V converters. Over short in-hall distances, that converter penalty can exceed the busway savings. Over long backbones, 1,500 V usually wins. The only reliable answer comes from an end-to-end efficiency model using real product data at a realistic load profile.
3. Where exactly is the "DC voltage boundary"?
The high-voltage DC distribution segment begins at the output of the AC/DC rectifier and ends at the input of the rack DC/DC converter. Upstream of the rectifier is conventional 60 Hz AC: utility service at 138–345 kV, MV distribution at 13.8 or 34.5 kV and LV at 480 V or a dedicated secondary. Downstream of the rack converter is low-voltage DC at 48–54 V and below. The 800 V versus 1,500 V decision affects only the segment between these points and the equipment at each end, which helps keep the decision focused.
4. Why do the numbers show 500 A and 267 A for a 400 kW rack?
They come straight from I = P/V. 400,000 W divided by 800 V is 500 A. 400,000 W divided by 1,500 V is 266.7 A, usually rounded to 267 A. The ratio is 0.533, so 1,500 V draws about 47% less current. These are DC currents at the rack feeder. Allow for converter efficiency: if the rack's 400 kW is measured at the 54 V output, the input power and current are slightly higher, for example about 408 kW and 510 A at 800 V for a 98% efficient converter.
5. Is the 72% loss reduction real?
Yes, for the same conductor. Loss is I²R, and the current ratio is 0.533, so the loss ratio is 0.533² = 0.284, about 72% lower. The figure applies only if the conductor is unchanged. In practice designers will use smaller conductors at 1,500 V to save copper, which gives back some of the loss savings. At a fixed current density, for example, the loss fraction is 53% of the 800 V value, not 28%.
6. How much smaller can conductors be at 1,500 V?
It depends on what governs the size. For the same percentage loss, the area can be about 72% smaller. For ampacity-governed cable, which is common for short runs, the area is typically about 54–63% smaller, because cable ampacity does not rise in direct proportion to area. For busbars and busways sized at a fixed current density, the area is about 47% smaller. The "50–60% smaller" figure often quoted is a reasonable approximation for ampacity-governed cable but is not the equal-loss number.
7. How much copper does 1,500 V save on a real project?
For an illustrative 50 MW hall with 125 racks of 400 kW, each fed by a 60 m run at 1.6 A/mm², the copper is about 42 metric tons at 800 V and about 22 metric tons at 1,500 V. At roughly $10 per kilogram, the raw-metal difference is around $200,000, with additional installed-cost savings in raceways, supports and labor. That is meaningful but rarely decisive on a project of this size. On campus backbones hundreds of meters long, the savings are much larger.
8. Why does the rack DC/DC converter matter so much?
Because it carries every watt the GPUs use and typically loses 1.5–3% of it. A one-point difference in rack converter efficiency on a 50 MW hall is about 500 kW of loss and heat, roughly $300,000 per year in energy plus cooling. That is larger than the busway savings of 1,500 V in most in-hall designs. The converter also occupies rack space and its reliability directly affects compute availability. Converter efficiency, density and reliability at each input voltage should be central to the voltage-class decision.
9. Why is a 1,500 V rack converter harder to build?
The step-down ratio to 54 V is about 28:1 instead of about 15:1, and the primary-side semiconductors must block 1,500 V plus transients with derating for cosmic-ray reliability. That usually means 2,000–3,300 V class SiC devices, which have higher losses and cost per ampere than 1,200 V devices, or series-stacked topologies with voltage balancing. Isolation transformers must also be insulated for higher voltage with partial discharge control. These are engineering challenges rather than barriers, and the technology is improving, but they explain why 800 V rack converters are ahead today.
10. Can a 1,500 V system be fed from 480 V AC?
Possibly, but it is not a natural match. A six-pulse diode rectifier from 480 V produces only about 648 V DC. An active front end can boost to 1,500 V, but at a ratio of about 2.2 times the AC peak, with higher ripple current and device stress. Most 1,500 V systems follow PV and BESS practice and use a dedicated MV/LV transformer secondary, roughly 600–690 V AC for an AFE or about 1,100 V AC for a diode rectifier. By contrast, 800 V fits a 480 V AFE well, since the minimum DC bus for 480 V is about 679 V, or about 747 V at +10% high line.
11. What is the difference between 0/800 V and ±400 V?
Both have 800 V between the poles, so current and conductor loss are the same. In a 0/800 V unipolar system, one pole is grounded and the other is 800 V from ground. In a ±400 V bipolar system, the midpoint is grounded (solidly or through a resistance) and each pole is 400 V from ground. The bipolar system halves the normal voltage to ground, reducing insulation-to-ground requirements and touch voltage, and aligns with existing 380–400 V DC practice. The same logic applies to 0/1,500 V versus ±750 V.
12. Should the DC bus be grounded, high-resistance grounded or ungrounded?
Each has trade-offs. Solid grounding gives high ground-fault current, fast detection and controlled overvoltages, but every ground fault trips. High-resistance grounding and ungrounded systems with insulation monitoring allow operation to continue through a first ground fault while it is located, but the unfaulted pole rises to full pole-to-pole voltage relative to ground, so insulation must be rated for that. Many DC data center designs favor midpoint high-resistance grounding with insulation monitoring for continuity. The choice must be made early, because insulation, protection and safety design all depend on it.
13. How does the NEC treat 800 V and 1,500 V DC?
Recent NEC editions use "1000 volts ac, 1500 volts dc" as the threshold for the higher-voltage articles in many places, for example in the 2023 NEC Articles 235, 245, 305, 315 and 495. On that basis, 800 V DC is well within the low-voltage rules, and a nominal 1,500 V DC system sits exactly at the threshold. The maximum system voltage, including regulation tolerance and battery float, should be kept at or below the threshold and the equipment ratings. Always check the edition adopted in your jurisdiction and its local amendments, and confirm the interpretation with the AHJ.
14. Are there listed products for 1,500 V DC?
Yes, many, but mostly for PV and BESS. Examples include UL 489B molded-case breakers for PV up to 1,500 V DC, UL 248-19 PV fuses, PV wire rated 1,500 V or 2,000 V DC and UL 9540 energy storage systems. Their listings cover PV and storage applications. Using them on a data center DC bus requires checking that the listing, ratings and application match and getting AHJ acceptance. Data center products at 800 V are emerging faster because industry rack roadmaps have focused there.
15. What happens if a product is not listed for the application?
The AHJ may accept a field evaluation by a qualified evaluation body following NFPA 790 and NFPA 791, or may approve it based on engineering documentation and test reports. Field evaluation is practical for a few large custom items such as rectifier skids, but not for hundreds of rack power shelves. Engaging the AHJ early, with a clear compliance plan and product data, avoids late surprises at inspection.
16. How do DC breakers interrupt current without a current zero?
A mechanical DC breaker stretches and splits the arc into many short segments in an arc chute until the total arc voltage exceeds the system voltage. Current then falls to zero and the arc goes out. At 1,500 V, a higher arc voltage is needed, which means larger arc chutes or several poles in series per DC pole. Solid-state breakers turn off semiconductors in microseconds and dump the inductive energy into a varistor. Hybrid breakers combine a mechanical path for low conduction loss with a solid-state path for fast interruption.
17. Why are solid-state circuit breakers popular for DC?
Speed. Capacitor discharge current on a DC bus can rise at tens to hundreds of amperes per microsecond. Mechanical breakers take milliseconds, by which time the peak has passed. An SSCB can interrupt in microseconds, limiting fault current, reducing arc-flash energy and protecting converters. The trade-offs are conduction loss (often around 0.1–0.3% of throughput), the need for separate mechanical isolation and higher cost, especially at 1,500 V where higher-voltage devices or series stacks are needed.
18. Is arc flash worse at 1,500 V?
Not automatically. For the same power and the same per-unit source stiffness, fault current at 1,500 V is about half that at 800 V, and maximum-power arc energy is about the same. If a 1,500 V bus has the same fault current as an 800 V bus, incident energy nearly doubles. More importantly, DC arcs are much easier to sustain at 1,500 V, so designers should assume arcs will not self-extinguish. Clearing time remains the most powerful lever at either voltage.
19. How is DC arc flash calculated?
US practice uses methods referenced in NFPA 70E's informative annex: the maximum power method (which assumes the arc voltage is half the system voltage and current is half the bolted-fault current), and more detailed models such as Stokes and Oppenlander or Paukert, which use empirical arc characteristics. An enclosure factor, commonly 3, accounts for arcs in boxes. IEEE 1584-2018 covers AC only. Any DC arc-flash study should use fault currents from a proper DC short-circuit model and clearing times from the actual protective devices.
20. What are the shock approach boundaries for 800 V and 1,500 V?
In recent editions of NFPA 70E, the DC shock approach table places 800 V in the 300 V to 1 kV row and 1,500 V in the 1.1 kV to 5 kV row. Typical values are a limited approach boundary of about 1.0 m (3 ft 6 in) and a restricted approach boundary of about 0.3 m (1 ft) for the lower row, and about 1.5 m (5 ft) and 0.5 m (1 ft 5 in) for the higher row. Check the edition your organization has adopted. The larger boundaries at 1,500 V affect work procedures and sometimes layout.
21. How much energy is stored on a DC bus, and why does it matter?
Stored energy in a capacitor is ½CV². A rack shelf with 10 mF stores 3.2 kJ at 800 V; across hundreds of racks plus rectifier capacitors, the total can reach megajoules. That energy feeds faults within microseconds and remains after breakers open, so it is a hazard during maintenance. Designs need discharge circuits with known time constants, discharge labels, verification of absence of voltage with meters rated for the voltage and isolation of batteries, which cannot be discharged.
22. How does the voltage class affect battery storage?
Utility-scale BESS is built around 1,500 V DC strings, so a 1,500 V bus can connect to mature, UL 9540-listed systems with little voltage conversion. At 800 V, battery strings are shorter and products for data center buses are emerging. At both voltages, batteries are stiff fault sources that must be in the short-circuit study, and fire safety under UL 9540A, NFPA 855 and local fire codes governs siting. Storage on the DC bus also smooths AI load swings and supports ride-through, which utilities increasingly require.
23. What is a hybrid 1,500/800 V architecture?
A hybrid uses a 1,500 V backbone for long runs and storage, then intermediate DC/DC converters to feed 800 V row busways and racks. It captures low current on long distances while using the more mature 800 V rack ecosystem. The intermediate stage costs about 1–1.5% in loss plus capital and space. At a current density of 1.6 A/mm² and a 1% stage loss, the backbone must be longer than about 250 m one way for the hybrid to win on efficiency alone. It can also be justified by BESS integration, fault containment or copper savings.
24. Is MV AC distribution a better way to cover long distances?
Often, yes. At 13.8 kV or 34.5 kV, current is tiny compared with any LV DC system, and MV switchgear, cable and transformers are mature and well understood. Most campuses today distribute at MV AC to each hall and convert to DC within the hall. MV AC should always be the baseline in any comparison of DC backbones. DC backbones become attractive when they enable a central rectifier and storage plant or when SST and MV DC technologies mature.
25. Does the DC voltage class affect the utility interconnection?
Not directly. The utility sees the AC side of the rectifier plant. But the rectifier technology, storage and controls, which may differ between voltage classes, determine harmonics, ride-through, ramp rates and reactive power behavior, all of which the utility cares about. Large AI loads at 138–345 kV face increasing requirements for ride-through, ramp limits, harmonic compliance under IEEE 519 and validated dynamic and EMT models.
26. How does the choice affect harmonics and IEEE 519 compliance?
For the same power, harmonics depend on the rectifier technology rather than the DC voltage. AFE rectifiers draw near-sinusoidal current with high-frequency switching components; multi-pulse rectifiers cancel lower-order harmonics with phase-shifted windings. Both can meet IEEE 519-2022 limits at the point of common coupling with proper design. A harmonic study with frequency scans should check for resonances with cable capacitance and capacitor banks, especially on large campuses with low short-circuit ratios at the PCC.
27. What reliability risks are specific to 1,500 V?
Higher semiconductor voltage stress and cosmic-ray susceptibility, higher insulation stress with potential partial discharge, more persistent arcing at loose connections, more series components in stacked converters and breakers and less field history for data center products. Lower current reduces thermal stress on joints and conductors. Overall, the redundancy scheme usually affects availability more than the voltage class, but 1,500 V products need extra scrutiny of derating, PD testing and failure data.
28. What training do technicians need?
Qualified-person training under NFPA 70E for the voltage and DC hazards involved, including DC shock and arc-flash boundaries, ESWC procedures for DC, stored-energy discharge, battery hazards and the use of DC-rated test equipment. At 800 V, training can build on 480 V AC and 400 V DC practice. At 1,500 V, test equipment and PPE must be rated for the higher voltage, and the qualified workforce today is concentrated in PV and BESS.
29. How should commissioning differ for a DC data center?
Commissioning adds DC-specific tests to familiar AC practice: insulation resistance and DC withstand tests at voltages appropriate to the class, polarity verification at every connection, grounding resistor and insulation monitoring tests, rectifier pre-charge, regulation, current sharing and current-limit tests, protective device and SSCB trip tests, storage transfer and ride-through tests, thermography under load and integrated systems testing. Arc-flash labels should be verified against as-built settings.
30. Which voltage class should we choose?
For most AI halls being designed for energization in the next few years, with rack power up to a few hundred kilowatts and in-hall distances under about 100 m, 800 VDC is the lower-risk choice because of its ecosystem, its natural fit with 480 V AC and its position comfortably below the 1,000 V lines in codes and safety rules. 1,500 VDC is attractive for very large campuses, long backbones and large storage integration, and as products mature its share is likely to grow. A hybrid can combine both. The best choice for any specific project comes from a documented study of distances, efficiencies, protection, codes, schedule and cost.
How Keentel Engineering Helps
Keentel Engineering is a US power system engineering firm that plans, designs, studies and commissions electrical systems for data centers, utilities, independent power producers, industrial plants and campuses, from 4 kV distribution to 765 kV transmission. For high-voltage DC data center power distribution at 800 V, 1,500 V or both, our services include:
- DC architecture studies: independent comparison of 800 VDC, 1,500 VDC, hybrid and MV AC options, with end-to-end efficiency models, copper and cost estimates, reliability analysis and a documented decision matrix.
- DC short-circuit and fault studies: rectifier, capacitor, battery and busway models using IEEE 946 and IEC 61660-1 methods plus EMT simulation, reporting peak current, rate of rise, time constant and quasi-steady fault current at every bus.
- DC protection coordination: breaker, fuse, SSCB and hybrid breaker selection and settings, selectivity at microsecond and millisecond scales, and verification of DC ratings and time constants.
- DC arc-flash studies: NFPA 70E Annex D methods, labels, PPE guidance and mitigation options with before-and-after incident energy, coordinated with the AC arc-flash study.
- Grounding and insulation coordination: grounding configuration studies, grounding resistor and IMD specification, ground-fault location, transient overvoltage analysis, SPD coordination and clearance, creepage and PD review.
- NEC, UL and AHJ compliance: code analysis for the adopted NEC edition, listing review for every major product, field evaluation support and early AHJ engagement.
- Electrical safety programs: DC shock and arc-flash boundaries, ESWC and LOTO procedures, stored-energy discharge and qualified-person training content.
- Utility interconnection and large-load studies: load-flow, short-circuit, dynamic and EMT studies, ride-through and ramp-rate analysis, model development and validation, and coordination with transmission owners and system operators at 138 kV, 230 kV, 345 kV and above.
- IEEE 519 harmonic studies: harmonic load flow, frequency scans, resonance analysis and filter or rectifier specification.
- EMT modeling: rectifier and converter controls, AI load swings, storage ride-through and DC fault transients.
- Energy storage integration: DC-coupled BESS design, UL 9540 and NFPA 855 compliance support and fault contribution analysis.
- Owner's engineer services: design review, specification development, bid evaluation against a common efficiency and reliability baseline and construction support.
- Commissioning and testing: FAT and SAT witnessing, protective device testing, insulation and withstand testing plans and integrated systems testing.
- Substation and MV design: customer substations, MV switchgear, unit substations and transformer specification, including specialized secondaries for rectifier service.
Why Clients Choose Keentel
- The whole chain under one roof: from the 345 kV interconnection to the rack converter input, one team owns the system, so nothing falls between the AC and DC disciplines.
- Independent advice: we are not tied to any equipment supplier, so voltage-class and product recommendations follow the engineering and the owner's priorities.
- US standards fluency: daily work with NEC, NFPA 70E, NESC, IEEE, UL, NERC and FERC requirements.
- Studies that become design decisions: auditable calculations, clear models and documented trade-offs that owners, lenders and AHJs can follow.
- Field experience: the engineers who write the protection settings also support testing and commissioning.
- Full voltage range: from 4.16 kV plant distribution to 765 kV transmission substations, plus LV AC and high-voltage DC inside the data hall.
Talk to an Engineer
Deciding between 800 VDC and 1,500 VDC, planning a hybrid backbone or facing a DC protection, arc-flash or AHJ question on an AI data center? Keentel Engineering can review your design basis and deliver a documented, site-specific answer.
- Phone: (813) 389-7871
- Email: contact@keentelengineering.com
- Book a 15-minute call: calendly.com/keentel-engineering/15min
References
- NFPA 70, National Electrical Code, 2023 edition, including Articles 100, 110, 240, 250, 645, 690, 706, 712, 235, 245, 305, 315 and 495. Confirm the edition and amendments adopted by the authority having jurisdiction.
- NFPA 70E, Standard for Electrical Safety in the Workplace, including the DC shock approach boundary table and informative annex on DC arc-flash calculation methods.
- NFPA 790 and NFPA 791, field evaluation of electrical equipment.
- NFPA 855, Standard for the Installation of Stationary Energy Storage Systems.
- IEEE Std 519-2022, IEEE Standard for Harmonic Control in Electric Power Systems.
- IEEE Std 946, IEEE Recommended Practice for the Design of DC Power Systems for Stationary Applications.
- IEEE Std 1584-2018, IEEE Guide for Performing Arc-Flash Hazard Calculations (AC systems).
- IEEE Std C37.14, IEEE Standard for DC Power Circuit Breakers Used in Enclosures.
- IEEE Std 1709, IEEE Recommended Practice for 1 kV to 35 kV Medium-Voltage DC Power Systems on Ships.
- IEC 60664-1, Insulation coordination for equipment within low-voltage supply systems.
- IEC 61660-1, Short-circuit currents in DC auxiliary installations in power plants and substations.
- IEC 60364 series, Low-voltage electrical installations.
- UL 489 and UL 489B, molded-case circuit breakers, including those for PV systems.
- UL 1066, low-voltage AC and DC power circuit breakers used in enclosures.
- UL 248 series, low-voltage fuses, including UL 248-19 for PV fuses.
- UL 857, busways; UL 891, switchboards.
- UL 62368-1, audio/video, information and communication technology equipment safety.
- UL 1741, inverters, converters and controllers for distributed energy resources.
- UL 1973, UL 9540 and UL 9540A, batteries and energy storage systems.
- UL 4703, photovoltaic wire.
- R. F. Ammerman, T. Gammon, P. K. Sen and J. P. Nelson, "DC-Arc Models and Incident-Energy Calculations," IEEE Transactions on Industry Applications, 2010.
- D. R. Doan, "Arc Flash Calculations for Exposures to DC Systems," IEEE Transactions on Industry Applications, 2010.
- A. D. Stokes and D. K. Oppenlander, "Electric Arcs in Open Air," Journal of Physics D: Applied Physics, 1991.
- OSHA 29 CFR 1910 Subpart S, Electrical.
- NERC, reliability assessments and guidance on large loads and computational load behavior.
- Keentel Engineering, companion technical blogs: 800 VDC rack fault protection, 800 VDC AI data center UPS architectures, 800 VDC power for chillers, CDUs and racks, the LVDC data center framework, the 1 GW data center explained, data center rack engineering, harmonics and IEEE 519, and data center load calculations.
Disclaimer
This article is for general technical information only. Worked examples, efficiencies, clearances, boundaries and costs use illustrative values and simplified assumptions; they are not design values for any specific installation. Product ratings, listings and efficiencies vary by manufacturer and model, so always confirm them in the manufacturer's documentation and test data. Codes and standards are cited as of publication and may be revised; confirm the current edition and its adoption by the authority having jurisdiction. High-voltage DC systems must be designed, studied and approved by qualified engineers using site-specific data, and work on or near them must follow the employer's electrical safety program.
© Keentel Engineering
| Office | Address | Phone |
|---|---|---|
| Head Office — Tampa | 400 N Ashley Dr STE #2600, Tampa FL 33602 | (813) 389-7871 |
| Austin | 5900 Balcones Drive STE 100, Austin TX 78731 | (512) 591-0752 |
| Sacramento | 1401 21st St Ste R, Sacramento CA 95811 | (916) 913-4524 |
| Baltimore | 306 W Redwood St STE 200, Baltimore MD 21201 | (410) 225-2181 |

About the Author:
Sandip "Sonny" R. Patel, P.E.
IEEE Senior Member · Founder & CEO, Keentel Engineering
In 1995, Sonny Patel earned his Electrical Engineering degree from the University of Illinois. But degrees don't build legacies — action does.
For three decades, he has worked the power industry from every side of the table: 16 years as a utility engineer at Exelon/Commonwealth Edison; generation leadership across hydroelectric, industrial steam turbine, and a 9 GW renewable fleet; NERC Regional Entity Senior Compliance Engineer and Audit Team Lead, auditing some of the nation's largest utilities; and testing and commissioning lead on equipment up to 765 kV — the very top of the North American grid.Utility. Generator. Regulator. Consultant. Few engineers have seen all four seats. Fewer still have sat in them.
His experience spans nuclear, hydro, conventional generation, renewables, oil and gas, mining — and today's data centers, where he is authoring a three-book series on data center design. He is a Licensed Professional Engineer in six states and a Licensed Electrical Contractor in Florida (Unlimited EC) — he doesn't just design the work; he's qualified to stand behind its execution.Today, as Founder and CEO of Keentel Engineering, Sonny leads a nationwide team of engineers delivering substation design, power system studies, NERC compliance, and commissioning — done right, coast to coast.Three decades. Every side of the table. One standard: accountable engineering.
Services

Let's Discuss Your Project
Let's book a call to discuss your electrical engineering project that we can help you with.
About the Author:
Sandip "Sonny" R. Patel, P.E.
IEEE Senior Member · Founder & CEO, Keentel Engineering
In 1995, Sonny Patel earned his Electrical Engineering degree from the University of Illinois. But degrees don't build legacies — action does.
For three decades, he has worked the power industry from every side of the table: 16 years as a utility engineer at Exelon/Commonwealth Edison; generation leadership across hydroelectric, industrial steam turbine, and a 9 GW renewable fleet; NERC Regional Entity Senior Compliance Engineer and Audit Team Lead, auditing some of the nation's largest utilities; and testing and commissioning lead on equipment up to 765 kV — the very top of the North American grid.
Utility. Generator. Regulator. Consultant. Few engineers have seen all four seats. Fewer still have sat in them.
His experience spans nuclear, hydro, conventional generation, renewables, oil and gas, mining — and today's data centers, where he is authoring a three-book series on data center design. He is a Licensed Professional Engineer in six states and a Licensed Electrical Contractor in Florida (Unlimited EC) — he doesn't just design the work; he's qualified to stand behind its execution.
Today, as Founder and CEO of Keentel Engineering, Sonny leads a nationwide team of engineers delivering substation design, power system studies, NERC compliance, and commissioning — done right, coast to coast.Three decades. Every side of the table. One standard: accountable engineering.
Leave a Comment
Thank you for contacting us.
We will get back to you as soon as possible.
We will get back to you as soon as possible.
Oops, there was an error sending your message.
Please try again later.
Please try again later.
Related Posts
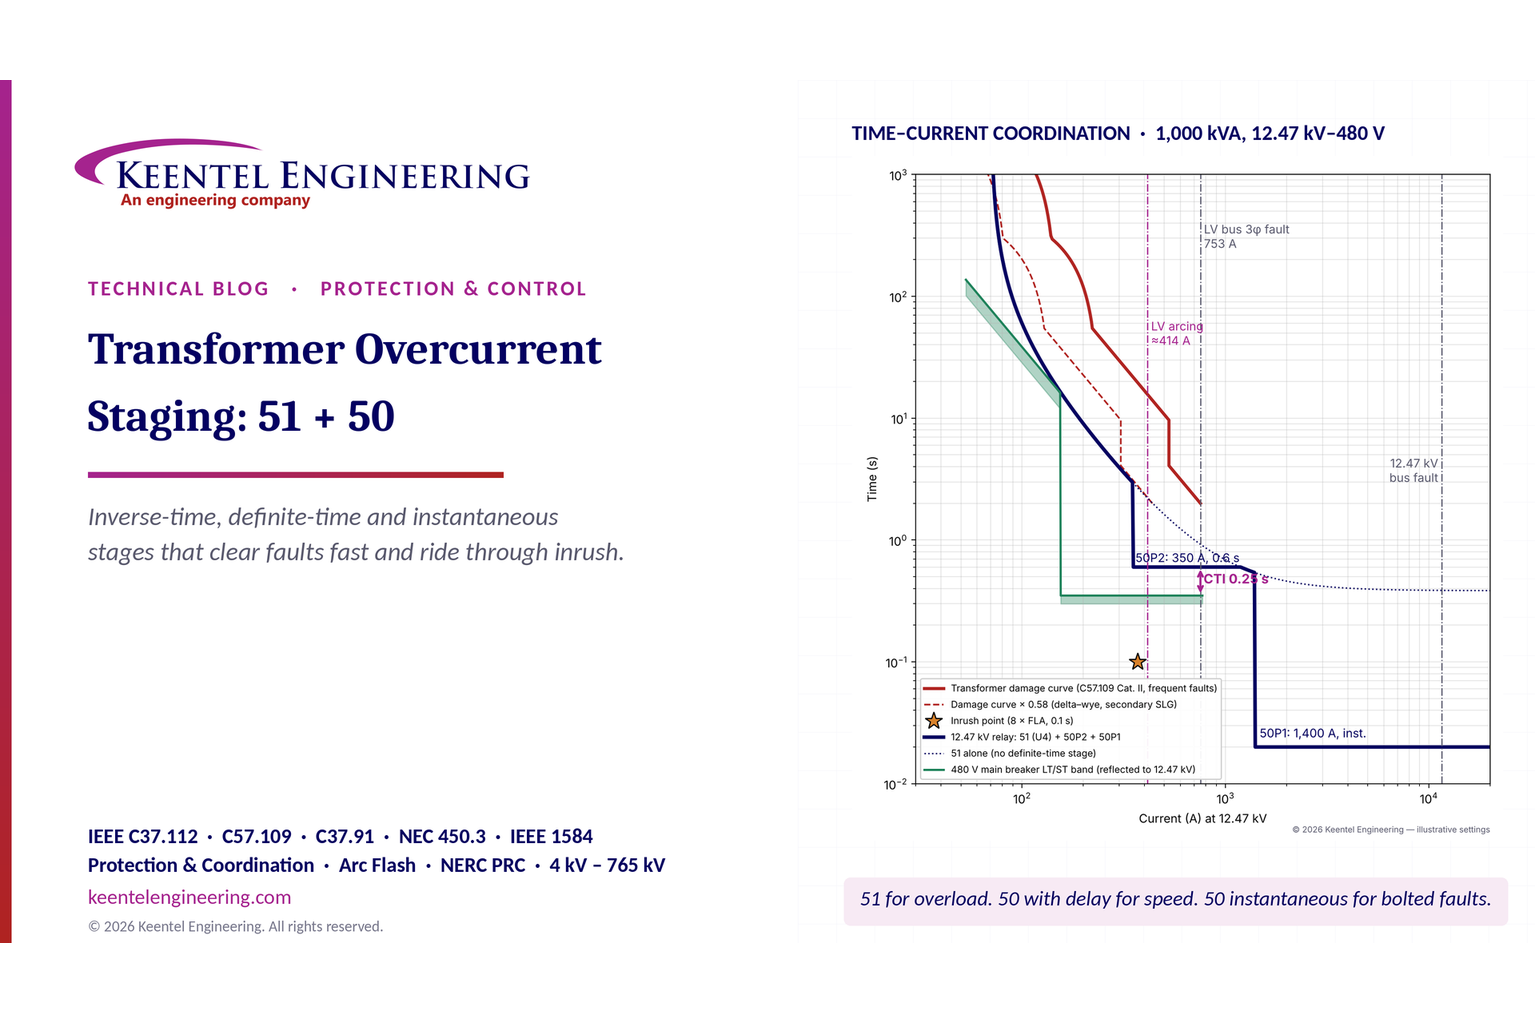
By SANDIP R PATEL
•
November 12, 2026
Learn transformer overcurrent protection using 50/51 relay stages, inverse-time curves, inrush checks, fault coordination and arc-flash mitigation.
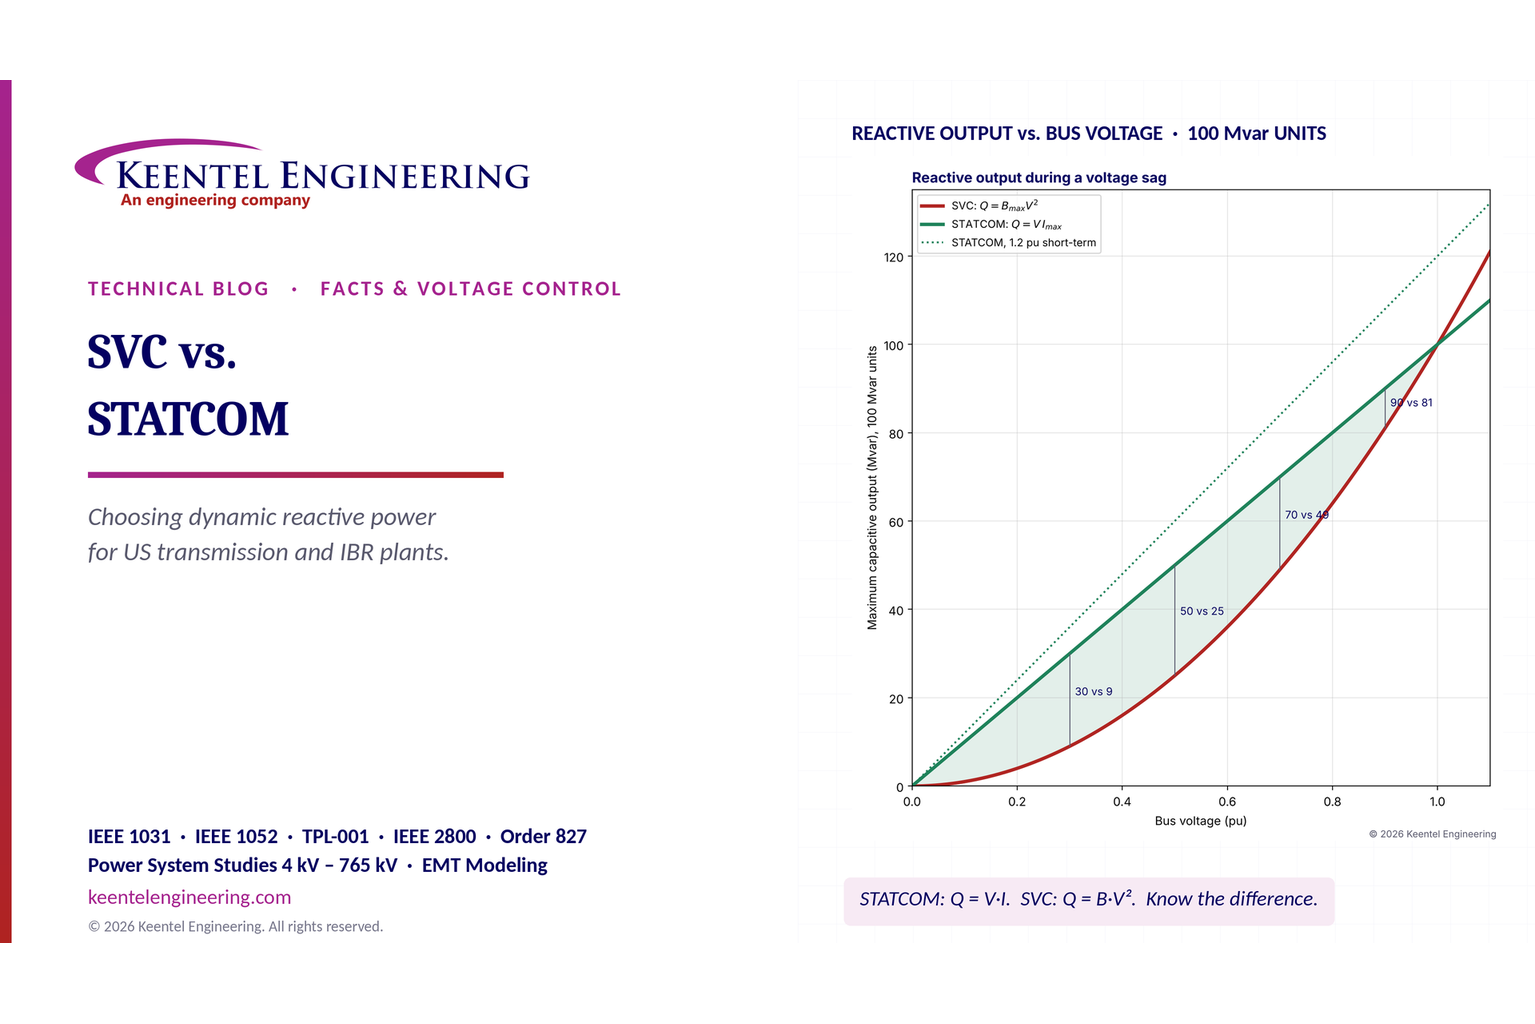
By SANDIP R PATEL
•
November 12, 2026
Compare SVC vs. STATCOM for dynamic reactive power compensation, voltage stability, weak grids, response time, harmonics and transmission system design.
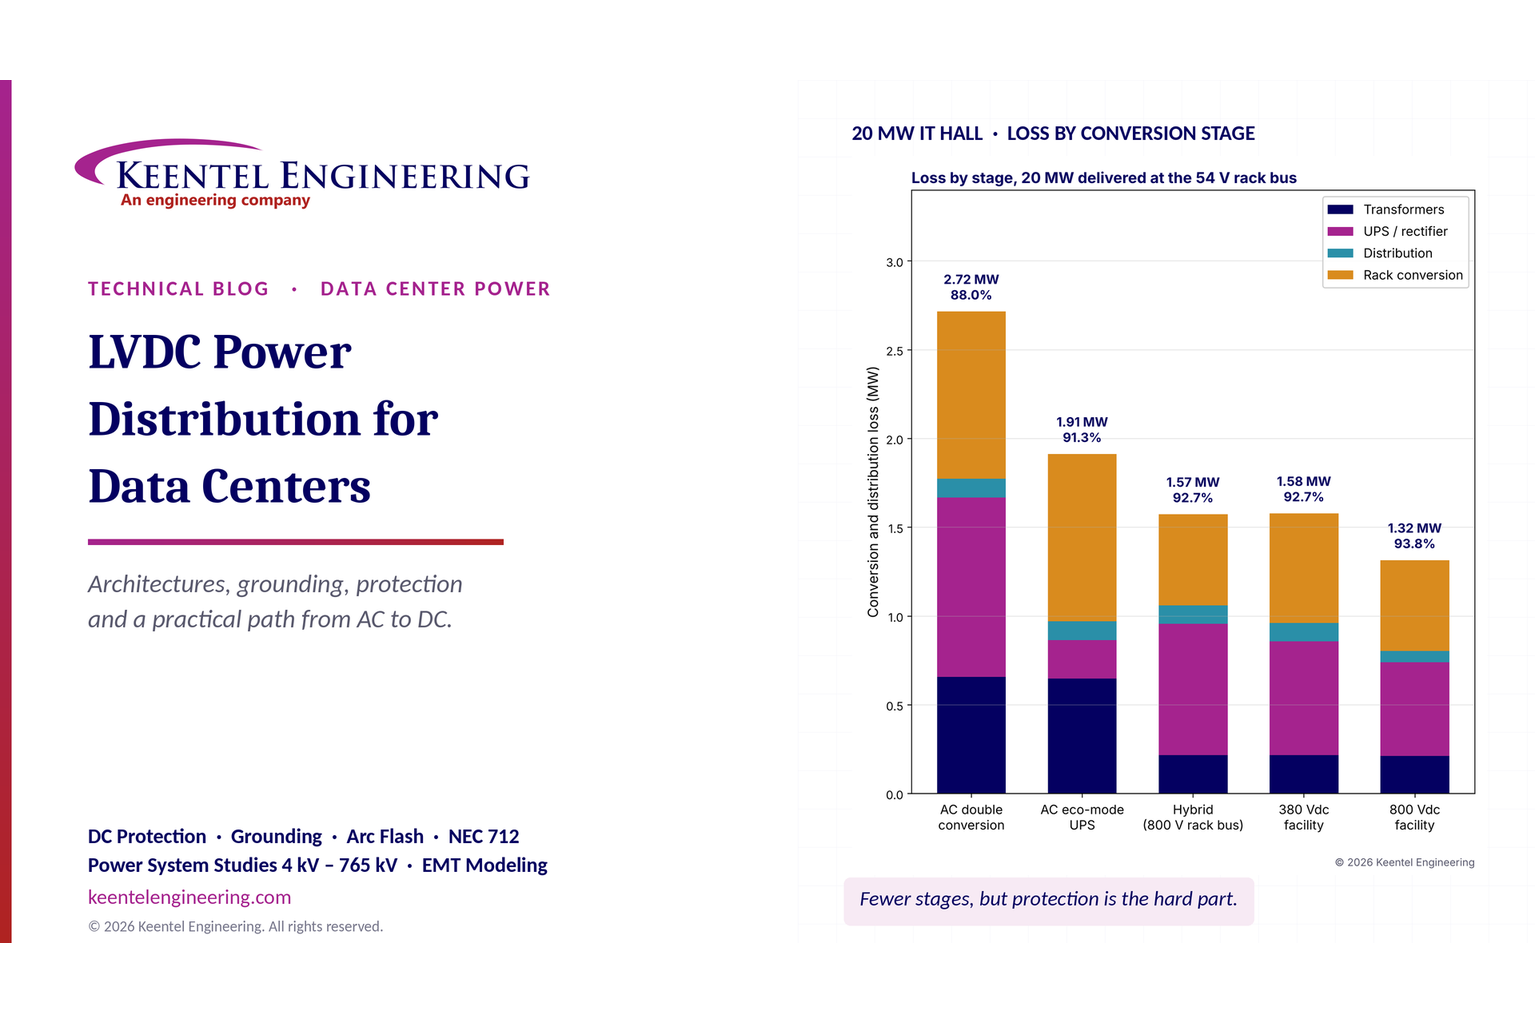
By SANDIP R PATEL
•
November 11, 2026
Explore LVDC power distribution for data centers, including 380V vs 800V DC, architecture, grounding, protection, UPS, energy efficiency and safety standards.
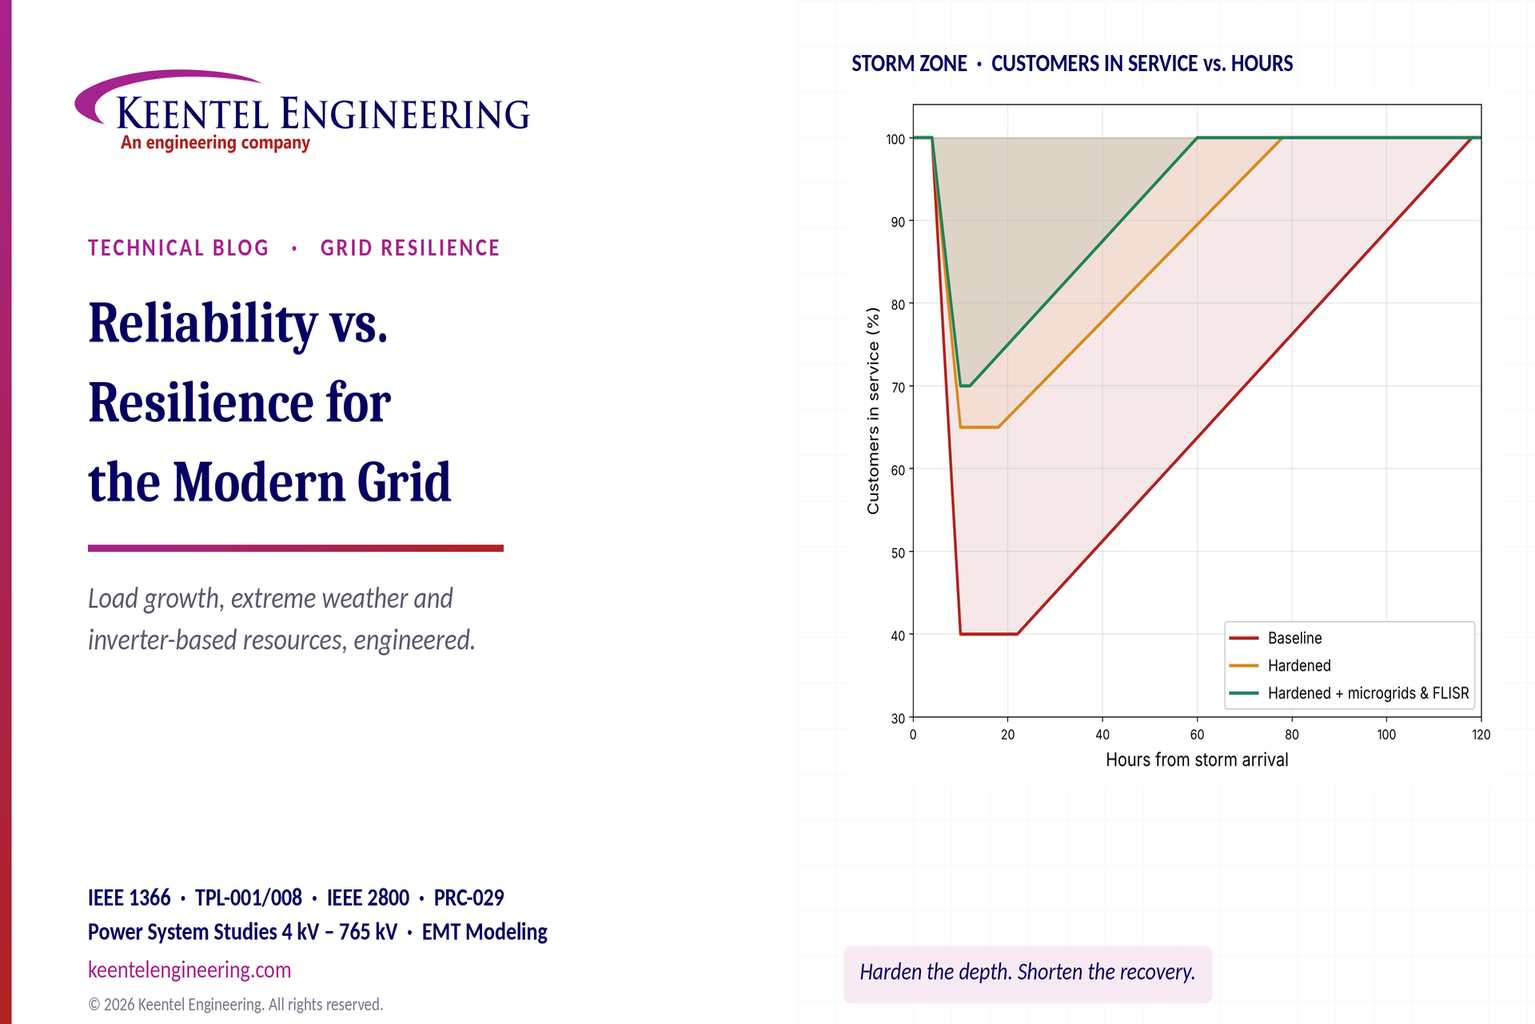
By SANDIP R PATEL
•
November 11, 2026
Explore grid reliability vs. resilience, extreme weather planning, outage recovery, IEEE 1366 metrics, microgrids and IBR challenges with Keentel Engineering.
By SANDIP R PATEL
•
November 10, 2026
Learn NERC PRC-028-1 requirements for solar, wind and BESS, including disturbance monitoring, recording standards, deadlines and compliance steps from Keentel.
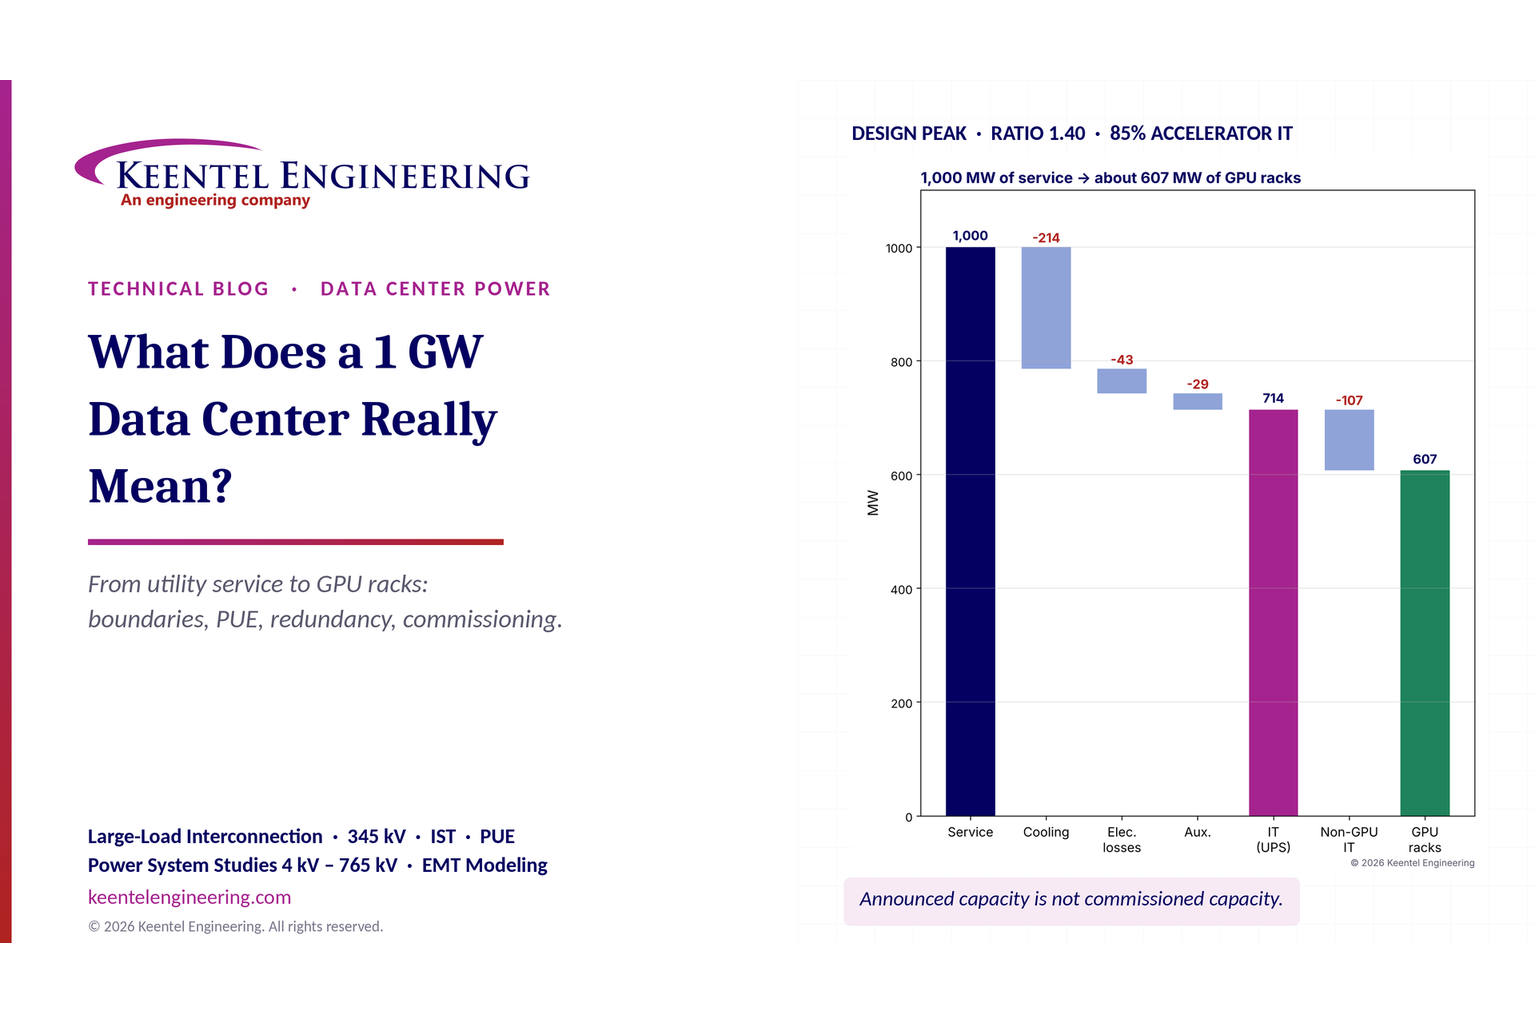
By SANDIP R PATEL
•
November 8, 2026
What does a 1 GW data center mean? Explore power capacity, PUE, GPU racks, grid interconnection and commissioning with Keentel Engineering's expert guide.
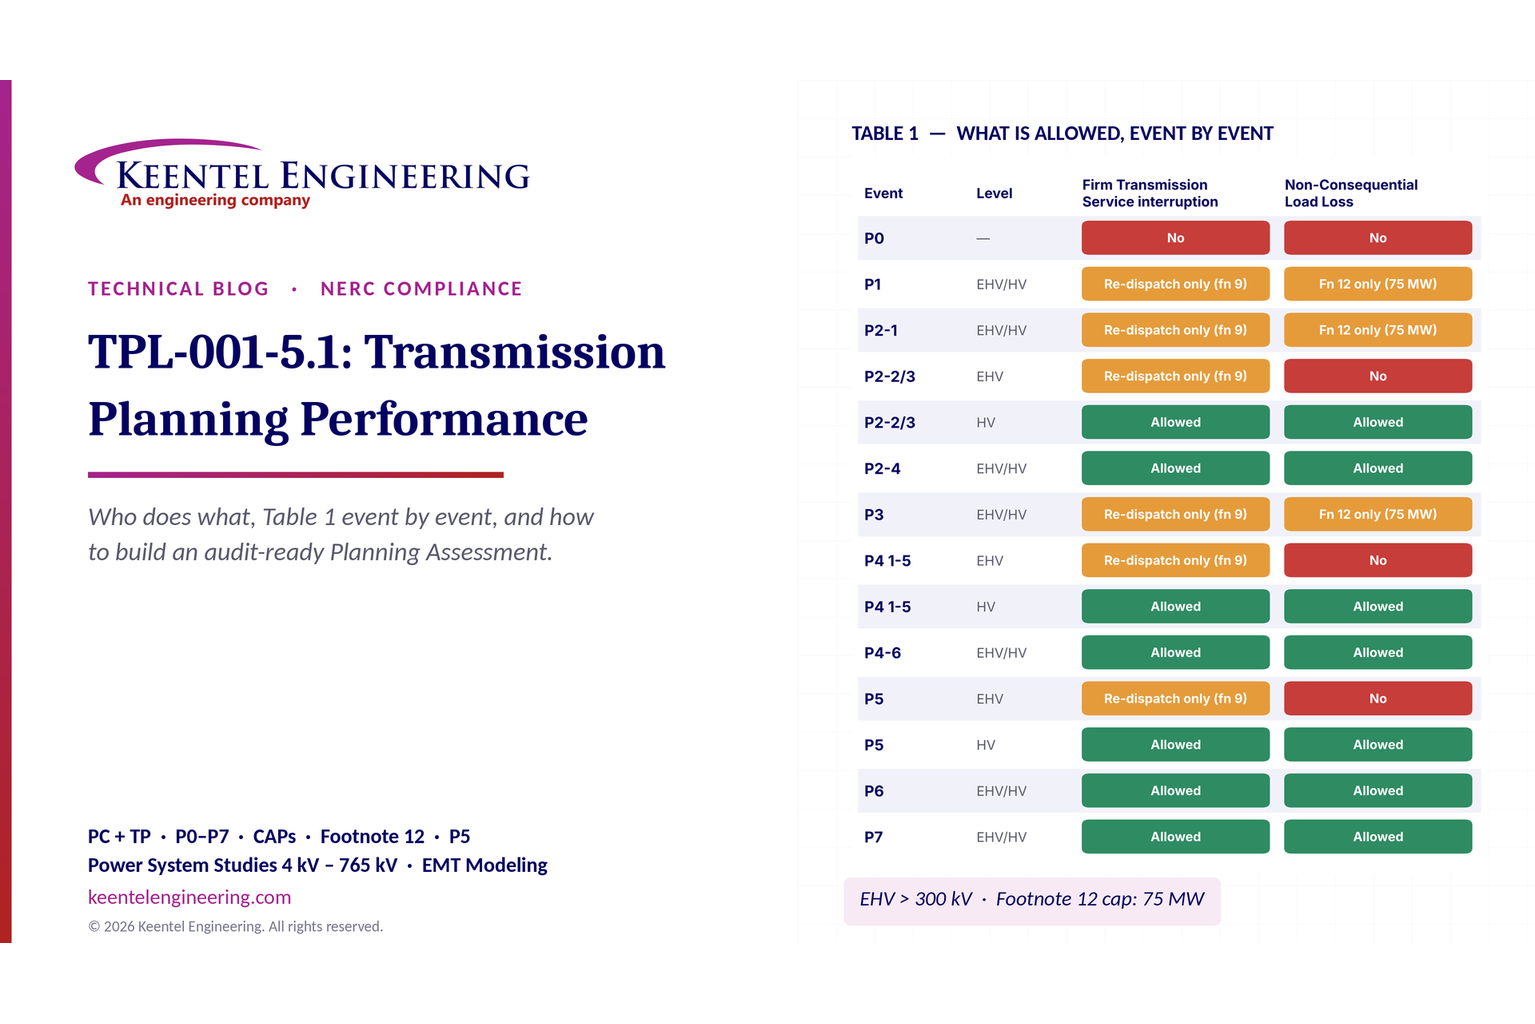
By SANDIP R PATEL
•
November 8, 2026
Explore NERC TPL-001-5.1 requirements, P0–P7 planning events, Table 1, corrective action plans and annual assessments with Keentel Engineering.
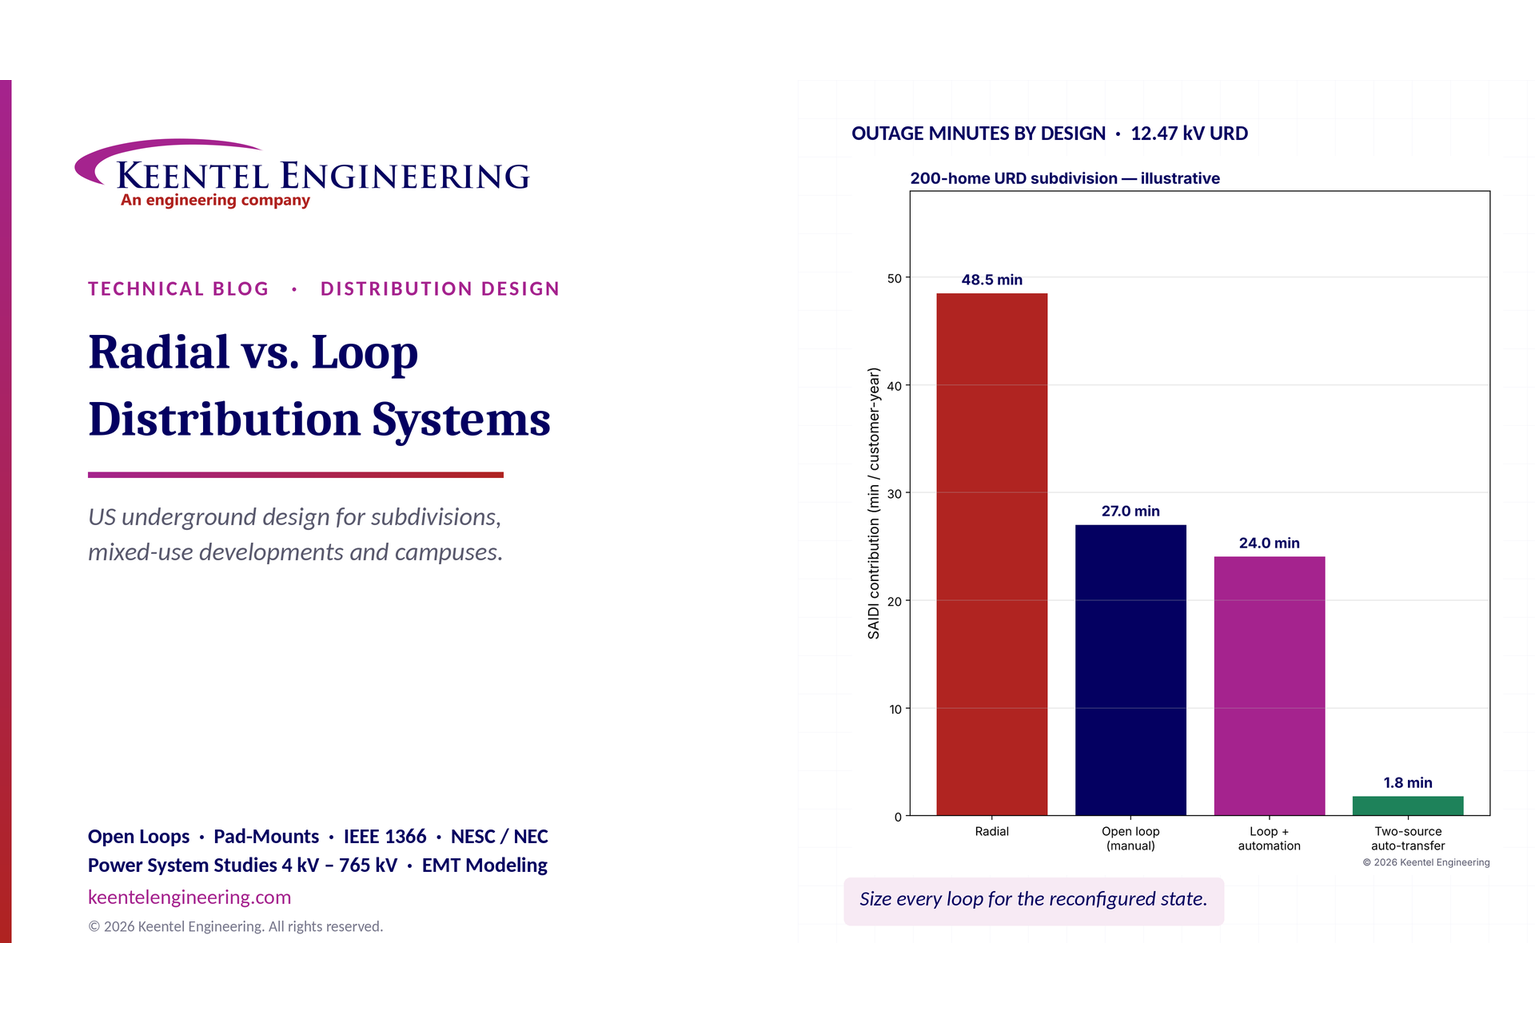
By SANDIP R PATEL
•
November 6, 2026
Compare radial vs. loop distribution systems in the US. Explore reliability, underground cables, protection, voltage drop and design with Keentel Engineering.
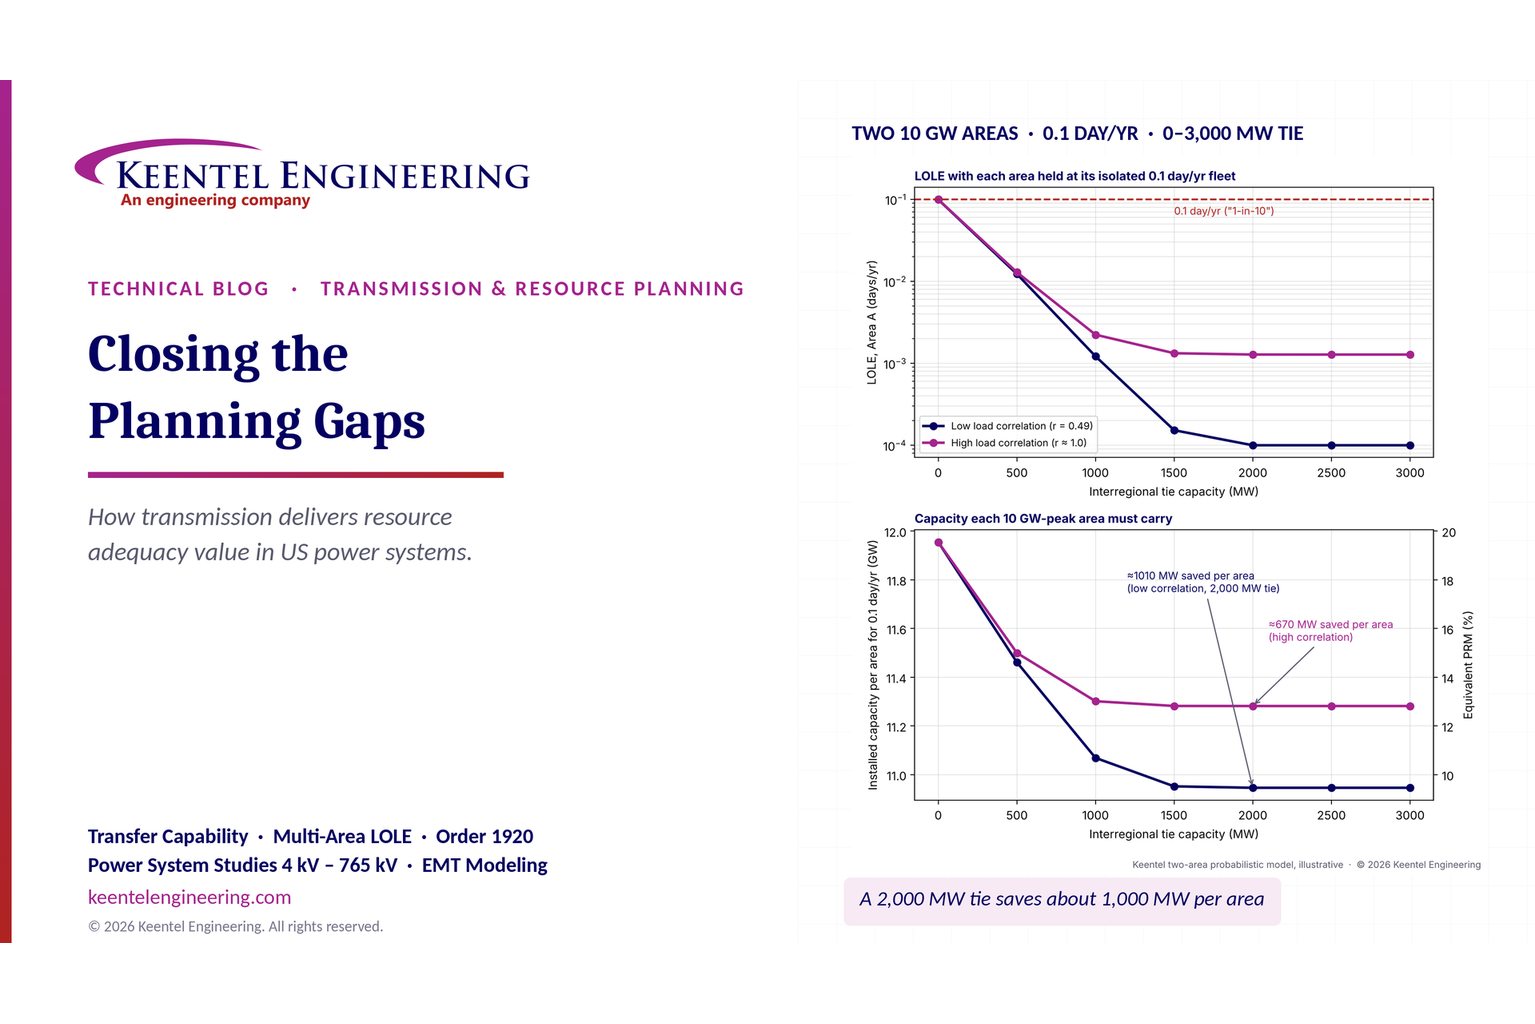
By SANDIP R PATEL
•
November 6, 2026
Learn how transmission planning improves US resource adequacy through LOLE, reserve sharing and FERC Order 1920 analysis from Keentel Engineering.