A Coordinated Electric System Interconnection Review—the utility’s deep-dive on technical and cost impacts of your project.
Challenge: Frequent false tripping using conventional electromechanical relays
Solution: SEL-487E integration with multi-terminal differential protection and dynamic inrush restraint
Result: 90% reduction in false trips, saving over $250,000 in downtime
The three operating regions you have to design to
| Device | Output vs voltage | Response | Best suited to | Main limitations |
|---|---|---|---|---|
| Mechanically switched capacitor or reactor | Proportional to voltage squared | Seconds; discrete steps; limited switching operations per day | Steady-state reactive supply, voltage profile, loss reduction | No dynamic capability; step voltage change on switching; capability collapses when most needed |
| Static var compensator | Capacitive branches proportional to voltage squared | A few cycles; continuously controllable | Continuous control where cost matters and deep voltage support is not the driver | Square-law capability loss; harmonic filters are part of the plant and interact with the network |
| STATCOM | Approximately proportional to voltage — constant current capability | One to two cycles closed loop; converter response faster still | Voltage stability margin, weak interconnections, fast disturbance recovery, flicker and unbalance compensation | Higher capital cost; converter losses; adds a converter and its control dynamics to the network |
| Synchronous condenser | Governed by machine capability and excitation | Excitation response in the hundreds of milliseconds; inherent inertial response instantaneous | System strength and inertia, short-circuit contribution, black start support | Rotating plant with maintenance and losses; slower controlled response than a converter |
| STATCOM with energy storage | Reactive as a STATCOM, plus real power within the storage rating | As STATCOM for reactive; real power limited by storage | Where a real power deficiency is part of the problem | Cost and complexity of the storage; different failure and maintenance profile |
| Service area | What we do for SST campuses | Typical deliverables |
|---|---|---|
| Grid interconnection | Site screening, large-load applications, independent studies, utility and RTO coordination in ERCOT, NYISO, PJM and other markets | Screening reports, application data packages, load flow, contingency and stability studies, study review memos |
| EMT modeling | Model requirements, vendor model review, campus aggregation, ride-through, weak-grid, control interaction and load-oscillation studies | EMT model specifications, model acceptance reports, PSCAD study reports, SCR screening |
| MV/MVDC system studies | AC and DC short-circuit, DC protection philosophy, AC protection, arc flash, grounding, insulation coordination | Study reports, protection philosophy documents, settings files, arc flash labels, interface control documents |
| Power quality | Emission requirements, frequency scans, IEEE 519-2022 compliance, filter sizing, flicker assessment | Harmonic study reports, filter specifications, monitoring plans |
| Substation and transmission design | HV/EHV substations, MV collectors, transmission lines, utility interface protection | Physical and electrical drawing packages, specifications, bills of material, protection and control design |
| NERC compliance | Registration and applicability, ride-through requirements, model validation, monitoring, compliance programs | Applicability assessments, compliance programs, evidence packages, model validation reports |
| Owner's engineer and QA/QC | SST, storage and substation specifications, design reviews, FAT and SAT plans and witnessing, multi-unit QA | Specifications, review comments, test plans, witness reports, due diligence reports |
| Onsite generation and BESS | Role definition and sizing, DC bus control architecture, fire and code compliance coordination, performance testing | Sizing studies, control architecture documents, specifications, test procedures |
Storage and generation
| Term | Meaning |
|---|---|
| AFE | Active front end. The actively switched AC/DC stage of an SST that connects to the MV grid and sets its grid behavior. |
| Aggregated model | A model in which many converters are represented by a smaller number of equivalent converters to make campus-scale simulation practical. |
| Arc flash | The release of energy from an electric arc fault, assessed as incident energy at a working distance to set PPE and safe work practices. |
| BESS | Battery energy storage system. |
| Blocking | Turning off all converter switches so the converter stops feeding current, used to limit DC faults. |
| Composite load model | A positive-sequence load model that combines several load types, such as motors, electronics and static loads. |
| DAB | Dual active bridge. An isolated DC/DC converter topology with active bridges on both sides of a high-frequency transformer. |
| DC-link | The internal DC capacitor bank between converter stages. |
| EMT | Electromagnetic transient simulation. Time-domain simulation with microsecond time steps, used to study fast converter and network behavior. |
| FAT | Factory acceptance test. |
| Grid-forming | A converter control mode that sets its own voltage and frequency reference rather than following the grid's, providing support to weak grids. |
| HIL | Hardware-in-the-loop testing, in which a real controller is tested against a real-time simulation. |
| IBR | Inverter-based resource. Generation or storage connected to the grid through power electronics. |
| Insulation coordination | Matching the insulation strength of equipment to the voltage stresses the system produces, with surge protection where needed. |
| ISC/IL | The ratio of available short-circuit current to maximum demand load current at the point of common coupling, used to set IEEE 519 limits. |
| ISOP | Input-series, output-parallel. A modular converter arrangement that shares a high input voltage across cells in series and combines their outputs in parallel. |
| Large load | A load large enough to affect transmission system reliability. Definitions vary, for example 75 MW and above under Texas SB 6, or loads above 20 MW in the federal rulemaking proposal. |
| LVDC | Low-voltage DC, such as 800 VDC or ±400 VDC rack distribution. |
| MFT | Medium-frequency transformer. The compact isolation transformer inside an SST, operating at kilohertz frequencies. |
| MMC | Modular multilevel converter. A converter built from many submodules with their own capacitors, producing a stepped multilevel waveform. |
| MVDC | Medium-voltage DC distribution, roughly 1 kV to 35 kV DC in common usage. |
| OE | Owner's engineer. An independent engineer representing the owner's technical interests. |
| PCC / POI | Point of common coupling / point of interconnection, where the campus connects to the utility system and where compliance is usually assessed. |
| PLL | Phase-locked loop. The control element that tracks grid voltage phase and frequency. |
| Positive-sequence model | A fundamental-frequency, balanced dynamic model used in PSS®E, PSLF and similar tools. |
| Ride-through | The ability to stay connected and keep operating during and after a grid disturbance within defined limits. |
| SAT | Site acceptance test. |
| SCR | Short-circuit ratio. Available short-circuit power divided by converter rating, a measure of grid strength. |
| SiC | Silicon carbide, a wide-bandgap semiconductor material that allows higher voltage, higher frequency switching. |
| SST | Solid-state transformer. A power electronic converter with a high-frequency isolation stage that replaces a 60 Hz transformer and rectifier chain. |
| Supraharmonics | Emissions in the 2 kHz to 150 kHz range, above the range covered by most harmonic limits. |
| TDD | Total demand distortion. Harmonic current distortion relative to maximum demand current, used in IEEE 519. |
| WSCR | Weighted short-circuit ratio. An SCR screen that accounts for several inverter-based plants sharing a network area. |
Links were current at publication (November 2026). Large-load rules, NERC actions and standards editions are changing quickly, so confirm current versions before relying on them.
Large-load reliability and NERC
- NERC Publishes Incident Review and Guidance on Voltage-Sensitive Large Load Integration, NERC
- Reliability Insights: Large Computational Load Risks Due to Voltage Sensitivity, NERC, September 2026
- NERC Seeks to Address Reliability Impacts from Large Load Integration, NERC presentation to FERC, April 2025
- NERC issues Level 3 Alert to address immediate risks data center loads pose to the grid, Renewable Energy World, May 2026
- NERC Voltage-Sensitive Loads, Keentel Engineering
Federal and state large-load rules
- FERC Docket RM26-4, Interconnection of Large Loads, FERC
- FERC Establishes Proceeding to Consider DOE Directive on Large Load Transmission Interconnection Rulemaking, McGuireWoods, October 2025
- Texas Senate Bill 6 Ushers in Major Overhaul of Large Load Interconnection and Grid Access Rules, Bracewell, July 2025
- Public Utility Commission of Texas Issues Proposed Rules for Large Load Interconnections, Foley & Lardner, March 2026
Solid-state transformers and DC data center power
- Solid State Transformer project, Open Compute Project
- Novel Solid-State Transformer Supports 800-V DC Power in AI Data Centers, Electronic Design
- How SSTs are Reshaping Data Center Infrastructure, Microchip Technology
Standards referenced (consult the publisher for the current edition)
Step 5 — options. Replacing or retrofitting the drives with active-front-end or 18-pulse units at about 5% THDi gives a TDD of about 1.5%. An active harmonic filter sized for the 5th and 7th could achieve a similar result at the facility level. A passive 5th-harmonic tuned filter would also work but must be checked for resonance with the utility system and with any future capacitors.
What this means for you.
The same drives can be compliant on a strong system and non-compliant on a weak one. Ask your utility for the maximum short-circuit current at the PCC early in design. If the ratio is below 50, plan for low-harmonic drives or filtering from the start; it is much cheaper than retrofitting.
9. Inverter-based resources: solar, storage and wind
Solar PV, battery energy storage and full-converter wind turbines use pulse-width-modulated inverters with output filters. They are generally low-distortion sources. IEEE Std 1547-2018 (distribution-connected resources) and IEEE Std 2800-2022 (transmission-connected resources) limit their current distortion — total rated-current distortion (TRD) of 5% with individual limits by order, measured against rated current rather than present output. In practice, quality inverters measure 1–3% at rated output.
Three cautions apply:
- Percentages rise at low output. At 10% of rated output a 2% distortion (of rated current) looks like 20% THD. Limits referenced to rated current, like TDD, avoid this trap.
- Inverters change the system's impedance. Plant collector cables, inverter output filters and capacitor banks add capacitance. They can create resonances near the 5th to 13th harmonics on the 34.5 kV collector or at a 138 kV, 230 kV or 345 kV point of interconnection, amplifying background distortion that the plant did not create.
- Background distortion matters. Inverters can absorb or amplify existing voltage distortion depending on their control design. Utilities increasingly require harmonic impedance studies for new plants, sometimes using electromagnetic transient (EMT) simulation.
Keentel's articles on harmonic resonance and on
weak-grid inverter stability cover these interactions in depth.
10. Data centers and other electronic facilities
Data centers are a special case because almost all their load is electronic. Points to check:
- UPS rectifiers. Double-conversion UPS units with IGBT rectifiers typically draw less than 5% THDi at rated load, rising at low load. Older six-pulse or 12-pulse thyristor UPS rectifiers may need input filters.
- Server and network power supplies. Modern units with active power factor correction have low 3rd harmonic. Legacy equipment does not. Measure a representative panel rather than assuming.
- 208Y/120 V and 415Y/240 V distribution. Check neutral current and transformer K-factor as in Sections 4 and 7.
- Generator operation. Test UPS and generator compatibility at the actual load level. Generator THDv can be three to four times the utility THDv for the same load.
- Cooling plant. Chiller, pump, fan and cooling distribution unit drives often contribute more low-order harmonics than the IT load. Specify low-harmonic drives where the facility is large relative to the utility source.
- Large-load interconnection. Utilities and grid operators now treat large data centers as high-impact loads. Harmonic studies and power quality monitoring are increasingly part of interconnection requirements, alongside ride-through and dynamic studies.
11. How a harmonic study is done
A harmonic study answers four questions: How much harmonic current will the facility inject? What voltage distortion will it cause? Will any resonance amplify it? What is the cheapest reliable fix? Keentel's typical workflow:
- Gather data. Single-line diagram; utility short-circuit data (maximum and minimum) at the PCC; utility background distortion if known; transformer impedances; cable lengths; capacitor banks and filters; drive, UPS and inverter data sheets with harmonic spectra.
- Measure existing conditions. For existing facilities, install class-compliant power quality meters at the PCC and key buses for at least one week, capturing 10-minute and 3-second data up to the 50th harmonic.
- Build the model. Represent sources as harmonic current injections and the network as frequency-dependent impedances, including transformer phase shifts that can cancel 5th and 7th harmonics between delta-delta and delta-wye units.
- Run a frequency scan. Plot driving-point impedance versus frequency at each important bus to find resonances, for all credible system configurations (tie breakers open/closed, capacitor steps in/out, generator versus utility).
- Run harmonic load flow. Calculate harmonic currents and voltages and compare them with IEEE 519 at the PCC and with equipment limits (IEEE 18 for capacitors, C57.110 for transformers) inside the facility.
- Design mitigation. Compare options for performance, cost, losses, footprint and future flexibility.
- Verify. Measure again after installation and document compliance with the statistical criteria.
12. Fixing harmonics: options compared
Reliability vs. Resilience: Engineering the US Power Grid for Load Growth, Extreme Weather and Inverter-Based Resources
November 11, 2026 | Blog
Part A — Reliability vs. Resilience at a Glance
For most of the last century, US utilities had a clear job description: keep the lights on under every credible single contingency, and keep the number and length of customer interruptions within accepted limits. That is reliability, and the industry measures it well. NERC planning standards test the bulk system against defined contingencies. Resource adequacy studies set a loss-of-load target, and IEEE 1366 gives distribution utilities a common way to count interruptions.
The grid is now being asked to do something different. Load is growing again after fifteen flat years, led by data centers, manufacturing and electrification. Inverter-based resources (IBRs) such as solar, wind and battery storage are replacing synchronous machines, changing how the system behaves in the first second after a fault. Hurricanes, winter storms, wildfire and heat waves are producing outages that last days or weeks rather than minutes or hours. Physical and cyber attacks are no longer hypothetical. None of these sits comfortably inside a traditional N-1 study.
Resilience is the word the industry uses for that wider problem. It is not a replacement for reliability. It covers the high-impact, low-probability (HILP) events that reliability criteria were never designed to cover, and it asks a different question: not "how often do customers go out?" but "when something big goes wrong, how much do we lose, how fast do we recover, and what do we learn?"
This guide is Keentel Engineering's practical view of how US planners, operators and large customers can engineer for both. It explains the definitions, metrics and standards, works through the calculations with real formulas and numbers, reviews what recent US disturbances have taught us, and sets out the hardening, operational and planning measures that deliver the most resilience per dollar.
In plain terms: reliability is how well the grid performs on normal days and for expected failures. Resilience is how well it holds up, and how fast it comes back, on the worst days. A grid can score well on one and poorly on the other, so both need their own targets, metrics and investment cases.
Reliability and resilience compared
| Attribute | Reliability | Resilience |
|---|---|---|
| What it describes | A measured performance level | A capability: anticipate, absorb, recover, adapt |
| Events covered | Credible, frequent contingencies (N-1, planned N-1-1) | HILP events: hurricanes, ice, wildfire, extreme cold, attacks, GMD, multi-element outages |
| Typical metrics | SAIDI, SAIFI, CAIDI, MAIFI; LOLE, EUE; N-1 compliance | Not yet standardized: outage area, time to restore 50% and 95%, customer-hours lost, critical load served |
| US governing framework | NERC Reliability Standards (TPL, BAL, PRC, EOP, FAC), state PUC reliability rules | Partly covered by NERC TPL-001 extreme events, TPL-007 (GMD), TPL-008 (extreme temperature), EOP-012 (cold weather), CIP-014 (physical security), state resilience and wildfire plans |
| Investment case | Meeting a criterion | Risk reduction and avoided societal cost |
| Major event days | Excluded from normalized indices (IEEE 1366 2.5β method) | They are the main focus |
Five things every planner should take away
- Resilience starts where reliability statistics stop. IEEE 1366 normalizes away major event days so that utilities can track day-to-day performance. Those excluded days are exactly where resilience lives. A utility can show steady SAIDI improvement while its storm performance gets worse.
- Depth and duration both matter, but not equally. In Keentel's model in Part B, reducing the number of customers who lose power by 10% cuts customer-hours lost by 10%. Restoring 10% faster cuts it by only 7.6% unless the degraded-state period also shrinks. Hardening and restoration capability are complements, not substitutes.
- The cheapest resilience is usually not the most visible. Reclosers, fault location, isolation and service restoration (FLISR) and targeted vegetation work often deliver avoided customer-minutes at a fraction of the cost of undergrounding. Undergrounding still wins in specific places: wildfire ignition zones, storm-surge-free urban cores and repeatedly damaged segments.
- The new grid fails in new ways. Several recent US disturbances involved IBR plants reducing output or tripping for normally cleared faults. Large data center loads have also dropped more than 1,000 MW within seconds. These are reliability problems with resilience consequences, and they require electromagnetic transient (EMT) modeling, ride-through requirements and better monitoring.
- Resilience is organizational as much as electrical. Black start, spares, mutual assistance, operator training, gas-electric coordination and clear decision rights decide how long an outage lasts once the hardware has done what it can.
The illustrative system used in this guide
| Item | Value |
|---|---|
| Transmission | 765, 500, 345, 230, 138 and 115 kV, 60 Hz |
| Sub-transmission and distribution | 69 kV sub-transmission; 34.5, 13.8 and 12.47 kV distribution |
| Distribution service area for the worked examples | 250,000 customers (reliability indices); 100,000-customer storm zone (resilience curves) |
| Example transmission line | 230 kV, 795 kcmil 26/7 ACSR "Drake", 100 °C maximum operating temperature |
| Example critical facility | 2 MW hospital or water-treatment load, 72-hour islanding target |
| Example large load | 1,500 MW data center campus at 345 kV |
All numbers in the worked examples are illustrative and were computed for this guide. They are meant to show method and order of magnitude, not to represent any particular utility.

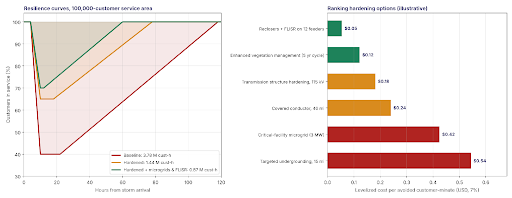
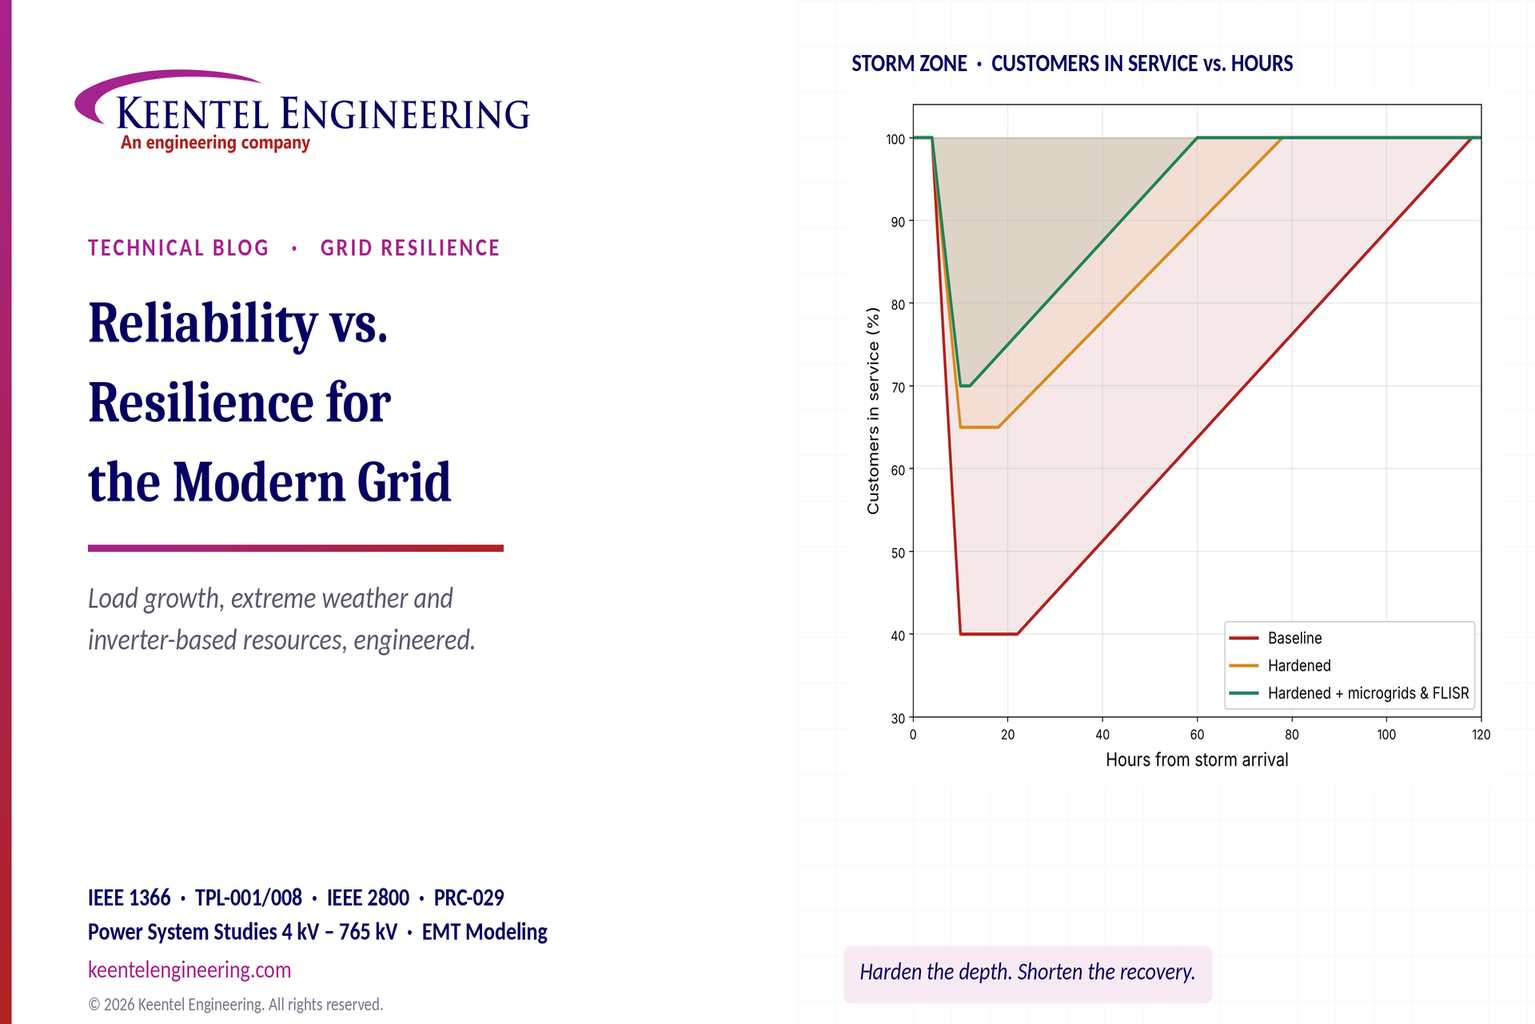
Figure 1. Left: resilience curves for a 100,000-customer storm zone under three investment cases; the shaded area above each curve is customer-hours lost. Right: illustrative levelized cost per avoided customer-minute for six common hardening options (7% discount rate).
Part B — Engineering Guide
1. Definitions that hold up in a rate case
1.1 Reliability: adequacy plus operating reliability
NERC defines bulk power system reliability through two concepts. Adequacy is the ability of the system to supply aggregate demand and energy at all times, accounting for scheduled and reasonably expected unscheduled outages. Operating reliability is the ability to withstand sudden disturbances such as short circuits or the unanticipated loss of system elements. Adequacy is studied with probabilistic models of generation and load. Operating reliability is studied with deterministic contingency analysis under TPL-001 and in real time by Reliability Coordinators and Transmission Operators.
At the distribution level, reliability is described by IEEE 1366 indices: how often the average customer is interrupted and for how long. These are performance outcomes, measured after the fact, and they are what most state commissions use for performance-based regulation.
1.2 Resilience: a capability, not a statistic
The most widely used US definition comes from FERC's 2018 grid resilience proceeding. It describes resilience as the ability to withstand and reduce the magnitude or duration of disruptive events, including the capability to anticipate, absorb, adapt to and rapidly recover from such events. The National Infrastructure Advisory Council (NIAC) framework, which NERC also references, breaks the same idea into four parts:
- Robustness: the ability to absorb shocks and keep operating.
- Resourcefulness: the ability to detect and manage a crisis as it unfolds.
- Rapid recovery: the ability to restore service quickly and in a controlled way, given the extent of damage.
- Adaptability: the ability to learn from each event and improve.
The practical difference is that reliability can be met by satisfying a criterion, while resilience has to be built and exercised. A transmission system can pass every TPL-001 contingency and still collapse when a hurricane takes out 200 structures, because no planning criterion asks it to survive that.
1.3 The resilience trapezoid
Engineers describe a resilience event with a performance curve that has five phases:
- Pre-disturbance (anticipate): forecasting, pre-staging crews, reconfiguring, committing extra units, de-energizing in wildfire conditions.
- Degradation (absorb): performance falls as elements fail. Robustness limits the slope and depth.
- Degraded state (respond): the system sits at or near its lowest point while damage is assessed. Resourcefulness, including situational awareness, switching and islanding, shortens this phase.
- Restoration (recover): performance climbs as crews repair and re-energize. Crew numbers, spares, access and black start capability set the slope.
- Post-restoration (adapt): the system returns to normal, ideally stronger, through lessons learned, standards changes and targeted investment.
The area between the normal performance level and the curve is the event's total loss. Measured in customer-hours, element-days or MVA-days, it is the closest thing the industry has to a single resilience metric.
2. Measuring reliability
2.1 IEEE 1366 indices
The core distribution indices are defined in IEEE 1366:
where Ni is the number of customers interrupted by event i, ri is the restoration time in minutes, and NT is the total number of customers served. MAIFI counts momentary interruptions, which matter more as reclosing and automation increase.
Worked example 1 — annual indices. A utility serves 250,000 customers. Over a year it records 300,000 customer interruptions and 36,000,000 customer-minutes of interruption (CMI).
- SAIFI = 300,000 / 250,000 = 1.2 interruptions per customer
- SAIDI = 36,000,000 / 250,000 = 144 minutes per customer
- CAIDI = 144 / 1.2 = 120 minutes per interruption
2.2 Major event days and the 2.5β method
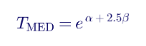
IEEE 1366 separates major event days (MEDs) from normal days so that a single hurricane does not swamp a year's trend. The threshold uses the natural logarithm of five years of daily SAIDI values, excluding days with zero SAIDI:
where α is the mean and β the standard deviation of ln(daily SAIDI). Any day whose SAIDI exceeds TMED is a major event day.
Worked example 2 — MED threshold. Keentel generated five years of synthetic daily SAIDI for a mid-sized utility, log-normally distributed with seven embedded storm days. The log statistics are α = −1.421 and β = 1.020, so:
- TMED = exp(−1.421 + 2.5 × 1.020) = 3.09 minutes per day
- 18 days in five years exceed the threshold, 5 of them in the most recent year
- The most recent year's SAIDI is 171.8 minutes including MEDs and 138.5 minutes excluding them
The 33 minutes removed by the MED rule are a fifth of the total. That share is the part of customer experience that normalized reliability reporting does not show, and it is growing in many service territories. Keentel recommends that utilities report both values side by side, plus the customer-minutes on MEDs as a separate resilience indicator.
2.3 Resource adequacy metrics
Bulk system adequacy uses probabilistic metrics:

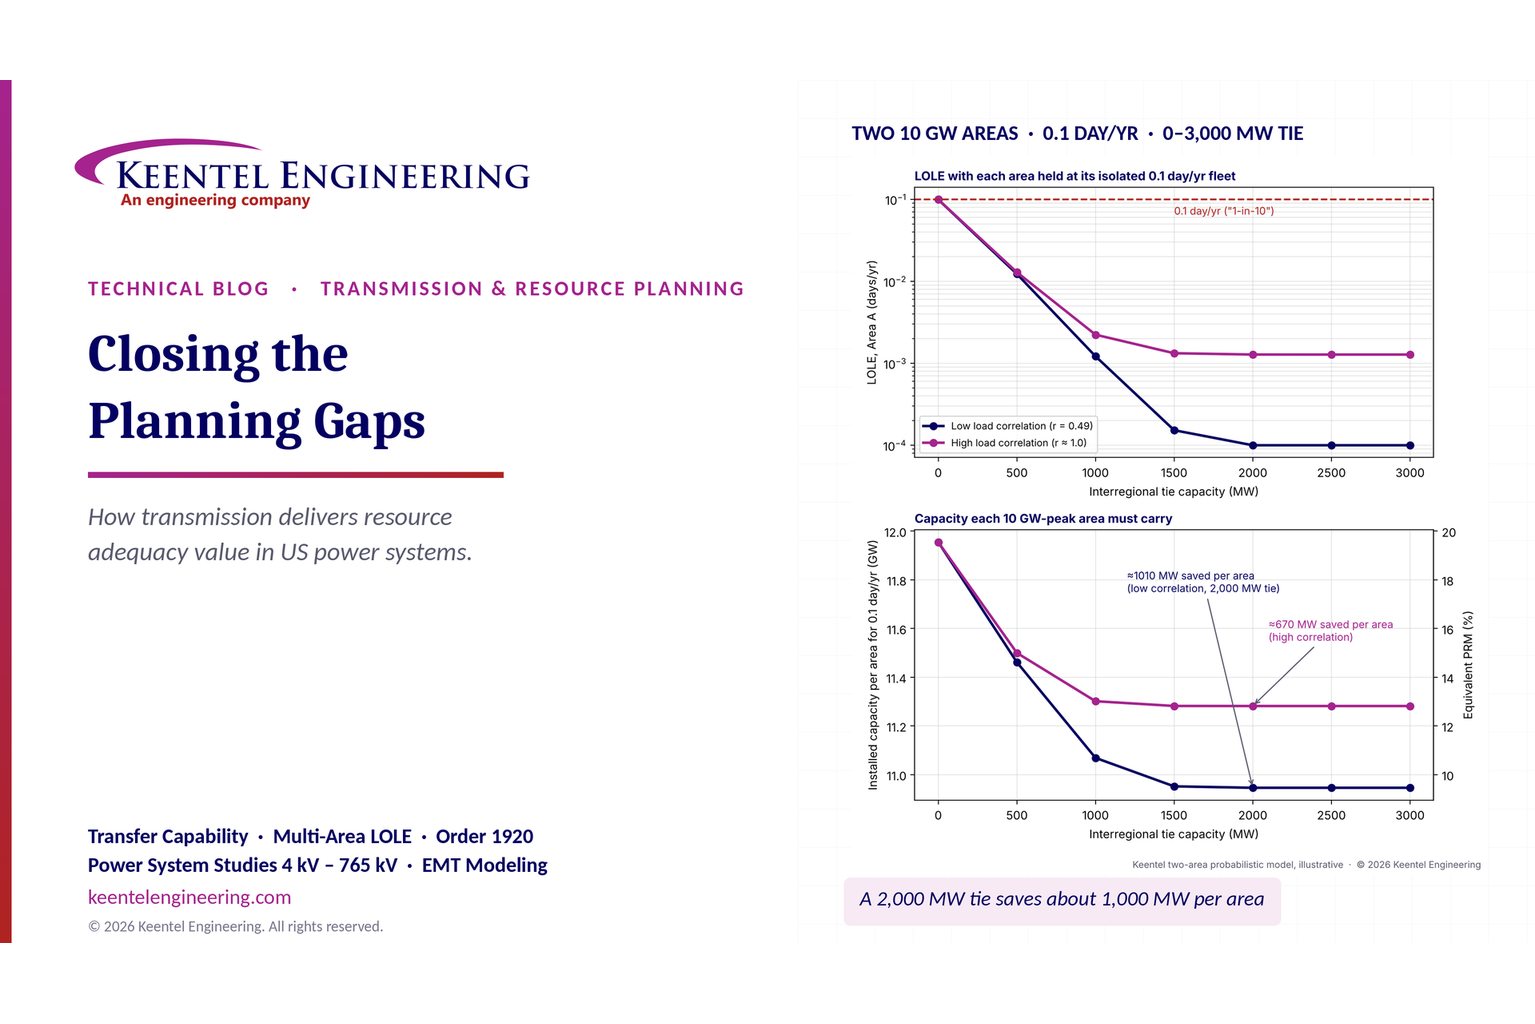
Loss of load expectation (LOLE) is the expected number of hours or days per year with insufficient supply. Expected unserved energy (EUE) is the expected energy not delivered. The common "0.1 days per year" (one day in ten years) target is an industry convention adopted by many regions, not a NERC standard, and planners increasingly recognize that LOLE alone hides the size and duration of shortfalls. EUE, normalized EUE, and the hourly pattern of risk now matter as much as the headline LOLE, especially in winter. Effective load-carrying capability (ELCC) is the matching tool for valuing variable and energy-limited resources.
3. Measuring resilience
3.1 There is no standard metric yet
Unlike reliability, resilience has no IEEE or NERC index that every utility reports. That is partly because resilience depends on the threat: the right metric for a hurricane differs from the right metric for a cyber intrusion or a cold snap. Surveys of international utilities show that a little more than half distinguish formally between reliability and resilience, and fewer than half have resilience-specific frameworks. In practice, US utilities and regulators use a combination of the measures below.
| Metric | Definition | Best used for |
|---|---|---|
| Event size | Number of elements or customers affected | Comparing events, setting priorities |
| Nadir | Maximum elements or customers out at the same time | Robustness of the design |
| Time to first restore | Delay from event start to first restoration | Crew and switching readiness |
| D50 / D95 | Time to restore 50% or 95% of outages | Recovery capability |
| Customer-hours or customer-minutes lost | Area above the performance curve | Societal impact, cost-benefit |
| MVA-days or element-days lost | Same area for transmission elements | Transmission resilience (NERC TADS analyses) |
| Critical load served | Share of hospitals, water, communications kept energized | Community resilience targets |
| Customers out more than 24, 72 or 168 h | Distribution of long outages | Equity and public safety |
NERC's transmission resilience analysis uses Transmission Availability Data System (TADS) outage data to build outage, restore and performance curves for every large event. For Hurricane Helene in 2024, NERC reported 431 automatic transmission outages, the largest event in its 2015–2024 record, yet the industry restored 95% of outaged elements within about a week. That combination is a good illustration: very large size and nadir, but strong recovery, made possible by tens of thousands of mutual-assistance personnel.
3.2 Resilience loss as an area
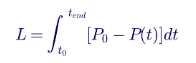
For a single event, the loss is the integral of lost performance over time:

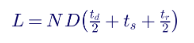
For a simple trapezoid with depth D (fraction of customers out at the nadir), degradation time td, degraded-state time ts and restoration time tr, the integral becomes:
A 75 kVA single-phase pad-mount would see 80 kVA, about 107% of nameplate, at the short winter or evening peak. IEEE C57.91 thermal models normally allow short peaks above nameplate when the daily cycle and ambient are favorable, and many utilities permit peak loading of roughly 120–140% for residential units. The design therefore uses 25 transformers of 75 kVA, with a planned upgrade path to 100 kVA where EV adoption is high.
Worked example 3 — three investment cases for a storm zone. A 100,000-customer coastal zone is hit by a major hurricane. Keentel compared three cases:
| Case | Depth D | td (h) | ts (h) | tr (h) | Customer-hours lost |
|---|---|---|---|---|---|
| Baseline | 60% | 6 | 12 | 96 | 3.78 million |
| Hardened (structures, poles, vegetation) | 35% | 6 | 8 | 60 | 1.44 million |
| Hardened + microgrids and FLISR | 30% | 6 | 2 | 48 | 0.87 million |
Hardening cuts loss by 62%. Adding automation and microgrids takes the total reduction to 77%, mainly by shortening the degraded state and the restoration.
3.3 Hardening versus faster restoration
The trapezoid formula shows why both levers are needed. Starting from the baseline case:
- 10% less depth (hardening that keeps 10% more of the affected customers in service) reduces loss by 10.0%, because depth multiplies the whole area.
- 10% faster restoration (tr shortened by 10%) reduces loss by only 7.6%, because the degradation and degraded-state parts are unchanged.
- 10% faster restoration plus a 10% shorter degraded state reduces loss by 9.5%.
NERC's "rerunning history" analysis of Hurricane Ida transmission outages reached a similar conclusion with real data: removing 10% of outages reduced the nadir and MVA-days lost by about 10%, while faster restoration reduced MVA-days lost and time to 95% restoration but left the nadir unchanged. The practical message is that the outages that both happen early and take longest to restore are the most valuable ones to prevent.
3.4 Putting a dollar value on resilience
Unserved energy converts customer-hours into an economic loss:
Worked example 4 — societal cost of the storm. With an average load of 1.6 kW per customer (a blended residential and small commercial mix), the three cases in Worked example 3 give:
| Case | EUE (MWh) | Cost at $5/kWh | Cost at $10/kWh | Cost at $25/kWh |
|---|---|---|---|---|
| Baseline | 6,048 | $30.2 M | $60.5 M | $151.2 M |
| Hardened | 2,296 | $11.5 M | $23.0 M | $57.4 M |
| Hardened + microgrids and FLISR | 1,392 | $7.0 M | $13.9 M | $34.8 M |
Value of lost load (VoLL) is the most uncertain input in any resilience case. US interruption cost studies, including the Interruption Cost Estimate (ICE) Calculator maintained by Lawrence Berkeley National Laboratory, show per-kWh costs that differ by orders of magnitude between residential, small commercial and large industrial customers. They also show that most survey data covers outages of up to about 16 hours, not multi-day events. Long outages have costs that rise faster than linearly: spoiled inventory, lost production, displaced households, and health and safety impacts. Keentel always presents resilience benefits as a range and states the VoLL basis explicitly. A benefit-cost ratio that only works at the top of the VoLL range should be flagged as such.
3.5 Risk: probability times consequence
Resilience planning ranks threats by expected annual loss:

Worked example 5
— a utility threat register (illustrative).
| Threat | Annual probability | Consequence | Expected annual loss |
|---|---|---|---|
| Major hurricane landfall in service area | 4% | $400 M | $16.0 M |
| Wildfire ignition in high-risk area | 5% | $250 M | $12.5 M |
| Extreme cold with gas curtailment | 8% | $150 M | $12.0 M |
| Widespread ice storm | 10% | $60 M | $6.0 M |
| Substation physical attack | 2% | $40 M | $0.8 M |
| Total | $47.3 M per year |
Expected annual loss is a starting point, not the answer. For true HILP events, regulators and boards are often more concerned with the tail than the mean: a 1% chance of a $5 billion event has the same expected loss as a 50% chance of a $100 million event, but society treats them very differently. Keentel therefore pairs expected-loss ranking with scenario stress tests, such as a "30-day event" in which fuel, crews, spares and communications are all constrained at once.
4. What is different about the new grid
4.1 Load growth and very large loads
After roughly fifteen years of flat demand, US load forecasts are rising sharply. Lawrence Berkeley National Laboratory's December 2024 report to Congress estimated that data centers used about 4.4% of US electricity in 2023 and could reach between 6.7% and 12% by 2028. Transmission planners in several regions now see interconnection requests for single campuses of 300 MW to more than 1 GW, often with in-service dates shorter than the time it takes to build a 345 kV line.
Large loads raise reliability and resilience issues that legacy planning assumptions did not cover:
- Voltage-sensitive load loss. Data center power systems are designed to protect the IT load. When a transmission fault depresses voltage, uninterruptible power supply (UPS) systems and transfer schemes can move the whole facility to batteries or on-site generation in a few cycles. NERC has documented an event in which roughly 1,500 MW of data center load in the Eastern Interconnection dropped off almost simultaneously for a normally cleared transmission fault. To the grid, that is a large generation surplus: frequency and voltage rise, and the load returns on its own schedule, not the operator's.
- Ride-through. Unlike generators, most loads have no ride-through obligation. Regions are now developing large-load interconnection requirements that address voltage and frequency ride-through, ramp rates on return, and data sharing.
- Visibility. Many large loads are invisible to operators beyond a revenue meter. Telemetry of real and reactive power, status of on-site generation and UPS mode, and phasor measurement unit (PMU) data at the point of interconnection should be standard.
- Protection coordination. Facility protection must coordinate with utility reclosing and with the load's own transfer schemes, so that a utility reclose does not catch a large motor or power-electronic load out of phase.
- Emergency programs. Large loads that are on backup generation during an emergency may not provide the load relief that underfrequency load shedding (UFLS) and manual load-shed plans assume. Conversely, a flexible large load can be one of the most effective emergency resources a Balancing Authority has, if it is contracted and tested.
- Fast power swings. AI training workloads can swing by hundreds of megawatts in seconds, which can excite oscillations and stress voltage control. On-site battery storage and rack-level energy buffering are the usual mitigations.
Worked example 6 — frequency effect of a large-load trip. A 1,500 MW campus drops to backup power during a fault. The steady-state frequency deviation follows the interconnection's frequency response characteristic β, and the initial rate of change of frequency (RoCoF) follows its stored kinetic energy:
| System | β | Kinetic energy H·S | Δf (over-frequency) | Initial RoCoF |
|---|---|---|---|---|
| Large interconnection | 1,000 MW per 0.1 Hz | 600,000 MW·s | +0.15 Hz | 0.075 Hz/s |
| Smaller interconnection | 600 MW per 0.1 Hz | 250,000 MW·s | +0.25 Hz | 0.18 Hz/s |
Neither number is dangerous by itself. The risk comes from combinations: several large loads in the same electrical area, a simultaneous IBR response to the same fault, low-inertia hours, or the load returning all at once during recovery. These effects can only be assessed properly with dynamic and, near the point of interconnection, EMT models of the load's power electronics and controls.
4.2 Inverter-based resources and new stability problems
IBRs connect through power electronics. Their behavior during and after a fault is set by control software, not by the physics of a rotating machine. That brings capabilities synchronous machines lack, such as very fast active and reactive power control. It also brings failure modes that the industry did not anticipate.
Since 2016, NERC has published a series of disturbance reports in which solar PV and wind plants reduced output or tripped for faults that were cleared normally by transmission protection. In a 2021 series of Southern California events, several hundred megawatts of solar PV output was lost in each of four incidents. In the March 2022 Texas Panhandle events, wind plants reduced output for two separate phase-to-phase faults on 345 kV lines. Causes identified across these reports include:
- Plant controller interactions and dynamic active power reduction after the fault.
- AC overvoltage tripping on fault recovery.
- Instantaneous inverter protection operating on measured frequency or phase jumps.
- Sub-synchronous oscillation protection.
- Auxiliary power and pitch-system failures in wind turbines.
- Settings that did not match the plant's actual capability, or EMT models that did not match the as-built plant.
FERC Order No. 901 (2023) directed NERC to develop standards on IBR data sharing, model validation, planning and operational studies, and performance requirements. The resulting work includes PRC-029-1, the IBR frequency and voltage ride-through standard approved by FERC in 2025, PRC-030-1 for unexpected IBR event mitigation, and updates to modeling, monitoring and planning standards. IEEE 2800-2022 sets uniform technical minimum capabilities for transmission-connected IBRs, and many US transmission owners have adopted it, in whole or in part, in their interconnection requirements.
The classical stability categories of rotor angle, voltage and frequency have been extended to include resonance stability (sub-synchronous resonance and torsional interactions) and converter-driven stability (control interactions between converters and with a weak grid). Converter-driven problems typically appear in weak areas with a low short-circuit ratio. They can show up as oscillations from a few hertz to several hundred hertz, and positive-sequence RMS models often cannot reproduce them.
4.3 Extreme weather and interdependence
Weather is the dominant cause of large US outages. Recent events show different failure patterns:
- Hurricanes destroy distribution poles and transmission structures and flood substations. In Puerto Rico after Hurricanes Irma and Maria in 2017, the transmission and distribution systems were so badly damaged that full restoration took about eleven months. Hurricane Ida in 2021 took all eight transmission lines serving New Orleans out of service. Hurricane Helene in 2024 produced the largest transmission outage event in NERC's ten-year record.
- Extreme cold affects generation and fuel supply more than wires. In Winter Storm Uri (February 2021), ERCOT shed up to about 20,000 MW of load and came within minutes of a system-wide collapse. More than 200 people died and about 4.5 million homes and businesses lost power. In Winter Storm Elliott (December 2022), the FERC–NERC inquiry found about 90.5 GW of unplanned generation outages at the peak, roughly 13% of projected available capacity in the Eastern Interconnection. About 55% of outages, derates and failures to start were caused by freezing and fuel problems. Natural gas units made up the largest share, and many units froze at temperatures above their documented minimum operating temperature.
- Wildfire is both a hazard to the grid and, in parts of the West, a hazard the grid can cause. It leads to de-energization (public safety power shutoffs, or PSPS), smoke-related insulator flashovers, damage to wooden poles, and air-intake problems at generators and synchronous condensers.
- Heat waves combine high load with reduced line ratings, derated thermal generation and reduced transformer capacity.
- Flooding damages substations and control houses. Raising control equipment and building flood walls are often more cost-effective than relocating a station.
Interdependence makes these events worse. In some US regions, natural-gas-fired plants make up more than 80% of winter peak capacity, and gas production and pipeline compression depend on electricity. Telecommunications, water treatment and fuel distribution all need power to restore power. NERC's cold weather standard EOP-012 now requires generator owners to implement freeze protection measures and cold weather preparedness plans, and TPL-008-1 adds benchmark extreme heat and cold events to transmission planning assessments.
4.4 Physical, cyber and space-weather threats
- Physical attacks. In December 2022, gunfire damaged two distribution substations in Moore County, North Carolina, leaving roughly 40,000–45,000 customers without power for several days. The event led FERC to direct a review of CIP-014, the physical security standard for critical transmission stations. Resilience measures include perimeter protection, ballistic barriers for transformers, spare transformer strategies and mobile substations.
- Cyber threats. The NERC CIP standards cover bulk electric system cyber assets, and CIP-013 addresses supply chain risk. As more control moves to software, including inverter firmware, distributed energy resource management systems (DERMS) and cloud-hosted tools, the boundary of what counts as critical keeps expanding.
- Geomagnetic disturbances. The March 1989 geomagnetic storm collapsed the Hydro-Québec 735 kV system in about 90 seconds and left about six million people without power for roughly nine hours. TPL-007 requires US planners to assess GMD vulnerability and develop corrective action plans.
4.5 Transmission and distribution coordination
Most new resources are connected at the distribution level, while the bulk system is still operated as if distribution were a passive load. That gap affects resilience in several ways:
- Visibility. Rooftop PV, behind-the-meter storage and electric vehicle charging change net load in ways the transmission operator cannot see directly. Distribution-connected PV tripping for transmission faults has added to the generation lost in several Western events.
- Data exchange. The IEC Common Information Model (CIM) gives transmission and distribution models a common format, which makes it practical to exchange network models and DER aggregations.
- Speed. Real-time contingency analysis typically runs on state estimator snapshots every few minutes. Oscillations, fast ramps and IBR control interactions happen in seconds or less. PMU data at 30 or 60 samples per second, and linear state estimators built on it, close part of that gap.
- Power quality. Harmonics and supraharmonics from power electronics, and resonances between capacitor banks and cable capacitance, are now routine planning concerns. IEEE 519 limits still apply at the point of common coupling.
- Coordinated emergency response. UFLS, manual load shedding and restoration plans need to account for feeders that now export power, and for DER that will reconnect automatically after an outage under IEEE 1547-2018 settings.
5. Getting more from existing wires: grid-enhancing technologies
Building new transmission takes seven to ten years in much of the US. Grid-enhancing technologies (GETs) increase the capability of existing assets in months and add operational flexibility during emergencies. The three main families are dynamic line ratings, advanced power flow control and topology optimization.
5.1 Dynamic and ambient-adjusted line ratings
Overhead line ratings are traditionally static. They are calculated for conservative weather, typically a hot summer afternoon with a light crosswind and full sun. FERC Order No. 881 requires transmission providers to use ambient-adjusted ratings (AARs) that update with forecast air temperature, plus seasonal ratings. Dynamic line ratings (DLR) go further by also using measured or forecast wind and solar conditions.
The rating comes from the IEEE 738 steady-state heat balance: the current at which heat gained from resistive losses and the sun equals heat lost by convection and radiation, at the conductor's maximum operating temperature:

Worked example 7 — DLR on a 230 kV line. Keentel applied the IEEE 738 method to a 230 kV line with 795 kcmil 26/7 ACSR "Drake" conductor (28.1 mm diameter), a 100 °C maximum operating temperature, emissivity 0.7, absorptivity 0.9 and 300 m elevation.
| Condition | Ambient | Wind | Solar | Rating (A) | Rating (MVA) | vs. static |
|---|---|---|---|---|---|---|
| Static (conservative) | 40 °C | 0.61 m/s (2 ft/s), perpendicular | 1,000 W/m² | 976 | 389 | — |
| Ambient-adjusted | 25 °C | 0.61 m/s, perpendicular | 1,000 W/m² | 1,109 | 442 | +14% |
| Dynamic, breezy afternoon | 25 °C | 1.5 m/s at 45° | 600 W/m² | 1,320 | 526 | +35% |
| Dynamic, cool calm night | 10 °C | 0.3 m/s at 45° | 0 | 1,118 | 446 | +15% |
| Dynamic, hot still afternoon | 38 °C | 0.3 m/s at 20° | 1,000 W/m² | 752 | 300 | −23% |
Two lessons follow. First, DLR usually adds 10–35% capacity, and the gains are often largest during windy storms and cold fronts, which is exactly when generation patterns shift and transmission is under stress. Second, the last row shows that a static rating is not always conservative. On a hot, still afternoon, the line's real capability can fall well below its static rating. DLR is a safety tool as well as a capacity tool, and that matters in heat waves.
5.2 Power flow control and topology optimization
Advanced power flow controllers, including modular static synchronous series compensators (SSSCs) and phase-shifting transformers, push flow away from overloaded paths onto underused ones. Topology optimization software finds switching configurations, such as opening a 138 kV breaker or splitting a bus, that relieve congestion or post-contingency overloads. Both give operators extra tools when a storm has removed several elements and the remaining network is stressed.
6. Hardening the infrastructure
6.1 Transmission structures and conductors
- Structure loading. Many older lines were designed to the minimum loading districts of the National Electrical Safety Code (NESC). Rebuilding critical lines with steel or concrete poles designed for extreme wind and ice, adding anti-cascade structures at intervals, and replacing aging wood are the most common transmission hardening measures. The Gulf Coast experience after 2020–2021 shows how structure failures dominate restoration time.
- Advanced conductors. Reconductoring with high-temperature, low-sag (HTLS) or other advanced conductors can roughly double a corridor's thermal capacity on existing structures, usually far faster than building a new line. Each project needs a structural check, a sag and clearance check at the higher operating temperature, and a review of terminal equipment ratings.
- Insulation and shielding. Upgrading insulation in contaminated or smoke-prone areas and adding or improving shield wires and line surge arresters reduces flashovers.
- Substations. Typical measures are raising control equipment above design flood elevation, building flood walls, hardening control-house roofs and doors against wind, and seismic qualification of equipment to IEEE 693 in seismic zones. Mobile transformers and mobile substations at 115–230 kV are valuable spares.
6.2 Distribution hardening
- Pole replacement and upgrades to higher strength classes on backbone feeders.
- Vegetation management on a shorter cycle, and removal of hazard trees outside the right-of-way, which cause many storm outages.
- Covered (tree-wire) conductors reduce faults from vegetation contact and wildfire ignition risk at a fraction of the cost of undergrounding. They need suitable hardware and lightning protection.
- Undergrounding removes exposure to wind, ice and vegetation, but costs several times more per mile, takes longer to repair when it fails, and is vulnerable to flooding and storm surge. It is most justified in high-consequence wildfire areas, dense urban cores and the last spans that repeatedly fail.
- Sectionalizing and automation. Reclosers, automated switches and FLISR shrink the number of customers affected by each fault and restore unfaulted sections automatically in seconds to minutes.
6.3 Wildfire-specific measures
In wildfire-prone areas, the grid has to avoid starting fires as well as survive them. Mitigation includes fast-trip and sensitive ground fault settings during high-risk conditions, disabling reclosing on high-risk feeders, covered conductors, undergrounding the highest-risk segments, weather stations and fire cameras, and PSPS. PSPS is effective at preventing ignitions but is itself a planned outage, so reducing PSPS scope through sectionalizing, microgrids and hardening is a resilience goal in its own right.
7. Monitoring, protection and automation
- Advanced metering infrastructure (AMI) reports outages and voltage at the customer level, which speeds damage assessment and shows which customers are still out after crews think a feeder has been restored.
- Wide-area monitoring, protection and control (WAMPAC) uses synchronized phasor measurements under IEEE C37.118 to detect oscillations, islanding and voltage instability in real time. After the 2025 Iberian Peninsula blackout, the European expert panel recommended much wider PMU coverage. US operators that already have it use it to locate oscillation sources in IBR-rich areas.
- Distribution fault anticipation (DFA) and other waveform analytics detect pre-failure signatures such as failing clamps, arcing in vegetation contact and incipient cable faults, before they become outages or ignition sources.
- Remedial action schemes (RAS) extend the capability of the system for specific contingencies, but they add complexity. Several large disturbances have involved a RAS that was armed differently from what the operators or the real-time model assumed. Every RAS needs clear arming procedures, model representation and periodic review.
- Protection for low-fault-current systems. As IBRs replace synchronous machines, fault currents fall and become more controlled. That affects distance, overcurrent and directional elements. Protection studies need IBR fault models that reflect the actual inverter controls, not generic voltage-behind-impedance sources.
8. Local resources: microgrids, storage and flexible demand
8.1 Microgrids for critical loads
A microgrid with local generation, storage and controls can keep a hospital, water plant, emergency operations center or community shelter energized when the bulk grid is down. Relevant US standards include IEEE 1547-2018 (DER interconnection, including intentional islanding) and IEEE 2030.7 and 2030.8 (microgrid controller specification and testing). The design questions are how long the microgrid must island, which loads it serves, how it resynchronizes, and how its protection works with much lower fault current in island mode.
Worked example 8 — sizing storage for a 72-hour critical load.
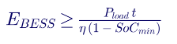
A 2 MW critical facility must be served for 72 hours without the grid. Keentel modeled an hourly energy balance with 95% one-way battery efficiency and a 20% minimum state-of-charge reserve:
| Configuration | Required BESS energy |
|---|---|
| Battery only, 72 h | 189 MWh |
| Battery + 6 MWac PV, clear days (about 45.6 MWh/day of PV) | 42 MWh |
| Battery + 6 MWac PV at 30% output (storm cloud cover) | 136 MWh |
Solar cuts the storage requirement by about 78% on clear days, but only by about 28% under storm skies. A practical design therefore combines storage for fast response and grid-forming control, PV for daytime energy, and a dispatchable backup generator with fuel for several days. The storage provides the stable island voltage and frequency, and the generator covers the long tail.
8.2 Battery storage on the bulk system
Utility-scale battery energy storage systems (BESS) now provide fast frequency response, voltage support and, with grid-forming inverters, black start capability. In several recent US disturbances, battery response contributed to faster frequency recovery. For resilience, the key specifications are the state of charge held in reserve during forecast extreme events, grid-forming capability, ride-through to IEEE 2800 and PRC-029, and whether the plant can energize a transmission path from black.
8.3 Demand response and virtual power plants
Demand response, distributed storage and flexible loads aggregated into virtual power plants (VPPs) can shave peaks during extreme heat or cold and reduce the load that must be restored after an outage. Advanced distribution management systems (ADMS) and DERMS coordinate these resources with feeder switching and voltage control. For resilience, the question is whether the resource will be available and controllable during the event. Behind-the-meter batteries may be fully discharged by the customer, and communications may be down.
9. Modeling the new grid: EMT and model quality
Positive-sequence RMS stability programs remain the workhorse for large-system planning, but they cannot represent fast inverter controls, phase-locked loop dynamics, protection functions inside the inverter, or sub-synchronous interactions. Many US transmission owners and ISOs now require an EMT model for every new IBR plant, and increasingly for large power-electronic loads.
A practical EMT model requirement covers the following:
- Real-code representation of the inverter and plant controller, with the same firmware version as the equipment that will be installed.
- All protection functions that can trip the plant or reduce its output, including instantaneous over-voltage, frequency and phase-jump protection.
- Correct representation of plant-level controls, collector system, main power transformer and reactive devices.
- Validated performance across a defined range of short-circuit ratios, including weak-grid conditions.
- Compatibility with the transmission owner's simulation tool versions, plus documentation, parameter lists and benchmark results.
- A model verification process before the model is accepted, and an as-built parameter update once commissioning settings are final.
Keentel's experience is that a large share of first-submission EMT models fail at least one of these checks. The most common problems are generic controls in place of real code, missing protection functions, and settings that differ from the commissioned plant.
10. Data, analytics and AI
Machine learning is useful in resilience work where there is plenty of data and a clear prediction target:
- Supervised learning for outage prediction before a storm (which feeders, how many customers, how many crews), vegetation risk from LiDAR and satellite imagery, and equipment failure probability.
- Unsupervised learning for anomaly detection in PMU, AMI and DFA data.
- Reinforcement learning for switching and restoration sequencing, still mainly in research and pilot use.
- Large language models for searching procedures, summarizing event logs and drafting reports. Operational data and critical infrastructure details should not be shared with public AI services, and outputs must be checked by an engineer.
AI does not replace physics-based studies. It is best used to focus scarce engineering attention, such as which feeders to harden first or which oscillation to investigate, and to speed up the operator's picture of the system during an event.
11. Operational and organizational resilience
Hardware sets how much damage an event causes. Organizations decide how long it lasts.
- Black start and restoration. NERC EOP-005 requires Transmission Operators to keep restoration plans built around black start resources, and to test them. Winter Storm Elliott showed that black start units share the same fuel and freezing risks as the rest of the fleet. Diversity of black start fuel, cold weather testing, and battery or hydro black start options all reduce that common-mode risk. Restoration plans should also cover energizing long cables and IBR-rich areas, operating FACTS devices at low short-circuit levels, and synchronizing islands.
- Situational awareness. Operators need to see the system's true state, including RAS arming status, DER output and large-load status. Several disturbances in recent years were made worse because real-time contingency analysis was not set up to alarm on a condition the operators did not know about.
- Training. Operator training simulators should include multi-entity restoration, islanding, IBR-driven oscillations and large-load events, not only the classic loss-of-generation drills.
- Spares and supply chain. Lead times for large power transformers, high-voltage breakers and some protection equipment now run to years. Shared spare programs, standardized specifications and mobile substations reduce exposure. Supply chain cyber risk is covered by CIP-013.
- Mutual assistance. The restoration speed after Hurricane Helene relied on tens of thousands of crew members from across North America. Pre-arranged mutual assistance agreements, staging sites and logistics plans are core resilience assets.
- Workforce. Protection engineers, EMT modelers and experienced system operators are scarce. Documented procedures, cross-training and partnerships with universities and consultants protect institutional knowledge.
- Gas-electric coordination. Operators should know which plants have firm fuel, dual-fuel capability and on-site storage, and should coordinate with pipelines before forecast cold events.
12. A risk-based framework for choosing investments
12.1 The process
Keentel uses a seven-step framework that fits naturally into an integrated resource plan, a transmission planning cycle or a state resilience filing:
- Identify threats relevant to the service area: hurricane, ice, extreme cold, heat, wildfire, flood, earthquake, physical and cyber attack, GMD.
- Model hazard intensity for each threat, such as wind speed return periods, ice thickness, flood depth or fire weather index.
- Assess vulnerability with fragility curves for poles, structures, substations and generation, and with system models showing how damage turns into customer outages.
- Estimate consequences in customer-hours, critical load lost, unserved energy and societal cost, using a stated VoLL range.
- Evaluate options for how each reduces probability, depth, duration or consequence.
- Rank and select by cost per unit of risk reduced, subject to constraints such as critical facilities, equity and regulatory direction.
- Measure and adapt by tracking performance in real events and updating the models.
12.2 Ranking options by cost per avoided customer-minute
A simple, transparent ranking divides each option's levelized annual cost by the customer-minutes it avoids each year:

Worked example 9 — ranking six options (7% discount rate, illustrative costs).
| Option | Capital cost | Life (yr) | Avoided CMI per year | Levelized cost per year | Cost per avoided CMI |
|---|---|---|---|---|---|
| Reclosers + FLISR on 12 feeders | $4.5 M | 15 | 9.0 M | $0.49 M | $0.055 |
| Enhanced vegetation management | $3.0 M | 5 | 6.0 M | $0.73 M | $0.12 |
| Transmission structure hardening, 115 kV | $30 M | 50 | 12.0 M | $2.17 M | $0.18 |
| Covered conductor, 40 miles | $24 M | 40 | 7.5 M | $1.80 M | $0.24 |
| Critical-facility microgrid, 3 MW | $9 M | 20 | 2.0 M | $0.85 M | $0.42 |
| Targeted undergrounding, 15 miles | $45 M | 50 | 6.0 M | $3.26 M | $0.54 |
Automation and vegetation work usually rank first. That does not mean microgrids and undergrounding are poor investments. Customer-minutes treat every customer equally, while a microgrid serving a hospital or water plant protects far more societal value per minute, and undergrounding in a wildfire zone avoids ignition risk that CMI does not capture. Keentel therefore uses CMI ranking as a first screen, then applies weighting for critical customers, wildfire risk reduction and equity, and reports both results.
12.3 Planning beyond N-1
US planning standards already include some resilience scenarios:
- TPL-001 requires assessment of extreme events, such as the loss of all lines on a common corridor or an entire substation. Mitigation is not mandatory, but the cost of actions to reduce the consequences must be evaluated.
- TPL-007 covers benchmark geomagnetic disturbances.
- TPL-008-1 adds benchmark extreme heat and cold events, with corrective action plans where performance criteria are not met.
- FERC Order No. 1920 requires long-term regional transmission planning over at least 20 years with multiple scenarios, including extreme weather.
A resilience-aware planning study adds scenarios built from real events in the region, such as the loss of a coastal transmission corridor, a multi-day cold snap with gas curtailment, or a wildfire outage of a double-circuit 230 kV path. It then tests both the deterministic performance and the restoration path back to normal.
13. US standards map for reliability and resilience
| Area | Key standards and guidance |
|---|---|
| Distribution reliability indices | IEEE 1366-2022 |
| Transmission planning | NERC TPL-001, TPL-007 (GMD), TPL-008 (extreme temperature) |
| Cold weather | NERC EOP-012 |
| Restoration | NERC EOP-005 (black start), EOP-006 (Reliability Coordinator restoration) |
| Physical and cyber security | NERC CIP-002 to CIP-014, including CIP-013 (supply chain) and CIP-014 (physical security) |
| IBR performance | IEEE 2800-2022; NERC PRC-029-1 (ride-through), PRC-030-1 (event mitigation), PRC-024 (generator frequency and voltage protection settings), MOD-026/027 (model verification) |
| Disturbance monitoring | NERC PRC-002, PRC-028 (IBR disturbance monitoring) |
| DER and microgrids | IEEE 1547-2018 and 1547.1; IEEE 2030.7 and 2030.8 |
| Line ratings | IEEE 738; FERC Order No. 881 (ambient-adjusted ratings) |
| Seismic | IEEE 693 |
| Power quality | IEEE 519 |
| Synchrophasors | IEEE C37.118 |
| Safety and structures | National Electrical Safety Code (NESC, ANSI C2) |
Three lessons stand out:
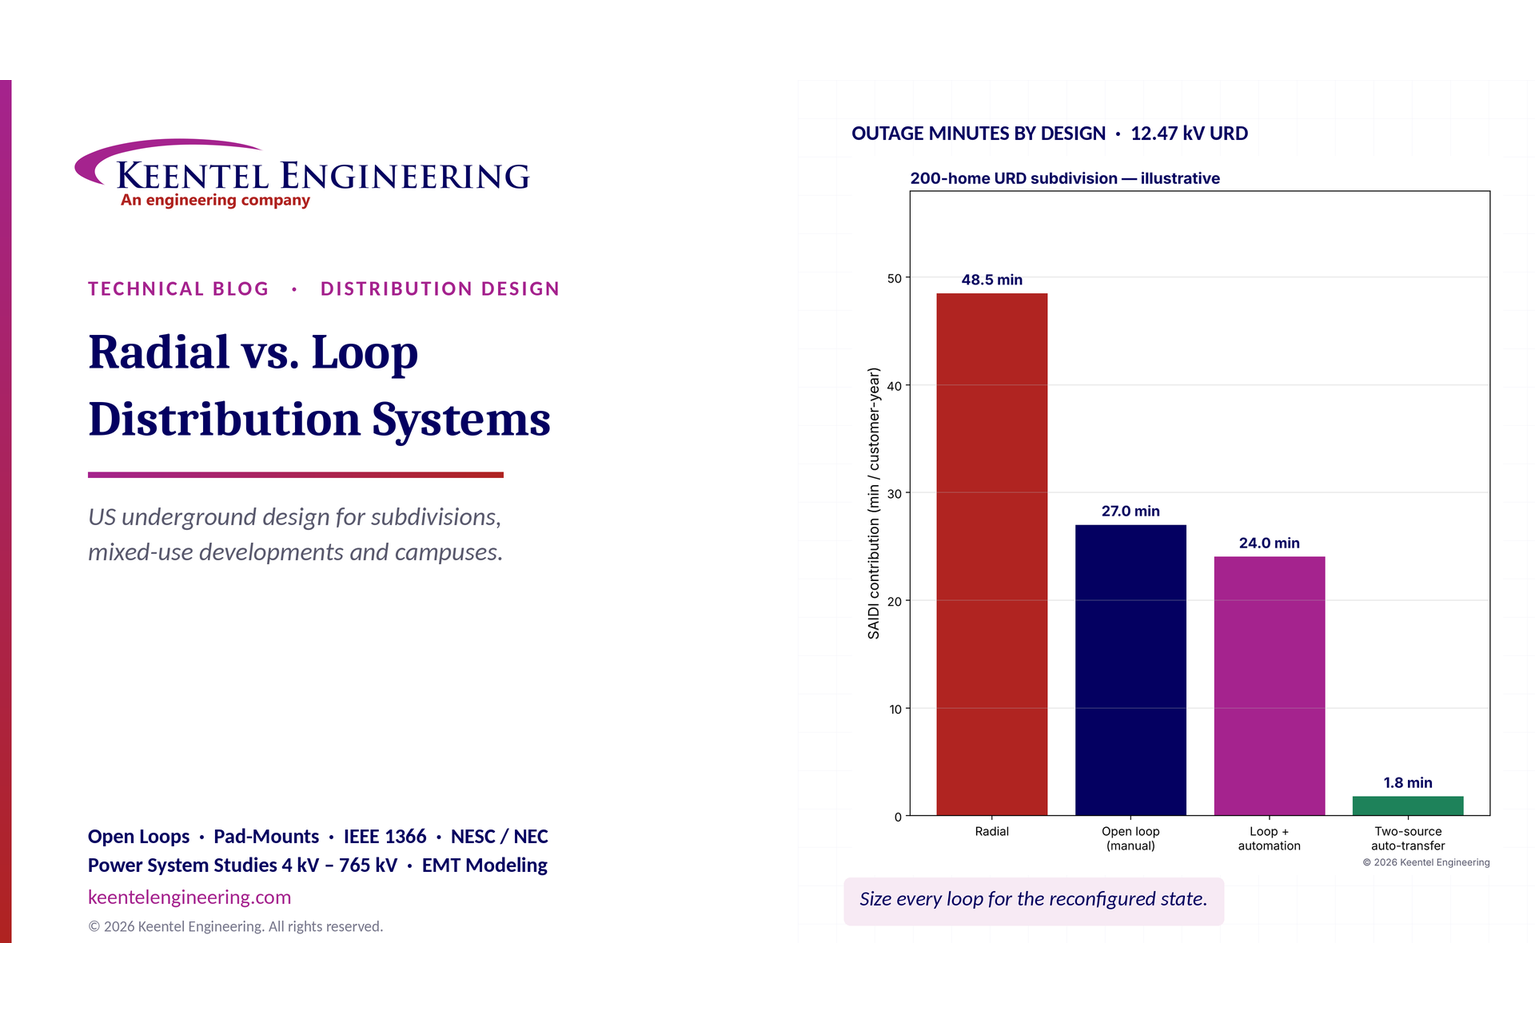
- The loop roughly halves the subdivision's outage minutes by turning repair time into switching time.
- Automation on a single-source loop adds little once manual switching is reasonably fast, because upstream outages now dominate. (Restoration within five minutes would also count as momentary under IEEE 1366, so those minutes would leave SAIDI entirely.)
- The second source is where the big gain lies. It only works if the second feeder is truly independent — a different substation bus or substation, a different route — and has capacity to pick up the load.
A fair comparison must also consider that a radial design would rarely put all 200 homes on one lateral. Split into four radial laterals, the cable-fault contribution falls to about 6.1 minutes — still twice the loop's 3.1 minutes, and with a six-hour outage for every affected customer rather than 90 minutes.
9.3 Frequency vs. duration
A single-source loop does not reduce how often customers are interrupted by cable faults (SAIFI) by much: the faulted half still loses power until switching. In the model, SAIFI falls only from 0.32 to 0.29. The loop's value is in duration. Customers notice both, but long outages drive complaints, spoiled food and frozen pipes.
10. Automation and FLISR
Fault location, isolation and service restoration (FLISR) uses automated switches or fault interrupters, sensors and communications — managed locally or by an advanced distribution management system (ADMS) — to isolate a faulted section and restore the healthy sections automatically, typically within one to five minutes.
For underground systems, automation lives in pad-mounted switchgear at the main branch points: motor-operated load-interrupter switches and vacuum fault interrupters with electronic controls (IEEE C37.60), voltage and current sensors, and radio or fiber communications. Individual residential loop-feed transformers are rarely automated; instead, automated switchgear divides a large development into zones, and each zone is a small manual loop.
Design considerations for automated loops:
- Capacity checks before transfer. The scheme must confirm the alternate source can carry the transferred load, using real-time or seasonal limits.
- Protection settings after transfer. Fault-interrupter settings that coordinated in the normal configuration may not coordinate after transfer. Use adaptive setting groups.
- Cybersecurity and communications reliability. Utility distribution automation is outside NERC CIP but subject to utility security programs; campus owners need their own controls.
- Arc-flash. Remote operation removes workers from the switching location, a safety gain in itself.
11. Grounding and the neutral
US distribution is predominantly four-wire multigrounded wye: the neutral is carried with the phase conductors and grounded at the substation, at every transformer and at intervals along the line (NESC Rule 96 sets minimum grounding for multigrounded systems). In URD, the cable's concentric neutral serves as the neutral conductor and part of the grounding system, and a ground rod or ring is installed at each pad-mount.
Practical points:
- Neutral sizing. Single-phase URD loops normally use a full neutral (equal ampacity to the phase), because the neutral carries the full load current back. Three-phase cables may use a one-third neutral where the load is balanced.
- Neutral corrosion. Older bare concentric neutrals in corrosive soils lost strands over time and raised fault and touch voltages. Jacketed cable is now standard.
- Fault return. A ground fault on a URD loop returns mainly through the concentric neutral, which keeps fault current high enough to blow the fuse quickly. Broken neutrals are a recognized cause of slow-clearing faults and elevated touch voltages; cable testing should include neutral checks.
- Customer side. The service neutral bonds to the customer's grounding electrode system under NEC Article 250; stray-voltage concerns on farms and pools trace back to neutral-to-earth voltage on multigrounded systems.
12. Arc-flash and switching safety
Operating load-break elbows, replacing bayonet fuses and working in secondary compartments are among the most hazardous routine tasks in URD work.
- Primary compartment. Utility workers follow NESC Part 4, Rule 410, which requires arc-flash assessment and provides tables for typical distribution tasks; non-utility workers on customer-owned systems follow NFPA 70E. IEEE 1584-2018 calculates incident energy for three-phase equipment from 208 V to 15 kV; it does not model single-phase arcs, so single-phase 7.2 kV and 120/240 V tasks need the NESC or NFPA 70E table methods or engineering judgment.
- Secondary compartment. A fault on the 240 V side of a 75 kVA unit draws about 14.7 kA, but on the primary this is only about 14,700 × 240 / 7,200 ≈ 490 A — a current the bayonet fuse may take seconds to clear. Long clearing times mean high incident energy at low voltage. Many utilities require de-energizing the transformer, or the highest PPE category, for secondary compartment work.
- Switching orders. Every loop reconfiguration should follow a written, verified switching order with lockout/tagout, voltage testing and grounding of the isolated section before cable work begins.
- Elbow operation. Load-break elbows interrupt load, not fault current. Closing an elbow into a faulted section is limited by its fault-close rating; isolate and test the section before re-energizing.
13. Electrification and DER
13.1 EVs and heat pumps
Electrification raises both peak demand and coincidence. Practical responses in loop design:
- design transformer pads, secondary pedestals and conduit for the next transformer size;
- limit homes per transformer (six to eight rather than ten to twelve) for new all-electric developments;
- size the loop for the future reconfigured load (Worked example 2's 1,800 kVA case);
- work with the utility on managed charging programs, which can shift EV load and protect transformers far more cheaply than larger equipment.
13.2 Rooftop solar and batteries
Residential solar under IEEE 1547-2018 and UL 1741 SB can raise secondary voltage at midday and reverse power flow through the pad-mount transformer.
- Voltage. On long secondaries with many systems, voltage can exceed the 126 V upper limit of ANSI C84.1 Range A. Smart-inverter volt-var and volt-watt functions help; short secondaries and adequately sized transformers help more.
- Loop reconfiguration. With the open point moved, the same DER is connected farther from the source, so voltage rise and hosting capacity change. Hosting capacity studies should cover the reconfigured state.
- Protection. Small inverter-based DER contributes little fault current, so fuse coordination is rarely affected. However, inverters must cease to energize on loss of the utility source, which matters for crew safety when a loop section is isolated.
- Batteries and backup. Home batteries with backup capability isolate from the grid during outages through transfer equipment; they reduce the customer impact of outages but do not change utility reliability indices.
14. Resilience: flood, wind and wildfire
Underground distribution removes most exposure to wind, ice and vegetation. In a hurricane or ice storm, URD subdivisions often keep power while overhead areas do not — until the overhead feeder that supplies them fails. Undergrounding the development does not undergird the feeder, which is another argument for two-source loops.
Underground systems have their own hazards:
- Flooding. Pad-mounted transformers and switchgear in floodplains should be placed above the design flood elevation or specified as submersible. Saltwater from storm surge damages equipment that survives fresh-water flooding.
- Dig-ins. Third-party excavation damage is a leading cause of URD faults. Warning tape, accurate as-builts and "call before you dig" (811) participation reduce it.
- Wildfire. Underground cable eliminates ignition risk along those segments; pad-mounted equipment still needs defensible space and fire-resistant enclosures in high-risk areas.
- Aging cable. First-generation polyethylene URD cable installed in the 1970s and 1980s has high failure rates from water treeing. Diagnostic testing — very-low-frequency (VLF) tan delta under IEEE 400.2 and partial discharge under IEEE 400.3 — prioritizes replacement or rejuvenation.
15. Costs (indicative)
Installed costs vary widely by region, soil, labor, trenching method and the post-2021 rise in transformer and switchgear prices. The ranges below are indicative for 2026 planning only.
| Event | What happened | Main lesson |
|---|---|---|
| Hurricanes Irma and Maria, Puerto Rico, 2017 | Island-wide collapse of generation, transmission and distribution; about 11 months to full restoration | Hardening, spares and logistics planning must assume a total system loss on an island grid |
| Winter Storm Uri, Texas, 2021 | Up to about 20,000 MW of load shed; system minutes from collapse | Fuel supply and winterization are as important as electrical design; small interconnection capacity limits outside help |
| Hurricane Ida, Louisiana, 2021 | All eight lines into New Orleans out; widespread structure damage | Corridor diversity and structure strength into load pockets; local generation and islanding capability |
| Texas Panhandle wind events, 2022 | Wind plants reduced output for normally cleared 345 kV faults | IBR ride-through, plant controller tuning and performance validation |
| Southern California PV events, 2021 | Hundreds of MW of solar lost in each of four events, some initiated by wildfire smoke | Inverter protection settings, EMT models and distribution PV behavior |
| Winter Storm Elliott, 2022 | About 90.5 GW of unplanned generation outages at the peak | Cold weather standards, gas-electric coordination, black start fuel diversity |
| Moore County, North Carolina, 2022 | Gunfire damaged two substations; tens of thousands out for days | Physical security and spare equipment for distribution substations, not only critical transmission |
| Hurricane Helene, 2024 | Largest transmission outage event in NERC's 2015–2024 record, yet 95% of outages restored in about a week | Mutual assistance and restoration logistics can offset very large event size |
| Large-load loss, Eastern Interconnection, 2024 | About 1,500 MW of data center load transferred off-grid for a normally cleared fault | Large-load ride-through, visibility and modeling requirements |
| Iberian Peninsula blackout, 2025 | Voltage-control and oscillation problems led to cascading generation trips and a total blackout of Spain and Portugal | Dynamic voltage control from all resources, PMU coverage and restoration readiness in high-IBR systems |
| Western Interconnection disturbance, 2025 | A planned 500 kV outage with a RAS change and multiple prior outages led to voltage collapse and islanding of part of the region | Real-time model accuracy, RAS coordination and conservative operations under reduced margins |
16. A practical roadmap
For a utility, ISO or large customer starting a resilience program, Keentel recommends the following sequence:
- Year 0–1: Baseline. Report IEEE 1366 indices with and without MEDs. Build resilience curves for the last five large events. Create a threat register with expected annual loss. Inventory critical customers and backup power.
- Year 0–1: Quick wins. Expand reclosers and FLISR, tighten vegetation programs, deploy ambient-adjusted ratings, review RAS documentation and real-time model alarms, and confirm black start fuel and cold weather readiness.
- Year 1–3: Studies. Run extreme-event and TPL-008 assessments. Complete EMT studies in weak, IBR-rich areas. Set large-load interconnection requirements. Prioritize hardening using risk-based ranking.
- Year 1–5: Build. Harden priority transmission corridors and substations, build microgrids for critical facilities, add grid-forming storage, deploy PMUs and DFA, and run targeted undergrounding where wildfire or repeated damage justifies it.
- Every year: Learn. Measure performance in each real event against the resilience curves, update fragility and cost assumptions, and feed the lessons into the next plan.
Part C — Three Anonymous US Case Studies
The following case studies are composites based on the kinds of projects Keentel Engineering supports. Names, locations and some figures have been changed or generalized to protect client confidentiality.
Case study 1 — Gulf Coast transmission hardening after back-to-back hurricanes
Situation
A vertically integrated utility on the Gulf Coast had been hit by four named storms in two seasons. Its 115 kV and 230 kV network into a coastal load pocket had lost hundreds of structures, and in the worst event every transmission path into the pocket was out at the same time. The state commission asked for a resilience plan with a quantified benefit case before approving accelerated cost recovery.
What Keentel did
- Built outage, restore and performance curves for each storm from the utility's outage records, using the same element-days and MVA-days approach NERC uses in its TADS analyses.
- Ran "rerunning history" scenarios: removing the outages that specific hardening projects would have prevented, and shortening restore times for projects that improve access or add mobile equipment.
- Developed fragility curves for wood H-frame, lattice steel and steel monopole structures against design wind speed, and combined them with regional hurricane return periods to estimate expected annual loss for each corridor.
- Ranked 37 candidate projects by cost per MVA-day avoided, then applied a second screen for paths that close the load pocket to the rest of the system.
Outcome
The first-phase portfolio replaced 140 miles of wood structures on three corridors with steel monopoles designed for higher wind loading, added anti-cascade structures, raised control equipment at four flood-exposed substations, and bought two 230/115 kV mobile transformers. Modeled MVA-days lost in a repeat of the worst storm fell by about 45%. Most of the benefit came from preventing the early, long-duration outages on the paths into the load pocket, which also cut the nadir the most.
Lesson
Hardening is most valuable where an outage both happens early and lasts long. Ranking projects by their effect on the resilience curve, not just on outage counts, targets those elements directly.
Case study 2 — Western distribution utility balancing wildfire risk and outage impact
Situation
A distribution utility in a high wildfire-risk area of the West relied heavily on public safety power shutoffs. PSPS events had prevented ignitions, but they left tens of thousands of customers, including a regional hospital and two water treatment plants, without power for up to three days at a time. The utility needed a mitigation plan that reduced both ignition risk and PSPS impact.
What Keentel did
- Combined the utility's ignition risk model with a consequence model of customer-hours lost to PSPS and to storm outages on each of 118 circuits.
- Evaluated covered conductor, targeted undergrounding, sectionalizing devices, fast-trip settings, and microgrids for critical facilities, using levelized cost per avoided customer-minute and per unit of ignition risk reduced.
- Designed protection settings for high-risk days: sensitive ground fault detection, reclosing blocked on high-risk sections, and fast curves coordinated with downstream fuses.
- Specified two microgrids, one at the hospital (3.5 MW) and one at the larger water plant (2 MW). Each combines grid-forming battery storage, PV and existing diesel generation, with protection designed for the low fault current available in island mode.
Outcome
The plan placed covered conductor on about 60% of high-risk overhead miles and undergrounded only the 8% of miles with the highest combined ignition and egress risk. Added sectionalizing reduced the average number of customers in each PSPS de-energization zone by about 60%. With the microgrids in service, both critical facilities can stay energized through a 72-hour PSPS event without relying only on diesel.
Lesson
Covered conductor and sectionalizing addressed most of the risk at a fraction of the cost of system-wide undergrounding. Microgrids are justified by the value of the specific loads they protect, not by a general CMI calculation.
Case study 3 — Interconnecting a 1.2 GW data center campus at 345 kV
Situation
A developer proposed a 1.2 GW AI data center campus to be built in three phases at a new 345 kV substation in a region that already had significant wind and solar. The transmission owner was concerned about voltage-sensitive load loss, sudden load swings and the campus's effect on regional UFLS and restoration plans.
What Keentel did
- Built a detailed EMT model of the campus's medium-voltage distribution, UPS systems, on-site BESS and transfer logic, using vendor-specific control models for the UPS and battery inverters.
- Simulated normally cleared faults at 345 kV and 138 kV across a range of system strengths. The original design moved the full campus to UPS batteries for any voltage dip below 0.8 per unit lasting more than about 50 ms, which would have removed up to 1.2 GW from the grid for a single nearby fault.
- Worked with the developer's electrical designers to change the UPS input voltage tolerance and transfer logic, so the campus rides through faults that the transmission system clears normally while still protecting the IT load.
- Set requirements for controlled ramp-back after any transfer, telemetry to the Transmission Operator (real and reactive power, UPS and generator status, PMU data at the point of interconnection), and coordination of facility protection with utility reclosing.
- Studied the campus's on-site BESS as a resource that could smooth training-workload power swings and, under a separate agreement, provide emergency load reduction.
Outcome
With the revised settings, simulated load loss for the most severe normally cleared fault fell from 1.2 GW to under 100 MW, which is within the region's existing operating margins. The transmission owner adopted the study's ride-through, telemetry and ramp-rate requirements in its new large-load interconnection guideline.
Lesson
Large loads can be designed to support grid reliability, but only if ride-through and control requirements are set early, before UPS and transfer equipment is specified and ordered.
Part D — 20-Question Technical FAQ
1. What is the difference between grid reliability and grid resilience?
Reliability measures how well the grid performs under normal conditions and credible contingencies, typically through SAIDI, SAIFI, LOLE and N-1 compliance. Resilience is the grid's ability to anticipate, absorb, recover from and adapt to high-impact, low-probability events such as hurricanes, extreme cold, wildfire and attacks.
2. Is there a standard resilience metric like SAIDI?
Not yet. Utilities and regulators use event-based measures such as customer-hours lost, nadir, time to restore 50% and 95% of customers, critical load served, and the number of customers out for more than 24, 72 or 168 hours. NERC uses element-days and MVA-days lost for transmission events.
3. What are major event days and why do they matter for resilience?
Under IEEE 1366, a major event day is a day whose SAIDI exceeds exp(α + 2.5β), calculated from five years of daily data. Excluding MEDs gives a stable picture of day-to-day reliability. The excluded days are where resilience performance shows up, so they should be reported separately, not ignored.
4. What is the resilience trapezoid?
It is the performance curve of an event, with phases for pre-disturbance, degradation, degraded state, restoration and post-restoration. The area above the curve is the total loss. Hardening makes the curve shallower, and restoration capability makes it shorter.
5. Is it better to invest in hardening or in faster restoration?
Both. Reducing outage depth by 10% reduces total loss by 10%. Restoring 10% faster reduces it by less, about 7.6% in Keentel's example, unless the damage-assessment period also shrinks. The best portfolios combine targeted hardening with automation, spares and mutual assistance.
6. How do I put a dollar value on resilience?
Convert customer-hours lost into unserved energy and multiply by a value of lost load (VoLL) range by customer class. Use US interruption cost data such as the LBNL ICE Calculator. State clearly that most survey data covers short outages, and that costs for multi-day outages are less certain.
7. Is one-day-in-ten-years LOLE a NERC requirement?
No. It is a widely used industry convention for resource adequacy. Regions are increasingly looking at expected unserved energy and the size and duration of shortfalls, especially in winter, because LOLE alone can hide them.
8. Why are data centers a reliability concern?
Large data center campuses can be hundreds of megawatts to more than 1 GW, can grow quickly, and can transfer to backup power within cycles during a voltage dip. NERC has documented about 1,500 MW of load dropping off for a single normally cleared fault. Ride-through, telemetry, ramp limits and EMT studies address the risk.
9. What does IEEE 2800 cover?
IEEE 2800-2022 sets uniform minimum technical capabilities and performance for IBRs connected to transmission and sub-transmission systems. It covers ride-through, reactive power and voltage control, frequency response, power quality and protection. Many US transmission owners reference it in their interconnection requirements.
10. How does PRC-029 relate to IEEE 2800?
PRC-029-1 is the NERC standard, approved by FERC in 2025, that sets mandatory frequency and voltage ride-through requirements for IBRs. It aligns in many respects with IEEE 2800 ride-through but is a mandatory reliability standard with its own applicability and exemption rules.
11. When is an EMT study needed?
When IBRs or large power-electronic loads connect in weak areas with a low short-circuit ratio, near series capacitors or HVDC, or in clusters where control interactions are possible. An EMT study is also needed when a disturbance needs to be reproduced in detail. Many US transmission owners now require EMT models for every new IBR.
12. How much capacity do dynamic line ratings add?
Typically 10–35% above a conservative static rating, as in Keentel's 230 kV Drake example (389 MVA static, up to 526 MVA dynamic). On hot, still days, DLR can show that the real capability is below the static rating, which is a safety benefit.
13. Is undergrounding the best way to harden distribution?
Not always. Undergrounding removes wind, ice and vegetation exposure, but it costs several times more than overhead hardening, takes longer to repair, and can flood. It is most justified in high-risk wildfire areas, dense urban cores and repeatedly damaged segments. Covered conductor, pole upgrades and FLISR are often more cost-effective elsewhere.
14. How long should a critical-facility microgrid be able to island?
Usually 72 hours or more for hospitals, water plants and emergency operations centers, based on historical restoration times. A combination of grid-forming storage, PV and a dispatchable generator with several days of fuel is the most robust design. PV alone is unreliable during storms.
15. What did Winter Storm Elliott teach planners?
About 90.5 GW of generation was unavailable at the peak, mostly due to freezing and fuel problems, and many units failed above their stated minimum operating temperatures. The lessons were winterization, gas-electric coordination, realistic cold weather capability data, and fuel diversity for black start resources.
16. What do TPL-008 and EOP-012 require?
TPL-008-1 requires planners to assess benchmark extreme heat and cold events and develop corrective action plans where criteria are not met. EOP-012 requires generator owners to implement freeze protection and cold weather preparedness plans. Confirm the currently effective version of each.
17. How should physical security be addressed?
CIP-014 covers critical transmission stations and their control centers. Distribution substations serving critical loads also deserve protection, as Moore County showed. Measures include barriers, detection, ballistic protection for transformers, mobile substations and pre-positioned spares.
18. Can AI improve resilience?
Yes, mainly by focusing attention: predicting storm damage and crew needs, prioritizing vegetation work, detecting anomalies in PMU, AMI and waveform data, and supporting restoration decisions. AI complements physics-based studies but does not replace them, and sensitive operating data should never be shared with public AI services.
19. How do synchrophasors help in a high-IBR grid?
PMUs measure voltage and current phasors 30 or 60 times per second with precise time stamps. That lets operators see oscillations, locate their sources, detect islanding and run linear state estimation far faster than SCADA-based tools.
20. Where should a utility start?
Report reliability with and without MEDs, build resilience curves for recent large events, create a threat register with expected annual loss, take quick wins in automation, vegetation and ratings, then run extreme-event and EMT studies to prioritize larger investments.
How Keentel Engineering Helps
Keentel Engineering supports utilities, ISOs, developers and large-load customers across the full reliability and resilience lifecycle, at 4 kV to 765 kV:
- Resilience planning: threat registers, fragility modeling, resilience curves, expected-annual-loss and VoLL-based benefit-cost analysis for rate cases and state resilience plans.
- Transmission planning studies: TPL-001 steady-state, short-circuit and stability assessments including extreme events; TPL-007 GMD and TPL-008 extreme temperature assessments; long-term scenario studies.
- EMT modeling and studies: IBR and large-load EMT model review, verification and as-built updates; weak-grid, control interaction and sub-synchronous studies; disturbance reproduction.
- Large-load interconnection: data center and industrial load studies, ride-through and transfer-logic review, telemetry and protection coordination requirements.
- IBR compliance: IEEE 2800 and PRC-029 ride-through assessment, PRC-024, PRC-028, PRC-030 and MOD-026/027 support.
- Protection and automation: relay coordination, low-fault-current protection, FLISR design, RAS review and wildfire-season protection settings.
- Grid-enhancing technologies: IEEE 738 ratings, ambient-adjusted and dynamic line rating implementation, reconductoring studies.
- Microgrids and storage: critical-facility microgrid design, grid-forming BESS specification, black start studies and IEEE 1547 and 2030.7/2030.8 compliance.
- Hardening engineering: transmission structure and substation hardening, flood elevation, mobile substation planning.
Why Clients Choose Keentel
- Senior engineering depth in power system studies, protection and EMT modeling, led by IEEE Senior Member engineers.
- US practice focus: NERC standards, FERC orders, ISO and RTO interconnection processes and state commission requirements.
- Clear, defensible results: calculations and assumptions documented so they hold up in a regulatory filing or a design review.
- Practical recommendations ranked by value and cost, not only by technical merit.
- Responsive delivery for interconnection deadlines, compliance dates and post-event reviews.
Contact Keentel Engineering
Planning a resilience program, a large-load interconnection or an IBR compliance study? Talk to our engineers.
- Phone: (813) 389-7871
- Email: contact@keentelengineering.com
- Book a 15-minute call: calendly.com/keentel-engineering/15min
- Web: keentelengineering.com
References
- IEEE Std 1366-2022, IEEE Guide for Electric Power Distribution Reliability Indices.
- IEEE Std 2800-2022, IEEE Standard for Interconnection and Interoperability of Inverter-Based Resources Interconnecting with Associated Transmission Electric Power Systems.
- IEEE Std 1547-2018, Interconnection and Interoperability of Distributed Energy Resources with Associated Electric Power Systems Interfaces.
- IEEE Std 2030.7-2017 and IEEE Std 2030.8-2018, microgrid controller specification and testing.
- IEEE Std 738-2023, Calculating the Current-Temperature Relationship of Bare Overhead Conductors.
- IEEE Std 693-2018, Seismic Design of Substations; IEEE Std 519-2022, Harmonic Control; IEEE Std C37.118.1, Synchrophasor Measurements.
- NERC Reliability Standards TPL-001, TPL-007, TPL-008, EOP-005, EOP-012, CIP-013, CIP-014, PRC-024, PRC-028, PRC-029 and PRC-030 (nerc.com).
- NERC, State of Reliability report, 2025, including transmission resilience analysis of Hurricane Helene.
- NERC, Odessa Disturbance report (2021) and 2021 California Solar PV Disturbances report (2022).
- NERC, Panhandle Wind Disturbance Report, 2022.
- NERC, Incident Review: Considering Simultaneous Voltage-Sensitive Load Reductions, 2025.
- FERC and NERC, The February 2021 Cold Weather Outages in Texas and the South Central United States, November 2021.
- FERC and NERC, Inquiry into Bulk-Power System Operations During December 2022 Winter Storm Elliott, October 2023.
- FERC Order No. 881 (2021), Order No. 901 (2023) and Order No. 1920 (2024).
- National Infrastructure Advisory Council, Critical Infrastructure Resilience Final Report and Recommendations, 2009.
- Shehabi, A. et al., 2024 United States Data Center Energy Usage Report, Lawrence Berkeley National Laboratory, December 2024.
- Lawrence Berkeley National Laboratory, Interruption Cost Estimate (ICE) Calculator, icecalculator.com.
- ENTSO-E Expert Panel, Grid Incident in Spain and Portugal on 28 April 2025, Final Report, 2026.
- WECC and NERC, review of the November 13, 2025 Wyoming disturbance, 2026.
- US Department of Energy, Grid Deployment Office, Puerto Rico grid recovery and modernization resources.
Disclaimer
This article is for general technical information only and does not constitute engineering advice for any specific project. Worked examples use illustrative assumptions and were prepared for teaching purposes. Standards, regulatory requirements and their effective dates change; always confirm current requirements with the applicable standards body, regulator, Reliability Coordinator and transmission owner. Project decisions should be based on site-specific studies performed by qualified, licensed engineers. Public event information is summarized from publicly available NERC, FERC, WECC, ENTSO-E and US government reports.
| Office | Address | Phone |
|---|---|---|
| Head Office — Tampa | 400 N Ashley Dr STE #2600, Tampa FL 33602 | (813) 389-7871 |
| Austin | 5900 Balcones Drive STE 100, Austin TX 78731 | (512) 591-0752 |
| Sacramento | 1401 21st St Ste R, Sacramento CA 95811 | (916) 913-4524 |
| Baltimore | 306 W Redwood St STE 200, Baltimore MD 21201 | (410) 225-2181 |

About the Author:
Sandip "Sonny" R. Patel, P.E.
IEEE Senior Member · Founder & CEO, Keentel Engineering
In 1995, Sonny Patel earned his Electrical Engineering degree from the University of Illinois. But degrees don't build legacies — action does.
For three decades, he has worked the power industry from every side of the table: 16 years as a utility engineer at Exelon/Commonwealth Edison; generation leadership across hydroelectric, industrial steam turbine, and a 9 GW renewable fleet; NERC Regional Entity Senior Compliance Engineer and Audit Team Lead, auditing some of the nation's largest utilities; and testing and commissioning lead on equipment up to 765 kV — the very top of the North American grid.Utility. Generator. Regulator. Consultant. Few engineers have seen all four seats. Fewer still have sat in them.
His experience spans nuclear, hydro, conventional generation, renewables, oil and gas, mining — and today's data centers, where he is authoring a three-book series on data center design. He is a Licensed Professional Engineer in six states and a Licensed Electrical Contractor in Florida (Unlimited EC) — he doesn't just design the work; he's qualified to stand behind its execution.Today, as Founder and CEO of Keentel Engineering, Sonny leads a nationwide team of engineers delivering substation design, power system studies, NERC compliance, and commissioning — done right, coast to coast.Three decades. Every side of the table. One standard: accountable engineering.
Services

Let's Discuss Your Project
Let's book a call to discuss your electrical engineering project that we can help you with.

About the Author:
Sandip "Sonny" R. Patel, P.E.
IEEE Senior Member · Founder & CEO, Keentel Engineering
In 1995, Sonny Patel earned his Electrical Engineering degree from the University of Illinois. But degrees don't build legacies — action does.
For three decades, he has worked the power industry from every side of the table: 16 years as a utility engineer at Exelon/Commonwealth Edison; generation leadership across hydroelectric, industrial steam turbine, and a 9 GW renewable fleet; NERC Regional Entity Senior Compliance Engineer and Audit Team Lead, auditing some of the nation's largest utilities; and testing and commissioning lead on equipment up to 765 kV — the very top of the North American grid.
Utility. Generator. Regulator. Consultant. Few engineers have seen all four seats. Fewer still have sat in them.
His experience spans nuclear, hydro, conventional generation, renewables, oil and gas, mining — and today's data centers, where he is authoring a three-book series on data center design. He is a Licensed Professional Engineer in six states and a Licensed Electrical Contractor in Florida (Unlimited EC) — he doesn't just design the work; he's qualified to stand behind its execution.
Today, as Founder and CEO of Keentel Engineering, Sonny leads a nationwide team of engineers delivering substation design, power system studies, NERC compliance, and commissioning — done right, coast to coast.Three decades. Every side of the table. One standard: accountable engineering.
Leave a Comment
We will get back to you as soon as possible.
Please try again later.