Part A — What "1 GW" Means, at a Glance
Announcements of gigawatt-scale data center campuses now appear almost every week. A developer says a site will be "1 GW." A utility says it has "1 GW of data center load in the queue." An investor deck promises "1 GW of AI capacity." These three statements can describe three very different things, and none of them, on its own, tells you how many buildings will exist, how many accelerator racks will run, or how much power the site is drawing today.
This guide explains, for executives, developers, utilities and engineers, what a gigawatt figure actually measures, how to convert it into IT capacity and racks without fooling yourself, and how to track a campus from announcement to proven operation. It uses US practice throughout: 60 Hz utility service at 230, 345, 500 or 765 kV; medium-voltage (MV) distribution at 34.5 kV or 13.8 kV; low-voltage (LV) power at 480Y/277 V and 415Y/240 V; and US codes, standards and reliability rules.
In plain terms: "1 GW" is the size of the front door, not the number of people in the building. It tells you how much electricity the site is allowed — or planned — to take at one boundary. It does not tell you how much of that power reaches computers, how much is spare for redundancy, how much is built, or how much is being used right now.
The first question: 1 GW of what?
Before any conversion, ask which boundary the number describes. Each of the following is commonly called "the capacity" of a campus.
| Boundary | What it measures | Typical unit | Who usually quotes it |
|---|---|---|---|
| Announced or planned campus | Long-term ambition across all phases | MW | Developers, press releases |
| Utility service agreement / contracted demand | Maximum demand the utility has agreed to serve, often phased | MW (sometimes MVA) | Utility, tariff contracts |
| Interconnection (point of interconnection, POI) capability | What the transmission system can deliver after studies and upgrades | MW or MVA | Transmission owner, ISO/RTO |
| Substation transformer nameplate | Sum of installed transformer ratings | MVA | Substation designer |
| Total facility design demand | Peak power of IT plus cooling, losses and auxiliaries on the design day | MW | Facility engineer |
| Critical IT load | Power deliverable to IT equipment at the UPS or rack-feed output | MW | Data center operator, colocation contracts |
| Installed / deployed IT | Racks actually installed and their rated or provisioned power | MW | Tenant, operator |
| Actual operating demand | Measured power drawn now or averaged over a period | MW, MWh | Utility meter |
Each step down the table usually yields a smaller number. A campus can truthfully be described as "1 GW" at the top of the table while delivering 600 MW of usable IT power, and drawing 250 MW today.
Checking the common illustrative scenario
A widely used back-of-envelope conversion starts with 1,000 MW of total facility demand, assumes a power usage effectiveness (PUE) of 1.30, and then divides the IT share by a rack power of 130 kW and multiplies by 72 GPUs per rack. Keentel checked each step.
| Step | Simple scenario | Keentel's check |
|---|---|---|
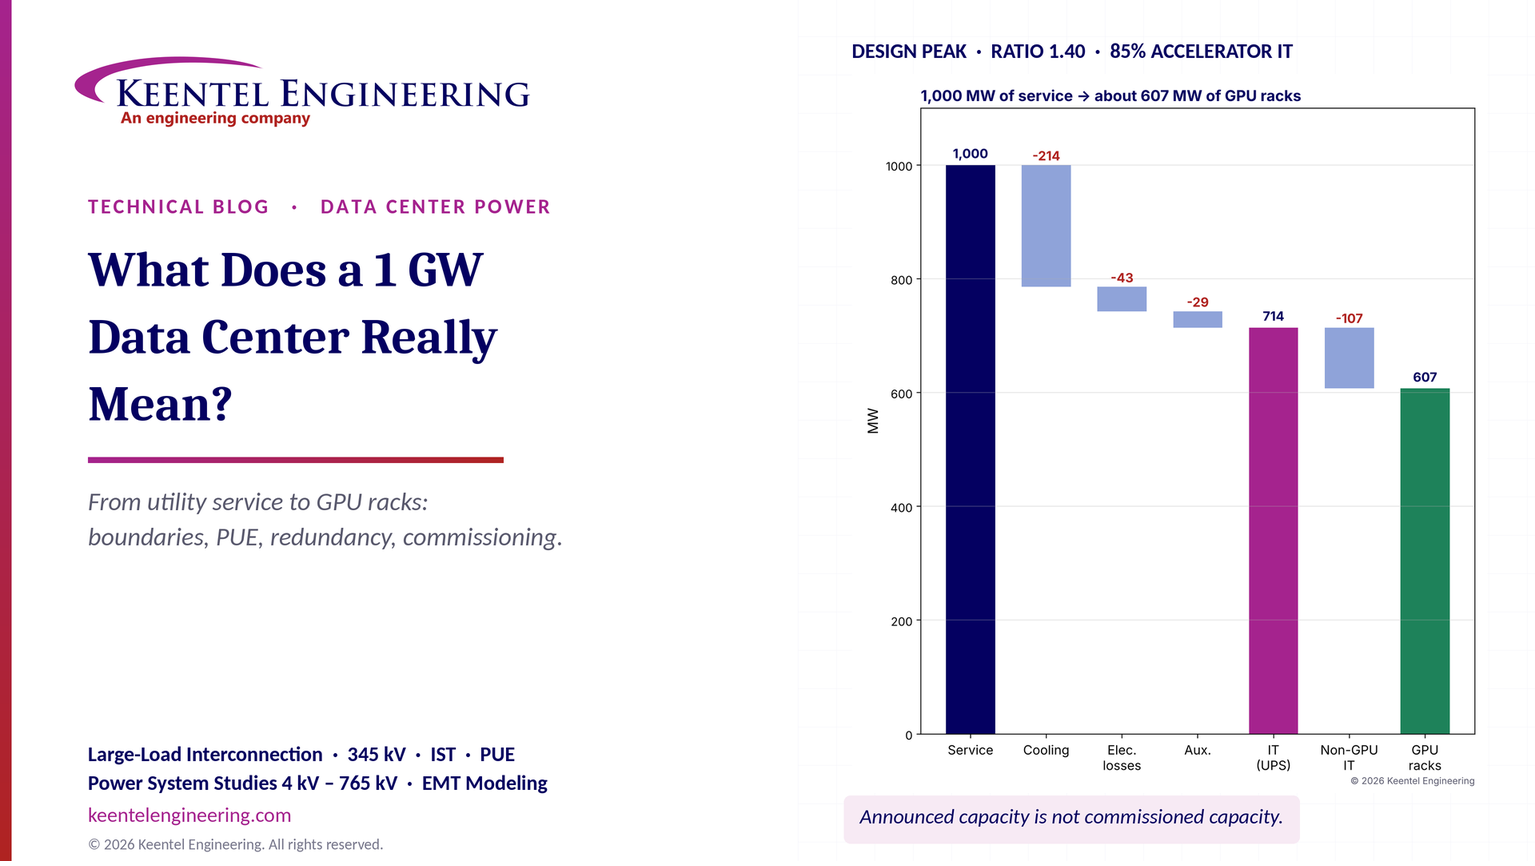
| IT share at PUE 1.30 | 1,000 / 1.30 = 769 MW IT and 231 MW support | Arithmetic is correct (769.2 MW and 230.8 MW). But PUE is defined as an annual energy ratio. On the hottest design day the instantaneous power ratio is higher. At a design-peak ratio of 1.40, IT falls to 714 MW. |
| Racks at 130 kW | 769 MW / 130 kW ≈ 5,900 racks | Arithmetic is correct (5,917). But not all IT power goes to accelerator racks. Storage, networking fabric, CPU and management nodes typically take 10–20% of IT power. |
| GPUs at 72 per rack | 5,917 × 72 ≈ 426,000 GPUs | Arithmetic is correct (426,036). With a 1.40 design ratio and 85% of IT in accelerator racks, the same 1 GW supports about 4,670 racks and roughly 336,000 GPUs — about 21% fewer. |
| Redundancy | Not included | If the UPS system is 2N, the installed UPS capacity is twice the usable IT load. A 1 GW figure quoted on installed equipment can overstate usable IT by up to half. |
| Operating demand | Not included | AI campuses ramp up over years; average demand is below peak, and training workloads can swing tens of percent within seconds. |

Figure 1. Left: Keentel's illustrative waterfall from 1,000 MW of facility service to GPU-rack IT at a design-peak ratio of 1.40, with 6% electrical losses, 30% cooling and mechanical, 4% auxiliaries and 15% of IT in non-accelerator equipment. Right: an illustrative phased campus showing how "planned," "contracted," "energized," "commissioned" and "operating" capacity differ year by year.
Key numbers for a 1,000 MW campus
| Quantity | Value | Basis |
|---|---|---|
| Apparent power at 0.95 power factor | 1,053 MVA | 1,000 MW / 0.95 |
| Current at 345 kV | about 1,760 A | 1,053 MVA / (√3 × 345 kV) |
| IT at annual PUE 1.30 | 769 MW | Simple scenario |
| IT at design-peak ratio 1.40 | 714 MW | Hot-day design |
| Accelerator-rack IT (85% of 714 MW) | 607 MW | Illustrative share |
| Racks at 130 kW | about 4,670 | 607 MW / 130 kW |
| GPUs at 72 per rack | about 336,000 | 4,670 × 72 |
| Installed UPS needed for 714 MW in 2N | 1,429 MW | Usable = installed / 2 |
| Annual energy at 80% load factor | about 7.0 TWh | 1,000 MW × 8,760 h × 0.8 |
| Equivalent US homes (≈10,500 kWh/yr each) | about 670,000 | Approximate |
| Annual energy cost at $70/MWh | about $490 million | Illustrative price |
Five lessons
- Name the boundary. Every capacity number should state where it is measured: utility service, POI, transformer nameplate, total facility, critical IT, installed IT or measured demand.
- PUE converts energy, not peak power. Use a design-peak ratio for electrical sizing, and annual PUE for energy and cost.
- Not all IT power is accelerator power. Storage, networking, CPU and management systems live inside the IT budget.
- Redundancy splits installed from usable. A 2N system installs twice what it can deliver. Ask for "usable at the stated redundancy."
- Announced is not commissioned. Report planned, contracted, installed, energized, commissioned, available and operating capacity separately, and prove performance under failure before counting it.
Common statements about gigawatt campuses, checked
| Statement often heard | Keentel's check |
|---|---|
| "A 1 GW data center has 1 GW of computers." | No. At typical design ratios, 15–35% of facility power goes to cooling, power conversion losses and auxiliaries, and part of the remaining IT power serves storage, networking and CPUs. |
| "PUE 1.3 means support systems use 30% of IT power at all times." | No. PUE is an annual energy ratio. On a hot afternoon the ratio is higher; on a cold night it is lower. |
| "1 GW = 1,000 MW." | True as a unit conversion. But MW is real power; utilities and transformers are also rated in MVA. At 0.95 power factor, 1,000 MW is 1,053 MVA. |
| "1 GW tells you how many GPUs the site has." | No. GPU count depends on rack power, the share of IT in accelerator racks, redundancy, phasing and deployment. The same campus could host roughly 90,000 to 550,000 GPUs depending on rack generation alone. |
| "The site is 1 GW, so it is drawing 1 GW." | Rarely. Phased energization, ramp-up, utilization and the difference between peak and average demand mean actual demand is usually well below the headline. |
| "Once energized, the capacity is available." | Not until it has been commissioned, including integrated systems testing of transfers, failures and recovery at the stated redundancy. |
| "Transmission is the only constraint." | Transmission is often the longest lead item, but large transformers, MV switchgear, generators, cooling plant and grid-compliance studies can each govern the schedule. |
Part B — The Engineering Guide to Gigawatt Data Center Capacity
1. Units first: MW, MVA, MWh and power factor
Most confusion about gigawatt campuses starts with units. Three quantities matter.
- Real power (MW) is the rate at which energy does useful work: running processors, pumps and fans. IT loads, cooling plants and PUE calculations are expressed in MW.
- Apparent power (MVA) is the product of voltage and current. Transformers, cables, switchgear and transmission lines heat up with current, so their capacity is stated in MVA (or amperes).
- Energy (MWh) is power multiplied by time. Utility bills, sustainability reports and PUE use energy.
Real and apparent power are related by the power factor (PF):

Worked example 1 — The current behind 1,000 MW
A campus with 1,000 MW of total demand at a power factor of 0.95 draws

At the 345 kV point of interconnection the line current is

The same power at 230 kV would need about 2,640 A, and at 500 kV about 1,220 A. This is why gigawatt campuses are almost always served at 345 kV, 500 kV or 765 kV, often by more than one line.
In plain terms: MW is how much work the electricity does; MVA is how much "pipe" the equipment needs. A transformer rated 300 MVA cannot deliver 300 MW unless the power factor is 1.0.
Modern data centers often run at a high power factor because UPS rectifiers and server power supplies have active front ends, but cooling motors, transformer magnetizing current and harmonic filters still matter. Utilities typically require a power factor band at the point of interconnection, and large-load interconnection agreements increasingly specify reactive power behavior during disturbances.
2. The capacity boundaries, from transmission line to GPU
2.1 Announced or planned campus capacity
This is the long-range vision: land, zoning, a master plan and perhaps a non-binding request to the utility. It may span five to ten years and several phases. It is useful for strategy and for the utility's load forecast, but it is not a commitment by anyone to serve the load.
2.2 Utility service and interconnection capacity
The electric service agreement(ESA) or large-load contract states how much demand the utility has agreed to serve and on what schedule. The interconnection studies — performed by the transmission owner and, in organized markets, reviewed by the ISO or RTO — determine what the transmission system can deliver and what network upgrades are required.
Key points for executives:
- Service is usually phased. A 1,000 MW agreement may allow 200 MW in year one, rising as transmission upgrades come into service.
- Service may be conditional or curtailable. Some agreements allow interim service subject to curtailment until upgrades are complete.
- The contract is usually written in MW of demand, sometimes with an MVA or power-factor condition.
2.3 Substation transformer nameplate and firm capacity
A campus substation typically steps 345 kV (or 230 or 500 kV) down to 34.5 kV for distribution to data halls. Transformer nameplate MVA is often quoted as "capacity," but what matters is firm capacity: what the substation can carry with its largest transformer out of service (N-1).

Worked example 2 — Transformer count at 345/34.5 kV
A campus needs 1,053 MVA at full build. Using 300 MVA (top forced-air rating) 345/34.5 kV transformers:

Five transformers totaling 1,500 MVA of nameplate give 1,200 MVA firm. A press release could say "1.5 GVA of transformation," "1.2 GVA firm," or "1 GW of service" — all describing the same substation. The nameplate figure is the least meaningful of the three. Large power transformer lead times of two to four years are now common, which is why transformer procurement often drives the phasing schedule.
2.4 Total facility design demand
This is the engineer's number: the peak power drawn on the design day by IT, cooling, electrical losses, lighting, offices and other auxiliaries. It is the number that must fit inside the utility service and the firm substation capacity.
2.5 Critical IT load
Critical IT load is the power available at the output of the UPS system (or at the rack power feeds) to supply IT equipment. Colocation contracts and wholesale leases are priced in critical IT MW. It excludes cooling and electrical losses upstream of the IT boundary.
2.6 Installed, deployed and operating IT
Installed IT is the rated or provisioned power of racks actually in place. Deployed may be lower if racks are installed but not yet powered. Operating demand is what the meter reads, which depends on utilization and workload.
| Boundary | Illustrative value for one 1,000 MW campus |
|---|---|
| Announced campus | 1,000 MW |
| Utility service contracted (year 3) | 800 MW |
| Firm substation capacity (built so far) | 900 MVA (four of five transformers) |
| Total facility design demand (energized phases) | 600 MW |
| Critical IT at design point (energized phases) | 429 MW |
| Installed IT racks | 380 MW |
| Average operating facility demand this year | 400 MW |
All seven numbers can be true at the same time.
3. Power usage effectiveness: what it is and what it is not
3.1 Definition
PUE was introduced by The Green Grid and is standardized internationally as ISO/IEC 30134-2. It is defined as the ratio of total data center energy to IT equipment energy, normally measured over a full year:

A PUE of 1.0 would mean every kilowatt-hour entering the facility reaches IT equipment. Hyperscale air-cooled facilities typically report annual PUEs of about 1.1 to 1.3. Liquid-cooled AI facilities can achieve similar or better annual values in mild climates, but design-day power ratios are higher, especially where chillers are needed on hot days.
US energy codes approach efficiency differently. ASHRAE Standard 90.4, Energy Standard for Data Centers , uses mechanical and electrical loss components rather than a single PUE target, and many jurisdictions adopt it by reference through their energy codes.
3.2 Why PUE cannot be used directly for peak power
Because PUE averages across a year, it understates the support load on the hottest afternoon, when chillers run harder, dry coolers lose capacity and fans speed up. Electrical design needs a design-peak power ratio:

The difference can be significant. A facility with an annual PUE of 1.25 might have a design-peak ratio of 1.35 to 1.45 in a hot climate.
Worked example 3 — PUE sensitivity at 1,000 MW of service
| Ratio (annual PUE or design-peak) | IT power (MW) | Support power (MW) |
|---|---|---|
| 1.15 | 869.6 | 130.4 |
| 1.20 | 833.3 | 166.7 |
| 1.25 | 800.0 | 200.0 |
| 1.30 | 769.2 | 230.8 |
| 1.40 | 714.3 | 285.7 |
| 1.50 | 666.7 | 333.3 |

Using an annual PUE of 1.30 instead of a design-peak ratio of 1.40 overstates IT capacity by 55 MW — enough for over 400 racks at 130 kW.
3.3 Partial PUE and design PUE
The Green Grid also defines partial PUE (pPUE) for a subsystem or zone, such as one data hall with its own cooling. Developers sometimes quote a "design PUE" calculated at a specific operating point. Both are legitimate, but neither should be confused with the annual PUE reported to investors or regulators. Always ask:
- Is this an annual energy ratio, a design-peak power ratio, or a partial value?
- At what IT load fraction was it calculated? PUE gets worse at low load because fixed losses are spread over less IT energy.
- Does "facility" include the substation transformers, on-site generation auxiliaries and office buildings?
4. Where the power goes inside the fence
4.1 A typical design-peak power budget
| Use | Share of IT power (illustrative, liquid-cooled, hot climate) | MW at 714 MW IT |
|---|---|---|
| IT equipment | 100% | 714 |
| Cooling and mechanical (chillers, dry coolers, pumps, CDUs, fans, air handlers for residual heat) | 30% | 214 |
| Electrical losses (transformers, UPS, PDUs, busway, cables) | 6% | 43 |
| Lighting, offices, security, controls, other auxiliaries | 4% | 29 |
| Total facility | 140% | 1,000 |
Liquid-cooled AI racks remove most of their heat through cold plates, so warm-water loops can often use dry coolers rather than chillers for much of the year. But the residual heat still removed by air, and the hottest-day chiller trim, can raise the design-day ratio.
4.2 Electrical losses through the chain
A typical AC power chain from 345 kV to the rack includes a 345/34.5 kV substation transformer, 34.5 kV collector switchgear, a 34.5 kV/480 V or 34.5 kV/415 V unit substation, the UPS, PDUs or busway, and rack power shelves. Each stage has losses:

| Stage | Efficiency (illustrative) |
|---|---|
| 345/34.5 kV substation transformer | 99.6% |
| 34.5 kV/LV unit substation transformer | 99.0% |
| UPS (double conversion, high load) | 96.5% |
| PDU, busway and cables | 99.0% |
| Product, substation to rack input | about 94.2% |
About 6% of IT power is lost before it reaches the rack, consistent with the budget in Section 4.1. Rack power shelves then convert to the bus voltage used by the servers, and their losses are counted inside the IT power. Architectures such as higher-voltage DC distribution or line-interactive UPS modes reduce these losses; Keentel's separate guides on 800 VDC data center power architecture cover those options.
4.3 Not all IT power is accelerator power
The 130 kW rack figure in the common scenario describes a 72-GPU rack-scale system, which already includes its CPUs, memory, internal networking switches and power conversion. But a working AI cluster also needs:
- Fabric networking: spine and super-spine switches, optical transceivers and network racks outside the GPU racks.
- Storage: high-throughput storage clusters for training data and checkpoints.
- CPU and management nodes: schedulers, login nodes, monitoring and security appliances.
- Inference or general-purpose compute that may share the campus.
These typically consume 10–20% of IT power. Keentel uses 15% as a planning value until the tenant's cluster design is known.
5. From IT megawatts to racks and GPUs
5.1 The conversion

where f_acc is the share of IT power in accelerator racks and g is the number of GPUs per rack.
Worked example 4 — The common scenario and a design-basis scenario
Simple scenario. P_IT = 769.2 MW, f_acc = 1.0, P_rack = 130 kW, g = 72:

Design-basis scenario. P_IT = 714.3 MW (ratio 1.40), f_acc = 0.85:

| Share of IT in accelerator racks | Accelerator IT (MW, at 714 MW) | Racks at 130 kW | GPUs at 72 per rack |
|---|---|---|---|
| 80% | 571 | 4,396 | 316,000 |
| 85% | 607 | 4,670 | 336,000 |
| 90% | 643 | 4,945 | 356,000 |
5.2 Rack power changes with every hardware generation
Rack power is not a constant. Air-cooled enterprise racks run 5–15 kW; first-generation AI racks 30–60 kW; current 72-GPU rack-scale liquid-cooled systems roughly 120–140 kW; and industry roadmaps describe racks of several hundred kilowatts and beyond. Roadmaps are not deployment guarantees, and the electrical and cooling design must state the rack power it supports.
| Rack power | Racks from 769 MW IT | GPUs at 72 per rack (illustrative) |
|---|---|---|
| 100 kW | 7,692 | 553,800 |
| 130 kW | 5,917 | 426,000 |
| 200 kW | 3,846 | 276,900 |
| 600 kW | 1,282 | 92,300 (if 72 GPUs per rack; future racks will hold more) |
The GPU count per rack is itself a design choice; higher-power racks usually hold more accelerators. The point is that "GPUs per gigawatt" is not a fixed conversion.
5.3 Rated, provisioned and actual rack power
A rack may be rated at its maximum power-supply capacity, provisioned at a lower power budget agreed with the operator, and operated at a still lower average. Electrical design must use the provisioned value with margin; the utility sees the operated value; investors often hear the rated value.
6. Redundancy: installed versus usable
6.1 Why redundancy changes the number
Data centers install more electrical and mechanical capacity than they use so that a component can fail, or be maintained, without dropping load. The relationship between installed and usable capacity depends on the topology:

| Topology | Description | Usable fraction k_red |
|---|---|---|
| 2N | Two complete, independent systems, each able to carry all load | 0.50 |
| Distributed redundant ("4N/3") | Four systems, any three carry all load | 0.75 |
| Block redundant N+1 (N = 6) | Six active blocks plus one reserve block with transfer | 0.857 |
| Block redundant N+1 (N = 4) | Four active blocks plus one reserve | 0.80 |
Worked example 5 — Installed UPS for 714 MW of critical IT

| Topology | Installed UPS capacity required |
|---|---|
| 2N | 1,429 MW |
| 4N/3 distributed redundant | 952 MW |
| N+1 block, N = 6 | 833 MW |
If a campus is described by the sum of its UPS ratings, a 2N design could be called "1.4 GW" while delivering 714 MW. Executives should always ask for usable IT capacity at the stated redundancy level.
6.2 Redundancy in the utility and generation layer
Redundancy also applies upstream:
- Utility: two or more independent transmission lines, ideally from different substations, with the campus substation designed for N-1 (one line or transformer out).
- Generation: on-site generators sized N+1 or N+2 for the critical load, or a different strategy (such as battery energy storage plus limited generation) agreed with the tenant.
- Cooling: chiller, pump and dry-cooler redundancy, plus thermal storage to ride through chiller restart.
Keentel's guide to data center tier classifications discusses how these choices map to availability targets.
7. Getting a gigawatt from the grid
7.1 Why large loads are now a reliability topic
Until recently, transmission planning treated even large industrial customers as ordinary load. Gigawatt-scale AI campuses change that for three reasons:
- Size. A 1,000 MW campus is comparable to a large nuclear unit. Its sudden loss or reconnection is a frequency event for the interconnection, and in smaller balancing areas a serious one.
- Speed of growth. Campuses request service on timelines of two to four years, faster than transmission can traditionally be planned and built.
- Power-electronic behavior. Data center loads sit behind UPS rectifiers and server power supplies. When grid voltage dips, protection settings may transfer the load to batteries or generators within milliseconds. Hundreds of megawatts can disappear from the grid during a fault and return seconds or minutes later.
A widely studied 2024 event in Northern Virginia, in which roughly 1,500 MW of data center load transferred off the grid during a transmission fault, prompted NERC to form a Large Loads Task Force and to develop guidance on large-load modeling, ride-through and commissioning. Several regions now have, or are developing, specific requirements for large loads. Readers should confirm the current status of NERC guidance, any related NERC Reliability Standard projects, and regional rules before relying on them.
7.2 What the interconnection process looks like
The details differ by region and utility, but a typical large-load interconnection includes:
1. Load request and pre-application: location, MW by year, power factor, load profile and expected ride-through behavior.
2. System impact studies: power flow(thermal and voltage), short-circuit, transient stability and, increasingly, electromagnetic transient (EMT) studies of the load's power electronics.
3. Facilities studies: new substation, transmission line, breaker and protection scope, cost and schedule.
4. Agreements: an electric service agreement or interconnection agreement covering demand ramp, curtailment rights, metering, telemetry, power factor and performance requirements.
5. Construction, commissioning and energization: utility witness tests, protection checks and staged load ramps.
Different organized markets and utilities have adopted specific large-load processes and thresholds — for example, ERCOT's large-load interconnection process for loads at or above 75 MW, and Texas legislation enacted in 2025 addressing large loads. Other ISOs and RTOs, including PJM, MISO and SPP, have proposed or adopted large-load procedures, and FERC has open proceedings on large-load interconnection and on co-location of loads with generation. These rules are changing quickly; confirm current status with the serving utility and ISO/RTO.
7.3 Planning-level checks every developer should run
| Check | Why it matters | Typical tool |
|---|---|---|
| Thermal capacity of the supply lines with one line out (N-1) | A 1 GW load on two 345 kV lines must survive the loss of either | Power flow |
| Voltage at the point of interconnection, normal and contingency | Large loads depress voltage; reactive support may be needed | Power flow, QV analysis |
| Short-circuit strength at the POI | Weak grids complicate power-electronic load behavior | Short-circuit study, short-circuit ratio |
| Load ride-through and reconnection behavior | Uncontrolled load drop and return cause frequency and voltage swings | Dynamic and EMT simulation |
| Harmonics and resonance | Rectifiers and drives inject harmonics; IEEE 519 applies at the POI | Harmonic study |
| Frequency impact of losing the whole campus | The interconnection or balancing area must withstand the largest credible load loss | Frequency response study |
Keentel's guides on frequency response stages and on resource adequacy and transmission planning explain how system planners view these events.
Worked example 6 — How many 34.5 kV feeders?
Inside the campus, power is distributed at 34.5 kV to unit substations near each data hall. A 1,200 A, 34.5 kV feeder breaker is rated

If feeders are arranged in pairs so that either can carry both loads after a failure, each is normally loaded to about half its rating, roughly 600 A or 35.9 MVA. Then

About 30 MV feeders (15 redundant pairs) are needed at full build — before allowing for future growth, spare positions or the specific redundancy architecture. Keentel's comparison of ring main units and metal-clad switchgear for data centers covers the MV distribution choices in more detail.
8. On-site generation and battery storage
8.1 Backup versus primary power
Most data centers install backup generation sized to carry critical IT and essential cooling during a utility outage. At gigawatt scale this becomes a power plant in its own right: hundreds of reciprocating engines or several combustion turbines, with air permits, fuel storage or pipeline supply, and maintenance obligations.
A growing number of campuses also consider primary or bridging generation — on-site gas turbines, fuel cells or reciprocating engines that run continuously or for several years until utility service is available. These change the capacity story:
- A campus may be "1 GW" of which 300 MW is on-site generation and 700 MW is utility service.
- Generation that runs in parallel with the grid becomes subject to interconnection, protection and potentially NERC registration requirements, depending on size and configuration.
- Emissions permits often limit run hours, which limits the "firm" value of on-site generation.
8.2 Battery energy storage
Battery energy storage systems (BESS) at gigawatt campuses serve several purposes:
- UPS ride-through and generator start bridging (seconds to minutes).
- Smoothing fast AI training load swings so the grid sees a steadier demand.
- Demand response or curtailment compliance under the utility agreement.
- Grid services, where permitted.
BESS adds installed capacity but not always usable IT capacity. A 200 MW, 2-hour BESS can carry 200 MW for two hours; it does not increase the steady-state power the utility can deliver.
Codes and standards for large BESS include NFPA 855, UL 9540 and UL 9540A, and NEC Article 706. Keentel's guides on BESS sizing and on 800 VDC architectures discuss storage integration further.
9. Peak versus average: how a campus actually uses power
9.1 Load factor
Load factor is the ratio of average demand to peak demand over a period:

AI training clusters often run at high average utilization, giving load factors of 0.7 to 0.9 once fully deployed. During ramp-up, and for inference or mixed workloads, load factors can be lower.
Worked example 7 — Annual energy and cost
At a peak of 1,000 MW and a load factor of 0.8:

At an all-in energy price of $50, $70 or $90 per MWh, the annual energy cost is about $350 million, $490 million or $630 million, before demand charges, transmission charges and taxes.
For scale, the US Energy Information Administration reports average residential electricity use of roughly 10,500 to 10,800 kWh per home per year. Seven terawatt-hours is therefore the annual use of roughly 650,000 to 670,000 average US homes. This comparison is approximate: homes and data centers have very different load shapes and peak timing.
9.2 Fast load swings
Large AI training jobs synchronize thousands of accelerators. When a job pauses for communication or checkpointing, power can drop by tens of percent across the whole cluster and recover within a second or two. At gigawatt scale these swings can be hundreds of megawatts, repeating many times per minute. Utilities and system operators are increasingly asking how such swings will be managed — for example by:
- workload-level power smoothing in software,
- rack- or facility-level energy storage that absorbs the swings,
- minimum-power floors set by the operator,
- ramp-rate limits written into the service agreement.
9.3 Disturbance ride-through
The load's response to grid voltage and frequency disturbances is now a design requirement, not an afterthought. Questions to settle with the utility include:
- What voltage dip and duration should the facility ride through without transferring to backup?
- How fast may the facility return to the grid after a transfer, and in what steps?
- How will UPS, generator and automatic transfer controls be set and tested to meet those limits?
- What models (power flow, dynamic and EMT) must be provided, and how will they be validated?
10. Phasing: how a gigawatt is actually built
10.1 A typical phased schedule
Few gigawatt campuses energize all at once. A typical sequence:
| Year | Utility service (MW) | Substation firm (MVA) | Energized facility (MW) | Commissioned (MW) | Average operating (MW) |
|---|---|---|---|---|---|
| 1 | 400 (interim, curtailable) | 300 | 200 | 150 | 60 |
| 2 | 600 | 600 | 400 | 350 | 220 |
| 3 | 1,000 | 900 | 600 | 550 | 400 |
| 4 | 1,000 | 1,200 | 800 | 750 | 580 |
| 5 | 1,000 | 1,200 | 1,000 | 950 | 760 |
| 6 | 1,000 | 1,200 | 1,000 | 1,000 | 880 |
The right-hand panel of Figure 1 plots the same illustrative campus. In year 3 the campus could be described as "1 GW" (contracted), "600 MW" (energized), "550 MW" (commissioned) or "400 MW" (operating).
10.2 What drives the schedule
- Transmission upgrades: new lines and substation work can take five years or more where right-of-way and permitting are involved.
- Large power transformers and high-voltage breakers: multi-year lead times.
- MV switchgear, unit substations, UPS and generators: one to two years.
- Cooling plant: chillers, dry coolers and pumps, and their power supply.
- Interconnection studies and agreements: the regulatory critical path.
- Tenant hardware delivery: racks that are not yet delivered cannot be counted as installed IT.
11. Commissioning: proving the capacity
11.1 The commissioning levels
Data center commissioning is commonly organized in five levels. The terminology is an industry convention rather than a single published standard; the overall process is consistent with ASHRAE Guideline 0, The Commissioning Process , and project-specific commissioning specifications.
| Level | Activity | What it proves |
|---|---|---|
| L1 | Factory witness testing of major equipment (transformers, switchgear, UPS, generators, chillers) | Equipment meets specification before shipment |
| L2 | Site receipt and installation inspection | Equipment arrived undamaged and is installed per drawings |
| L3 | Pre-functional checks and start-up | Wiring, insulation, rotation, settings and individual start-up are correct |
| L4 | Functional performance testing | Each system performs its functions, including alarms, transfers and controls |
| L5 | Integrated systems testing (IST) | The whole facility works together under realistic load, including failures and recovery |
11.2 What integrated systems testing should demonstrate
IST is where "energized" becomes "commissioned." For each data hall or phase it should demonstrate, under load banks at or near design IT load:
- Utility loss and generator start, transfer and load acceptance within the specified time.
- Return to utility and generator shutdown.
- Failure of a single UPS module, transformer, MV feeder or cooling unit, with load maintained at the stated redundancy.
- Maintenance modes: taking a path out of service while the other carries full load.
- Cooling performance at design load, including chiller restart and thermal ride-through.
- Controls, alarms, monitoring and power-quality recording working end to end.
11.3 Load bank testing at gigawatt scale
Testing at full load needs load banks — resistive, or resistive-reactive for generator testing — that can absorb hundreds of megawatts. Liquid-cooled AI halls add a complication: heat must also be injected into the liquid cooling loops to test the cooling plant. Water-cooled load banks or heater skids connected to the coolant distribution units are increasingly used. Phased IST, coordinated with the utility so that hundreds of megawatts of test load do not surprise the grid, is now standard practice.
11.4 Utility-side commissioning
The utility will also want to witness or review:
- Protection relay settings and trip tests on the interconnection substation.
- Metering and telemetry.
- Power-factor and harmonic performance.
- Ride-through settings of UPS and transfer systems, and the staged reconnection sequence.
- Model validation data, where large-load modeling requirements apply.
12. Reporting capacity honestly: a milestone framework
Keentel recommends that owners, investors and utilities report each milestone separately and with its boundary stated.
| Milestone | Definition | Evidence |
|---|---|---|
| Planned | Included in the master plan or announcement | Board approval, public announcement |
| Contracted | Covered by an executed electric service or interconnection agreement, with dates | Signed agreement and schedule |
| Installed | Equipment set in place and connected | Installation inspection records (L2) |
| Energized | Equipment energized from the utility or on-site source | Energization records, switching orders |
| Commissioned | Integrated systems testing complete at the stated redundancy | Signed IST report (L5) |
| Available | Released to the tenant or operations for IT load | Handover certificate |
| Operating | Measured demand | Utility meter data, monthly average and peak |
Every figure should also state:
- Boundary: facility, critical IT, or utility service.
- Basis: MW or MVA; design peak or annual average.
- Redundancy: usable capacity at 2N, N+1 or distributed redundant.
- Date: capacity is a moving target during build-out.
13. What 1 GW tells you, and what it does not
| What a 1 GW headline tells you | What it does not tell you |
|---|---|
| The order of magnitude of the electrical ambition | How much is energized or commissioned today |
| Roughly the transmission voltage and substation scale needed | Building count, floor area or data hall layout |
| A rough upper bound on IT capacity | The exact rack or GPU count |
| That the project will need large-load studies and agreements | Whether service is firm, interim or curtailable |
| An approximate annual energy scale (several TWh) | The actual load factor or operating demand |
| — | Whether the capacity was tested under failure conditions |
14. An executive checklist
Before accepting a gigawatt figure, ask:
1. Boundary: Is it utility service, POI capability, transformer nameplate, total facility, critical IT or measured demand?
2. Units: MW or MVA? At what power factor?
3. Contract: Is the utility service firm, phased, interim or curtailable? On what schedule?
4. Ratio: What design-peak ratio converts facility to IT power? What annual PUE is expected?
5. Redundancy: What is usable IT at the stated redundancy level?
6. IT mix: What share of IT power goes to accelerator racks, and at what provisioned rack power?
7. Phasing: How much is planned, contracted, installed, energized, commissioned, available and operating today?
8. Testing: Has integrated systems testing proven performance under transfers, equipment failures and recovery?
9. Grid behavior: How will the campus ride through disturbances and manage fast load swings?
10. Generation and storage: How much is on-site, how firm is it, and what permits limit it?
15. Standards and rules that shape a gigawatt campus
| Area | US standards and rules (current editions) | What they govern |
|---|---|---|
| Transmission interconnection | FERC-approved utility and ISO/RTO tariffs; utility facility interconnection requirements; NERC FAC-001 and FAC-002 | Study process, facility requirements and coordination for new load and generation connections |
| Transmission planning | NERC TPL-001; ISO/RTO planning criteria | Whether the grid can serve the load with contingencies |
| Load modeling data | NERC MOD-032 | Data the planners need to model the load |
| Frequency and load shedding | NERC BAL standards; PRC-006 (UFLS) | How the system responds to large load or generation loss |
| Electrical installation | NFPA 70 (NEC), including Articles 230, 240, 645, 700–708; NESC (ANSI C2) for utility-side facilities | Wiring, protection, emergency and standby systems |
| Arc flash and safety | NFPA 70E; IEEE 1584 | Worker safety during operation and testing |
| Power quality | IEEE 519; IEEE 1453 | Harmonics and flicker at the POI |
| Substation design | IEEE 80 (grounding), IEEE C57 transformer series, IEEE C37 switchgear series | Substation equipment and grounding |
| Energy storage | NFPA 855; UL 9540 and 9540A; NEC Article 706 | BESS siting, fire protection and installation |
| Standby generation | NFPA 110; NEC Article 700/701/702 | Emergency and standby power performance |
| Data center energy and design | ASHRAE 90.4; ASHRAE TC 9.9 thermal guidelines | Energy performance and IT environmental limits |
| Efficiency metrics | ISO/IEC 30134-2 (PUE); The Green Grid metrics | How PUE and related ratios are defined and reported |
| Commissioning | ASHRAE Guideline 0; project commissioning specifications | Commissioning process and documentation |
| Data center infrastructure | ANSI/TIA-942; ANSI/BICSI 002 | Design and reliability classes |
16. How Keentel engineers a gigawatt capacity stack
Keentel works from the point of interconnection inward, so every number has a boundary and a basis.
1. Interconnection capacity: Power flow, short-circuit, stability and EMT studies to establish deliverable MW and MVA at the POI, normal and with contingencies, including any interim or curtailable service.
2. Substation and MV design: Transformer count and rating for N-1 firm capacity; 34.5 kV bus and feeder arrangement; protection and arc-flash design.
3. Facility power budget: A design-peak ratio from the hot-day cooling design, stage losses and auxiliaries, kept separate from the annual PUE forecast.
4. Redundancy-adjusted IT: Usable critical IT at the chosen UPS, generator and cooling redundancy.
5. IT mix and rack density: Accelerator, network, storage and CPU shares from the tenant's cluster design, and provisioned rack power with margin for the next hardware generation.
6. Phasing and milestones: A schedule that tracks contracted, energized, commissioned and operating capacity separately.
7. Grid behavior and commissioning: Ride-through settings, reconnection sequence, load-swing mitigation and utility models; review of L4 and L5 test plans and IST witnessing, so commissioned capacity is proven under failure.
Part C — Three Anonymous Case Studies
These composite case studies are based on the kinds of issues Keentel Engineering sees on large-load projects. Names, locations and details have been changed or combined.
Case study 1 — A "1 GW" campus that was really 640 MW of usable IT
Situation. An investor group evaluating a Southwest campus marketed as "1 GW of AI capacity" asked Keentel to verify how much accelerator capacity the site could support at full build. The marketing materials divided 1,000 MW by an annual PUE of 1.25 to claim 800 MW of IT.
Analysis. Keentel reviewed the utility agreement, the substation design and the mechanical basis of design.
- The utility agreement was for 1,000 MW of demand at the 345 kV POI, phased over five years, with the first two years curtailable during summer peaks.
- The mechanical design used air-cooled chillers to trim warm-water loops. On the 0.4% design-day temperature, the design-peak ratio was 1.42, not 1.25. Facility-level IT capacity was therefore 704 MW, not 800 MW.
- The electrical design was 2N at the UPS level. The developer's "installed critical capacity" was the sum of both UPS systems, about 1.4 GW. Usable IT was 704 MW.
- The tenant's cluster design allocated 9% of IT power to fabric, storage and management.
Engineered solution. Keentel built a capacity stack from the POI inward: 1,000 MW of service, 704 MW of usable critical IT at 2N, and about 640 MW of accelerator-rack IT, or about 4,900 racks at 130 kW. Keentel also recommended adding thermal storage and a hybrid dry-cooler arrangement, which reduced the design-peak ratio to 1.36 and added about 31 MW of IT capacity.
Outcome. The investor priced the transaction on 640 MW of accelerator-rack IT, with an upside case after the cooling changes. The developer revised its marketing to state boundaries and redundancy.
Case study 2 — Energized but not commissioned
Situation. A Mid-Atlantic operator reported to its customer that 300 MW of a planned 900 MW campus was "live." The customer's first training cluster then experienced two unplanned outages in the first month.
Analysis. Keentel's review found that the 300 MW had been energized — the substation, MV switchgear and unit substations were in service — but integrated systems testing had been completed for only one 100 MW data hall. In the other two halls:
- generator load-acceptance tests had been done with load banks connected only to the LV switchgear, not through the UPS,
- a protection setting on one 34.5 kV feeder relay tripped on transformer inrush when a unit substation was re-energized after maintenance,
- UPS ride-through settings had not been coordinated with the utility's fault clearing times, so a 230 kV fault on a nearby line transferred an entire hall to battery and then to generator.
Engineered solution. Keentel developed a corrected IST plan covering utility loss, generator transfer, single-component failures and maintenance modes for each hall, using resistive load banks plus heater skids on the coolant distribution units. Keentel also revised the MV feeder relay settings to restrain on inrush and coordinated UPS input voltage tolerance with the utility's clearing times and ride-through expectations.
Outcome. Integrated testing found and corrected four further issues before the remaining halls were released. The operator changed its reporting to distinguish energized, commissioned and available capacity, and no further outages occurred in the following year.
Case study 3 — A large load the grid did not expect to lose
Situation. A Texas utility was studying a 600 MW AI campus connected at 345 kV. The developer's initial load model represented the campus as constant power that would stay connected during faults.
Analysis. Keentel prepared dynamic and EMT models of the campus's UPS and transfer logic. The models showed that for voltage dips below about 70% lasting longer than about 4 cycles, the UPS systems would transfer the entire campus to batteries, removing 600 MW from the grid within about 100 milliseconds. The load would then return in large steps when voltage recovered. In the utility's frequency studies, losing 600 MW of load at once caused an over-frequency excursion, and the uncoordinated return caused a second disturbance.
Engineered solution. Working with the UPS manufacturer and the utility, Keentel recommended:
- widening the UPS input voltage and duration window to ride through faults cleared within the utility's normal clearing time,
- a staged return to grid after transfer, in steps of no more than 50 MW at defined intervals,
- a facility-level BESS sized to absorb fast AI training load swings so the grid would see a smoother profile,
- updated power flow, dynamic and EMT models submitted with the interconnection studies.
Outcome. The utility accepted the revised behavior and models. The campus energized its first phase on schedule, and subsequent grid faults did not cause load loss.