A Coordinated Electric System Interconnection Review—the utility’s deep-dive on technical and cost impacts of your project.
Challenge: Frequent false tripping using conventional electromechanical relays
Solution: SEL-487E integration with multi-terminal differential protection and dynamic inrush restraint
Result: 90% reduction in false trips, saving over $250,000 in downtime
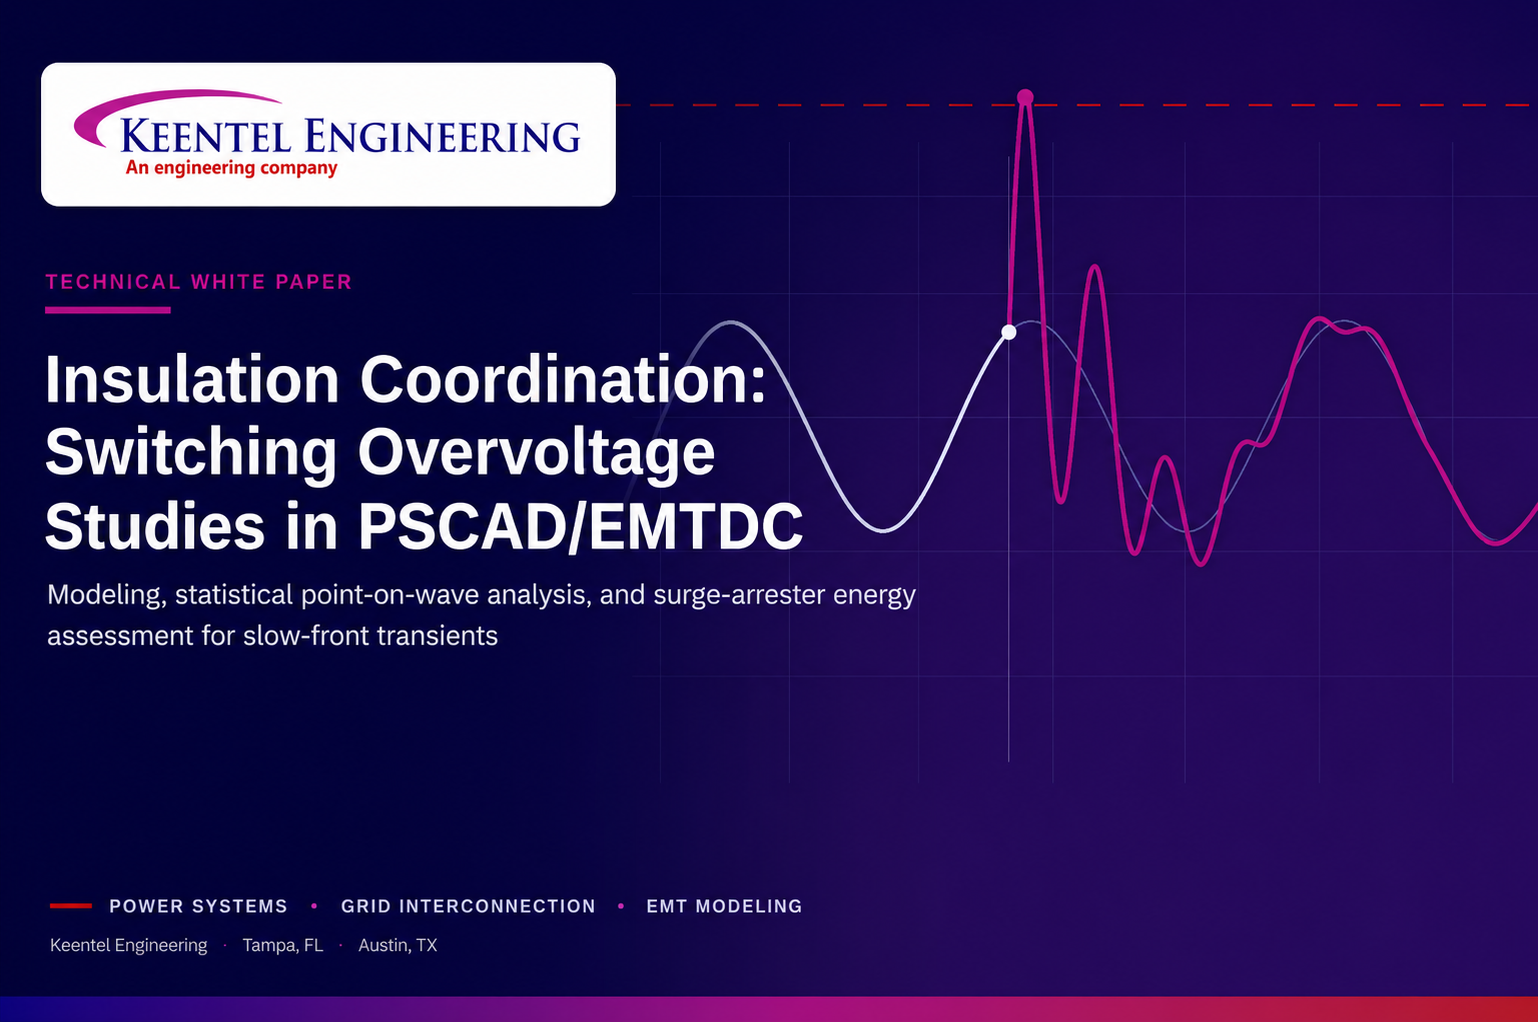
Insulation Coordination: Switching
Overvoltage Studies in
PSCAD/EMTDC
jun 23, 2026 | Blog
Modeling, Statistical Point-on-Wave Analysis, and Surge-Arrester Energy Assessment for Slow-Front Transients
An in-depth technical explainer, FAQ, and three field-style case studies
Why Switching Studies Matter
Every time a breaker or switch operates on a transmission system, it does more than connect or isolate a line. The switching action launches travelling waves down the line, and those waves excite the inductance and capacitance of the network into oscillation. The result is a high-frequency voltage transient a switching overvoltage that can momentarily push system voltage well above its nominal value. On long extra-high-voltage lines these transients are among the most demanding events the insulation will ever see.
A switching study answers four practical questions that sit at the heart of insulation coordination: what overvoltage levels the network actually produces during switching; what insulation withstand level the equipment therefore needs; whether the surge arresters can absorb the energy these events deposit; and whether any network resonance will amplify the problem. Get these wrong and you either under-insulate — risking flashover and equipment damage — or over-insulate and overspend. Insulation coordination is the discipline of getting that balance right, and the switching study is where the numbers come from.
WHERE SWITCHING OVERVOLTAGES SIT
Switching transients are slow-front transients international standards (IEC) place them in a frequency band reaching up to a few kilohertz, between the power-frequency temporary overvoltages below them and the fast-front (lightning) and very-fast transients above them. The study method here targets that slow-front band.
Building a Credible Model
A switching study is only as trustworthy as the model behind it. The guiding principle is that the area of interest must be represented faithfully enough to capture the real travelling-wave behaviour, with the rest of the network reduced to equivalents that do not distort it.
How Far Out to Model
As a working rule, model the system in full detail to at least two buses away from the point of study in every direction. Beyond that boundary, the rest of the network is collapsed into equivalent sources. Buses carrying generation can be represented as equivalent sources, and the boundary buses themselves are terminated with equivalent sources so the reduced network still presents the correct impedance and short-circuit behaviour to the study area.
Each network-boundary equivalent is defined by its bus voltage magnitude and angle, the real and reactive power at that bus, and its positive- and zero-sequence impedances — the same quantities you would draw from a load-flow and short-circuit case.
Choosing the Right Transmission-Line Model
PSCAD/EMTDC offers three line representations, and the choice is decisive for a switching study because switching overvoltages are a travelling-wave phenomenon.
| Line model | Valid frequency | Travelling wave? | Appropriate for |
|---|---|---|---|
| Pi-section | Fundamental only (50/60 Hz) | No — RLC only | Load-flow type studies |
| Bergeron | One specified frequency | Yes (single frequency) | Limited transient checks |
| Frequency-dependent | DC to MHz (all ranges) | Yes (broadband) | Switching & transient studies |
The pi-section model captures only the fundamental and represents the line as a lumped RLC circuit, so it cannot reproduce the travelling waves that create switching overvoltages. The Bergeron model does carry travelling waves but is accurate only at the single frequency it is tuned to. The frequency-dependent (phase) model is valid across the entire spectrum from DC into the megahertz range and reproduces the travelling-wave behaviour faithfully — which makes it the correct default for switching work.
Line Geometry and Transposition
A frequency-dependent model is only as good as the physical data behind it. Model the actual tower geometry: conductor positions and arrangement, bundle configuration, ground clearance, and line sag. Enter conductor data accurately — conductor type, radius, DC resistance, bundle details, sag — and include the ground (shield) wires. The tower geometry must match the specific line under study, not a generic template.
For a long transposed line, represent the transposition explicitly. Rather than modelling a 200 km line as a single uniform span, divide it into segments — for example four 50 km segments — and transpose them externally between segments so the phase rotation matches the real installation. An untransposed line of the same length can be modelled as a single segment of the correct length.
Transformers, Shunt Devices, Generators
- Transformers — use the general rating and impedance data, and include saturation data so the nonlinear core behaviour is represented. Both are typically available from manufacturer datasheets.
- Shunt devices — line reactors and shunt capacitors near the study line are modelled as equivalent inductance or capacitance, computed from the bus voltage level and the device MVAr rating. These matter enormously for switching, as shown later.
- Generators — define the bus voltage and angle, the real and reactive power at the machine, and the positive-sequence (subtransient, X″d) impedance; include the zero-sequence impedance if available, otherwise accept the default.
Surge Arresters: V-I Curve and Energy
The surge arrester is the protective heart of the study, so its model needs three things: the arrester rating, its nonlinear voltage-current (V-I) characteristic, and its energy-absorption capability. When the manufacturer datasheet does not provide a complete V-I curve, the lower portion of the characteristic must be tuned so that it corresponds to very small currents — the high-resistance leakage region — while the upper portion follows the published data. If full factory test results for the V-I curve are available, use them directly for the most accurate result.
Cables
Cables follow the same logic as overhead lines: use a frequency-dependent model built from the actual cable design data. Current PSCAD/EMTDC versions add cable representations that capture real installations more faithfully — for instance pipe-type cables and three-single-core arrangements in flat or trefoil formation — which is important because cable geometry strongly influences the travelling-wave response
Validate Before You Simulate
Before any switching scenario is run, the model must be validated — otherwise the overvoltages it predicts are meaningless. Validation is done at the steady-state and fault level the model should already know how to reproduce: check the load-flow solution and the fault (short-circuit) levels against an independent source. That source can be a separate load-flow program such as PSS/E, or actual field measurements. When the power-flow and fault levels fall within an acceptable tolerance of the reference, the model has earned the right to be used for transient work.
VALIDATION IN ONE LINE
If the model cannot reproduce the known load-flow and fault levels, it will not be trusted to predict the unknown switching overvoltages. Validate against an independent load-flow tool or field data first.
The Statistical Switching Study
Here is the crux of switching analysis: the overvoltage magnitude depends primarily on where, on the voltage waveform, the breaker poles actually make contact and the arc establishes. That instant — the point on wave — varies statistically from one operation to the next and differs pole to pole. A single deterministic run tells you almost nothing about the worst case.
Point-on-Wave: Deterministic and Statistical
Two complementary techniques capture this. In the deterministic sweep, the nominal breaker closing time is advanced by one one-hundredth of a power-frequency cycle on each successive run, stepping through the whole cycle (T₁, T₂, … over hundredths of a 60 Hz period) and recording the peak overvoltage at each instant. In the statistical approach, each scenario is run 100 times or more, with the pole closing times drawn randomly from a statistical breaker model that represents pole scatter and pre-strike. The breaker opening and closing times are chosen to maximise trapped charge, which drives the worst-case overvoltage. PSCAD/EMTDC's Multiple Run component automates this sweep; a second component can be added when more signals need to be recorded than one component allows.
The statistical pole parameters — the mean of the minimum and maximum time delays, the standard deviation, and the per-pole random scatter — are set in the configuration so the simulated breaker behaves like a real one. Because switching overvoltages are a kilohertz phenomenon, each run need only be one to two seconds of simulated time to capture them fully, and a simulation time step on the order of 10 microseconds is generally sufficient for slow-front work (shorter lines or cables may require a smaller step).
Trapped Charge and the Line-Reactor Effect
When a line with no reactor or shunt device is de-energised, charge remains trapped on the line. Reclosing soon after opening, onto that trapped charge, produces the highest overvoltage — so the worst case is a quick reclose. But when a shunt (line) reactor is in service, the picture changes: the reactor and the line capacitance form a resonant pair, and after opening, the trapped charge oscillates at a dominant natural frequency that is considerably slower than the system frequency. To find the worst case in that situation, the reclose must be timed against that slow natural oscillation, not the power-frequency cycle — closing at the instant the oscillating line voltage opposes the source gives the maximum overvoltage.
Scenario Matrix
A real study sweeps network states, not just switching instants. For a double-circuit line between two stations with line reactors, the scenarios multiply quickly: reactors in or out of service; one circuit in or out; energising from the first station or the second with the far end open; and neighbouring lines into each station in or out of service. Contingency conditions such as N-1 and N-2 are included to capture the network's worst case. Each combination is then subjected to the point-on-wave sweep.
Reading the Results
The study reports voltages at the switching end and the open (receiving) end of the line, the induced voltage on any out-of-service parallel circuit, and the energy absorbed by each surge arrester. Two patterns are typical: the open end sees the highest overvoltage (the travelling wave reflects and roughly doubles there), and the arrester at the open end therefore absorbs the most energy. An out-of-service parallel circuit usually shows only a small induced voltage on the order of a tenth of a per-unit and its arresters absorb almost nothing.
Results are presented statistically. For each monitored quantity the output file lists the minimum, maximum, mean, and standard deviation, along with the 2% and 98% statistical levels. Those levels are defined relative to the mean and standard deviation, and the 98% level is the value used for design margin against the equipment withstand:
| Statistical level | Definition | Used for |
|---|---|---|
| 2% level | mean − 2.054 × std. dev. | Lower statistical bound |
| 98% level | mean + 2.054 × std. dev. | Design value vs. equipment withstand |
The overvoltage at the open end is compared against the equipment's switching impulse withstand level (its insulation level), and each arrester's absorbed energy is compared against its capability conveniently normalised as kilojoules per kV of MCOV (maximum continuous operating voltage). If the predicted overvoltage sits comfortably below the withstand level and the arrester energy below its rated capability, the scenario passes with no insulation-coordination violation.
Why This Matters for Interconnection Engineering
At Keentel, we treat grid interconnection as a first-order design input, and switching studies are exactly where that philosophy earns its keep. New EHV lines, cable additions, reactive-compensation schemes, and generator or storage interconnections all change the network's travelling-wave and resonance behaviour. An interconnection that looks clean in load flow can still impose switching overvoltages that drive arrester ratings, breaker pre-insertion resistor decisions, or even the equipment basic insulation level at the point of interconnection.
Doing the insulation-coordination study early with a validated frequency-dependent model and a proper statistical point-on-wave sweep turns those risks into specified, defensible numbers before equipment is procured. That is the difference between discovering a resonance problem on paper and discovering it during commissioning.
Case Studies
The following three scenarios are anonymized and generalized to illustrate the method in practice. They contain no client, project, or location identifiers and are presented for educational purposes.
Case Study 1 EHV Double-Circuit Line Energization and Arrester Adequacy
Focus:
Statistical point-on-wave energization; surge-arrester energy duty
Subject:
A long (~200 km) EHV double-circuit overhead line with arresters at each line end
Challenge
A long extra-high-voltage double-circuit line had to be energised under conditions that would produce the highest credible switching overvoltage, and the team needed to confirm that the line-end surge arresters could withstand the resulting energy without exceeding their capability — and that the overvoltage stayed below the equipment's switching impulse withstand level.
Approach
The line was represented with a frequency-dependent model built from detailed tower geometry, conductor and bundle data, and sag, with the surrounding network modelled two buses out and boundary buses reduced to equivalent sources. Arresters were modelled with their full nonlinear V-I curve and energy capability. A Multiple Run point-on-wave study stepped the breaker closing instant across a full power-frequency cycle in hundredth-of-a-cycle increments and repeated the operation 100 times, with opening and closing timed to maximise trapped charge. Voltages at the switching and open ends and the per-arrester energy were recorded for every run.
Outcome
| Quantity | Open (receiving) end | Switching end |
|---|---|---|
| Worst-case overvoltage | ~2.2 per unit | Lower than open end |
| Arrester energy absorbed | ~490 kJ (highest) | Near zero on idle circuit |
| Normalized energy | ~1.4 kJ/kV-MCOV | — |
Against an arrester capability on the order of 13 kJ/kV-MCOV, the worst-case open-end duty of roughly 1.4 kJ/kV-MCOV left a wide margin, and the ~2.2 per-unit overvoltage sat well below the equipment switching impulse withstand level. The energization scheme was confirmed with no insulation-coordination violation, and the out-of-service parallel circuit showed only a small induced voltage with negligible arrester energy.
TAKEAWAY
A frequency-dependent model plus a statistical point-on-wave sweep converts “will the arresters cope?” into a defensible margin — here, worst-case energy roughly a tenth of the arrester's rated capability.
Case Study 2 Shunt-Reactor-Compensated Line: Resonance-Aware Reclose Timing
Focus:
Trapped-charge reclosing with a line reactor; natural-frequency timing
Subject:
A reactor-compensated double-circuit line switched from either terminal
Challenge
On a line equipped with shunt (line) reactors, a conventional quick-reclose assumption did not produce the true worst case. After opening, the reactor and line capacitance resonated, leaving the trapped charge oscillating at a dominant natural frequency well below system frequency. Reclosing on the power-frequency assumption alone risked under-predicting the overvoltage.
Approach
The reactors were modelled as equivalent inductances derived from their MVAr rating and bus voltage. The study first identified the dominant natural frequency of the reactor-line combination, then timed the reclose against that slow oscillation so the closing instant coincided with the line voltage opposing the source. A scenario matrix was swept — reactors in and out of service, each circuit in and out, and energization from either terminal with the far end open — and each combination was run through the statistical point-on-wave sweep.
Outcome
- Timing the reclose to the reactor-line natural frequency, rather than the power-frequency cycle, revealed the genuine worst-case overvoltage that a naive quick-reclose study would have missed.
- The scenario matrix isolated which network state (reactor status and circuit configuration) governed the design, so attention could be focused there.
- With the worst case correctly identified, arrester energy was confirmed within capability and the overvoltage within the equipment withstand level.
TAKEAWAY
When a line reactor is present, the worst-case reclose is set by the reactor-line natural frequency, not the system frequency. Find that frequency first, then time the switching against it.
Case Study 3 Validation-First Workflow for a Mixed Overhead/Cable Circuit
Focus:
Model validation against load-flow and field data before the SOV study
Subject:
A tie circuit combining overhead line and underground cable sections
Challenge
A tie circuit combining overhead-line and underground-cable sections needed a switching study, but the consequences of an inaccurate model — wrong arrester ratings or an unnecessarily high insulation level — were costly. The team needed confidence that the EMT model genuinely represented the as-built network before trusting its overvoltage predictions.
Approach
Both the overhead and cable sections were built with frequency-dependent models — the cable from its actual design data using the appropriate single-core (flat or trefoil) representation — with the network modelled two buses out and transformers including saturation. Before any switching scenario, the model's load-flow solution and fault levels were compared against an independent load-flow program and against available field measurements. Only after the steady-state and fault behaviour matched within tolerance was the statistical point-on-wave study run.
Outcome
- Power-flow and fault levels agreed with both the independent load-flow tool and field measurements within an acceptable range, establishing the model's credibility.
- The validated model produced switching-overvoltage and arrester-energy results that could be defended to reviewers and used directly for equipment specification.
- Treating the cable sections with proper frequency-dependent models avoided the travelling-wave errors a lumped representation would have introduced at the overhead-to-cable transitions.
TAKEAWAY
Validation is not a formality. Matching known load-flow and fault levels against an independent tool and field data is what lets the unknown switching overvoltages be trusted for design.
About Keentel Engineering
Keentel Engineering is a power systems and grid interconnection consulting firm with offices in Tampa, Florida and Austin, Texas. Our work spans EMT modeling, point-of-interconnection (POI) interconnection engineering, substation and transmission-line design, utility-scale renewables and battery energy storage (BESS) engineering, power system studies, and NERC operations and planning compliance. We approach every engagement interconnection-first — treating grid interconnection as a first-order design input rather than a downstream utility formality.
Author: Sandip R. Patel, P.E. —
Founder & Principal Engineer, IEEE Senior Member. Contact Keentel Engineering to discuss accelerating your EMT, interconnection, or parametric study workload.
DISCLAIMER & TRADEMARKS
This document is an independent educational and technical commentary produced by Keentel Engineering. PSCAD® and EMTDC™ are trademarks of their respective owner; InfiniBand® is a trademark of its respective owner. Keentel Engineering is not affiliated with, endorsed by, or sponsored by any such trademark holder.
Any case studies are anonymized, generalized, and presented for educational purposes; they do not identify any specific client, project, or location. Performance figures are illustrative of the methods described and will vary with hardware, network model, and configuration. © Keentel Engineering. All rights reserved.
Sources & References
This explainer synthesizes widely accepted practice in insulation coordination and electromagnetic transient simulation. Readers seeking primary technical detail may consult:
- IEC 60071 series — Insulation co-ordination (definitions, principles, and application guidance), including the classification of slow-front (switching) overvoltages.
- IEEE standards and application guides on insulation coordination, surge arresters (metal-oxide arrester application), and transmission-line switching.
- Published literature on frequency-dependent transmission-line and cable modeling and travelling-wave representation for transient studies.
- Manufacturer datasheets and factory test data for surge-arrester V-I characteristics and energy-absorption capability, and for transformer saturation data.
- Vendor documentation for the PSCAD/EMTDC simulation environment regarding line/cable models, the statistical breaker model, and the Multiple Run component.
Frequently Asked Questions
Q. What kind of overvoltage does a switching study actually address?
A. Slow-front transients — the overvoltages produced when breakers or switches operate and launch travelling waves that set the network's inductance and capacitance oscillating. These reach into the kilohertz range and sit between power-frequency temporary overvoltages and fast-front lightning transients. They primarily drive the switching impulse withstand level of equipment and the energy duty on surge arresters.
Q. How much of the network do I need to model in detail?
A. Model in full detail to at least two buses away from the point of study in every direction. Beyond that, represent the rest of the network with equivalent sources defined by bus voltage and angle, real and reactive power, and positive- and zero-sequence impedances. Generation buses and boundary buses are both terminated as equivalent sources.
Q. Which transmission-line model should I use, and why not pi-section?
A. Use the frequency-dependent model. Switching overvoltages are a travelling-wave phenomenon, and the pi-section model represents the line only as a lumped RLC circuit valid at fundamental frequency — it cannot reproduce travelling waves, so it is suitable for load-flow studies only. The Bergeron model carries travelling waves but is accurate at just one frequency; the frequency-dependent model is valid from DC to MHz and is the correct default for switching work.
Q. Why run each scenario 100 times?
A. Because the overvoltage magnitude depends mainly on the point on the voltage wave at which the breaker poles make contact, and that instant varies statistically from operation to operation and pole to pole. Running 100 or more times with randomly drawn pole closing times — or sweeping the closing instant in hundredth-of-a-cycle steps — characterises the distribution and exposes the worst case rather than one arbitrary outcome.
Q. How does a line reactor change the worst-case timing?
A. Without a reactor, charge stays trapped on an open line and the worst case is a quick reclose onto that trapped charge. With a shunt reactor in service, the reactor and line capacitance resonate, so after opening the line voltage oscillates at a dominant natural frequency well below system frequency. The reclose must then be timed against that slow oscillation — closing when the oscillating line voltage opposes the source — to capture the true worst case.
Q. What simulation time step and run length are appropriate?
A. For slow-front switching work, a time step around 10 microseconds is generally sufficient, since the phenomena of interest span roughly 20 to 5,000 microseconds. Because these are kilohertz events, one to two seconds of simulated time per run captures them. Very short lines or cables may require a smaller time step to resolve their faster travel times.
Q. How do I model the surge arrester if the datasheet is incomplete?
A. You need the arrester rating, its nonlinear V-I characteristic, and its energy-absorption capability. If the datasheet does not give a full V-I curve, tune the lower portion so it corresponds to very small (leakage-region) currents while the upper portion follows the published points. If complete factory test data for the V-I curve is available, use it directly for the most accurate result.
Q. How do I know whether the surge arrester energy is acceptable?
A. Normalise the absorbed energy as kilojoules per kV of MCOV and compare it with the manufacturer's rated capability. For example, an arrester absorbing on the order of a few hundred kilojoules at an MCOV in the mid-hundreds of kV may work out to roughly 1.4 kJ/kV-MCOV against a rated capability of around 13 kJ/kV-MCOV — comfortably within limits. The specific numbers depend entirely on the arrester and the event.
Q. How should I validate the model before running the study?
A. Validate at steady state and fault level before any switching run. Compare the model's load-flow solution and short-circuit levels against an independent reference — a separate load-flow program such as PSS/E, or actual field measurements. Only once these agree within an acceptable tolerance should the model be used to predict switching overvoltages.
Q. Where are the statistical results stored after a multiple run?
A. The run creates an output folder (its name depends on the compiler in use) containing the multiple-run output files. Those files list every recorded run and, at the end, the minimum, maximum, mean, standard deviation, and the 2% and 98% statistical levels for each monitored variable — the 2% level being the mean minus 2.054 standard deviations and the 98% level the mean plus 2.054 standard deviations.
Q. Do I need a high-frequency surge-arrester model?
A. Not for switching studies. The high-frequency arrester model becomes relevant for faster transients — very-fast transients or lightning (fast-front) studies. For slow-front switching work, the standard nonlinear V-I and energy model is appropriate.

About the Author:
Sonny Patel P.E. EC
IEEE Senior Member
In 1995, Sandip (Sonny) R. Patel earned his Electrical Engineering degree from the University of Illinois, specializing in Electrical Engineering . But degrees don’t build legacies—action does. For three decades, he’s been shaping the future of engineering, not just as a licensed Professional Engineer across multiple states (Florida, California, New York, West Virginia, and Minnesota), but as a doer. A builder. A leader. Not just an engineer. A Licensed Electrical Contractor in Florida with an Unlimited EC license. Not just an executive. The founder and CEO of KEENTEL LLC—where expertise meets execution. Three decades. Multiple states. Endless impact.
Services

Let's Discuss Your Project
Let's book a call to discuss your electrical engineering project that we can help you with.
About the Author:
Sonny Patel P.E. EC
IEEE Senior Member
In 1995, Sandip (Sonny) R. Patel earned his Electrical Engineering degree from the University of Illinois, specializing in Electrical Engineering . But degrees don’t build legacies—action does. For three decades, he’s been shaping the future of engineering, not just as a licensed Professional Engineer across multiple states (Florida, California, New York, West Virginia, and Minnesota), but as a doer. A builder. A leader. Not just an engineer. A Licensed Electrical Contractor in Florida with an Unlimited EC license. Not just an executive. The founder and CEO of KEENTEL LLC—where expertise meets execution. Three decades. Multiple states. Endless impact.
Leave a Comment
We will get back to you as soon as possible.
Please try again later.
Related Posts