A Coordinated Electric System Interconnection Review—the utility’s deep-dive on technical and cost impacts of your project.
Challenge: Frequent false tripping using conventional electromechanical relays
Solution: SEL-487E integration with multi-terminal differential protection and dynamic inrush restraint
Result: 90% reduction in false trips, saving over $250,000 in downtime
The three operating regions you have to design to
| Device | Output vs voltage | Response | Best suited to | Main limitations |
|---|---|---|---|---|
| Mechanically switched capacitor or reactor | Proportional to voltage squared | Seconds; discrete steps; limited switching operations per day | Steady-state reactive supply, voltage profile, loss reduction | No dynamic capability; step voltage change on switching; capability collapses when most needed |
| Static var compensator | Capacitive branches proportional to voltage squared | A few cycles; continuously controllable | Continuous control where cost matters and deep voltage support is not the driver | Square-law capability loss; harmonic filters are part of the plant and interact with the network |
| STATCOM | Approximately proportional to voltage — constant current capability | One to two cycles closed loop; converter response faster still | Voltage stability margin, weak interconnections, fast disturbance recovery, flicker and unbalance compensation | Higher capital cost; converter losses; adds a converter and its control dynamics to the network |
| Synchronous condenser | Governed by machine capability and excitation | Excitation response in the hundreds of milliseconds; inherent inertial response instantaneous | System strength and inertia, short-circuit contribution, black start support | Rotating plant with maintenance and losses; slower controlled response than a converter |
| STATCOM with energy storage | Reactive as a STATCOM, plus real power within the storage rating | As STATCOM for reactive; real power limited by storage | Where a real power deficiency is part of the problem | Cost and complexity of the storage; different failure and maintenance profile |
| Stage | Keentel scope | Outcome |
|---|---|---|
| Screening | Series-compensation proximity, radial contingency review, UIF and short-circuit ratio screening, frequency scans | Early identification of which SSO types apply |
| Detailed studies | PSCAD/EMTDC EMT studies with vendor real-code models, impedance-based and frequency-scan analysis | Clear evidence of stability margins or risk |
| Model quality | EMT model review, benchmarking against positive-sequence models, model acceptance support | Models that system operators accept |
| Mitigation | Control retuning recommendations with vendors, SSDC and bypass logic requirements, protection and monitoring specifications | Practical, coordinated solutions |
| Interconnection support | SSR and SSO study reports for ISO and utility requirements, response to reviewer comments | Fewer delays in the interconnection process |
Resilience: designing CDUs to the facility Tier objective
Liquid cooling makes heat removal more critical, not less. Cold plates hold only seconds of thermal buffer. If TCS flow stops, processors throttle or shut down very quickly. Resilience design must therefore cover:
- Pump redundancy: N+1 pumps at minimum, with automatic changeover.
- CDU redundancy: N+1 CDUs on a common TCS header, or 2N CDUs serving A and B manifolds for fault-tolerant designs.
- Power to CDUs: dual-corded CDUs fed from A and B sources, with pumps and controls on UPS power so coolant keeps flowing through a utility failure and generator start. This is the liquid-cooling equivalent of continuous cooling.
- Facility water continuity: chilled water or condenser water must also continue, through thermal storage, UPS-backed pumps or a high enough FWS temperature that the TCS can coast on stored thermal mass for the transfer period.
- Concurrent maintainability: isolation valves so any CDU, pump, filter or manifold section can be serviced without stopping the others.
- Leak management: leak detection, drip trays, automatic isolation valves and procedures for fluid spills.
Electrical engineering considerations
CDUs and liquid-cooling plants are electrical loads with their own design requirements:
- Pump motors and VFDs. Large CDUs use variable-frequency drives on their pump motors. These introduce harmonic current that must be included in the facility's harmonic study and IEEE 519 evaluation.
- Critical mechanical load on UPS. Putting CDU pumps on UPS increases UPS and battery sizing. The mechanical UPS load must be included in redundancy and ride-through calculations.
- Feeder and protection design. Dual feeds, automatic transfer, selective coordination and arc-flash labelling apply to CDU power distribution just as they do to IT power.
- Generator transient response. CDU pumps restarting together after a transfer create motor inrush on the generators. Staged restarts and soft acceleration reduce the step load.
- Load dynamics. AI training loads can swing rapidly between high and low power. Cooling controls must track those swings without temperature overshoot, and electrical systems must handle both the IT and the cooling load changes.
Commissioning a liquid-cooled data hall
- Flush and clean the TCS piping and manifolds to the specified cleanliness, using high-purity flush water.
- Fill and vent with the specified coolant, verifying glycol concentration and chemistry.
- Pressure test for leaks at design and test pressures, including quick-disconnect fittings.
- Verify sensors and controls: flow meters, temperature sensors, pressure transmitters, leak detection and BMS points.
- Load test with heat load banks connected through the cold-plate interfaces or rack manifolds, across the operating range.
- Prove the heat balance on both loops at several load steps, and the approach temperature against the design.
- Test failure scenarios: pump failure, CDU failure, power transfer to generator, valve failure and loss of facility water, confirming temperatures stay within the IT vendor's limits.
How Keentel Engineering helps
Keentel Engineering supports data center owners, developers and EPCs with the electrical engineering that liquid-cooled facilities depend on, and coordinates with the mechanical engineer of record and cooling vendors on the integrated design.
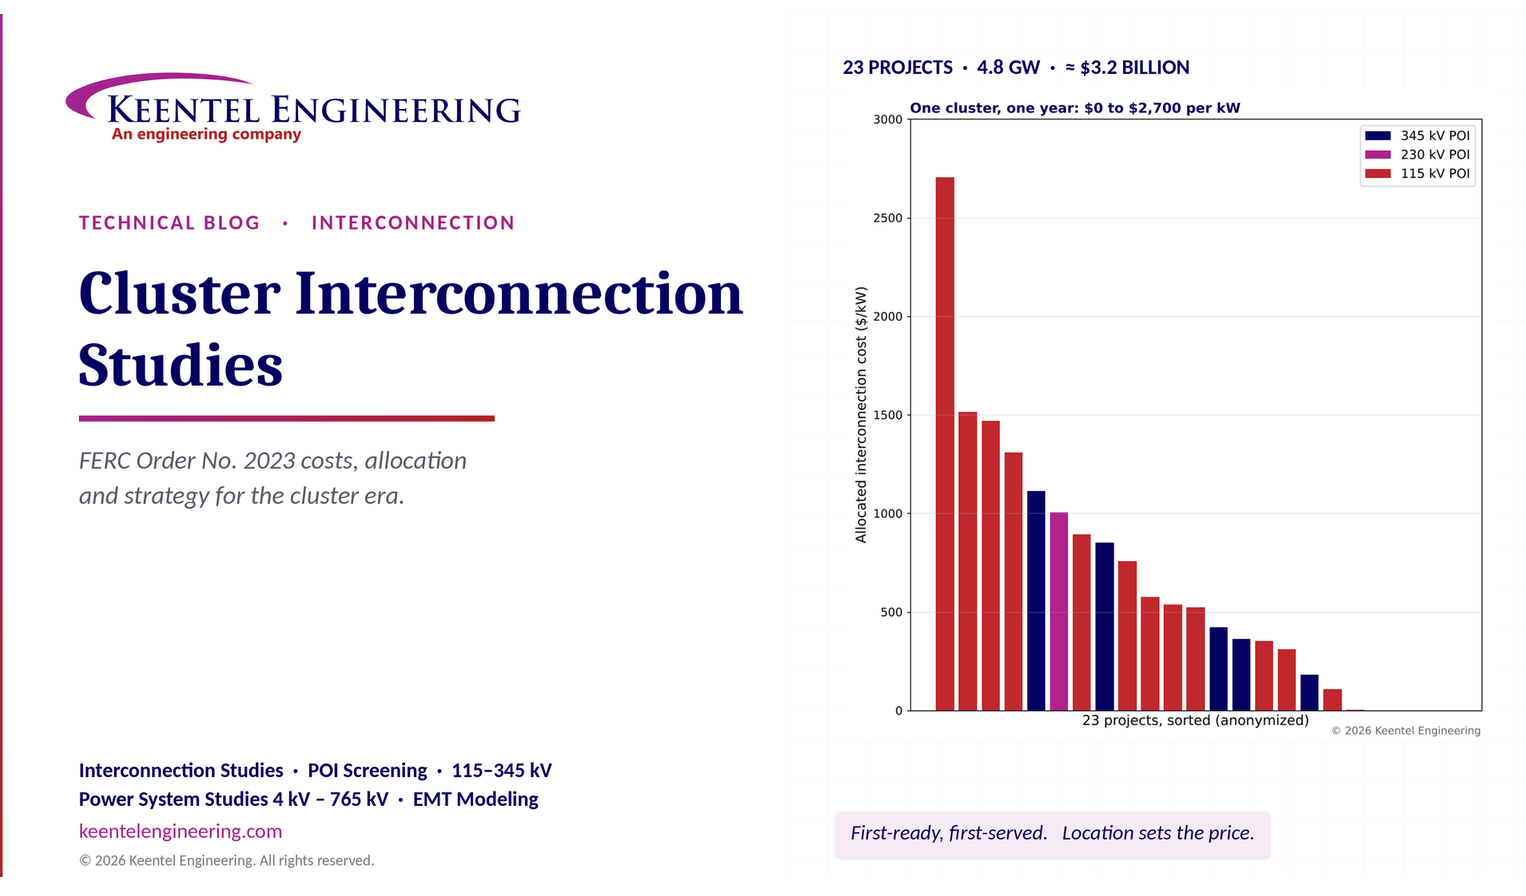
Cluster Interconnection Studies Under FERC Order No. 2023
October 23, 2026 | Blog
Part A — Cluster Interconnection Studies at a Glance
For two decades, most US generator interconnection queues ran on a first-come, first-served serial basis: each request was studied in order of its queue position, and each study assumed that every request ahead of it would be built. That model broke under the weight of solar, wind and battery storage requests. Queues swelled to more than two terawatts nationally, studies ran years late, and speculative requests withdrew after triggering restudies for everyone behind them.
FERC Order No. 2023, issued in July 2023 and clarified in Order No. 2023-A, replaced serial studies with a first-ready, first-served cluster process. Requests that meet financial and site-control readiness tests are grouped into a cluster and studied together. Network upgrades are identified for the cluster as a whole and allocated among its members. Withdrawals carry real financial penalties. Transmission providers face penalties for late studies.
To move from the old queue to the new process, each transmission provider ran transition procedures: a transitional serial study for the most advanced requests and a transitional cluster study for eligible requests that were not yet far enough along. New England's first transitional cluster, completed in 2026, offers one of the clearest public views of what a cluster study produces — and what it costs.
The transitional cluster in numbers
| Item | Value |
|---|---|
| Requests initially qualified for the transitional cluster | 26 (21 battery storage, 2 solar, 3 wind) |
| Requests that executed study agreements and were studied | 23 (18 battery storage, 2 solar, 3 wind) |
| Summer capacity studied for capacity deliverability | 4,826.5 MW |
| Summer capacity studied for energy (network) service | 3,832.6 MW (18 requests studied for both services) |
| Requests studied for capacity deliverability only | 5 (already holding interconnection agreements) |
| Points of interconnection | 34.5 kV to 345 kV; 14 at 115 kV, 1 at 230 kV, 7 at 345 kV |
| Total planning-grade interconnection cost | = $3.21 billion |
| System network upgrades | = $2.54 billion (79%) |
| Substation network upgrades | = $0.58 billion (18%) |
| Range of cost per project | $0 to about $541 million |
| Range of cost per kW | $0 to about $2,700/kW |
| Longest estimated construction time | 93 months from notice to proceed |
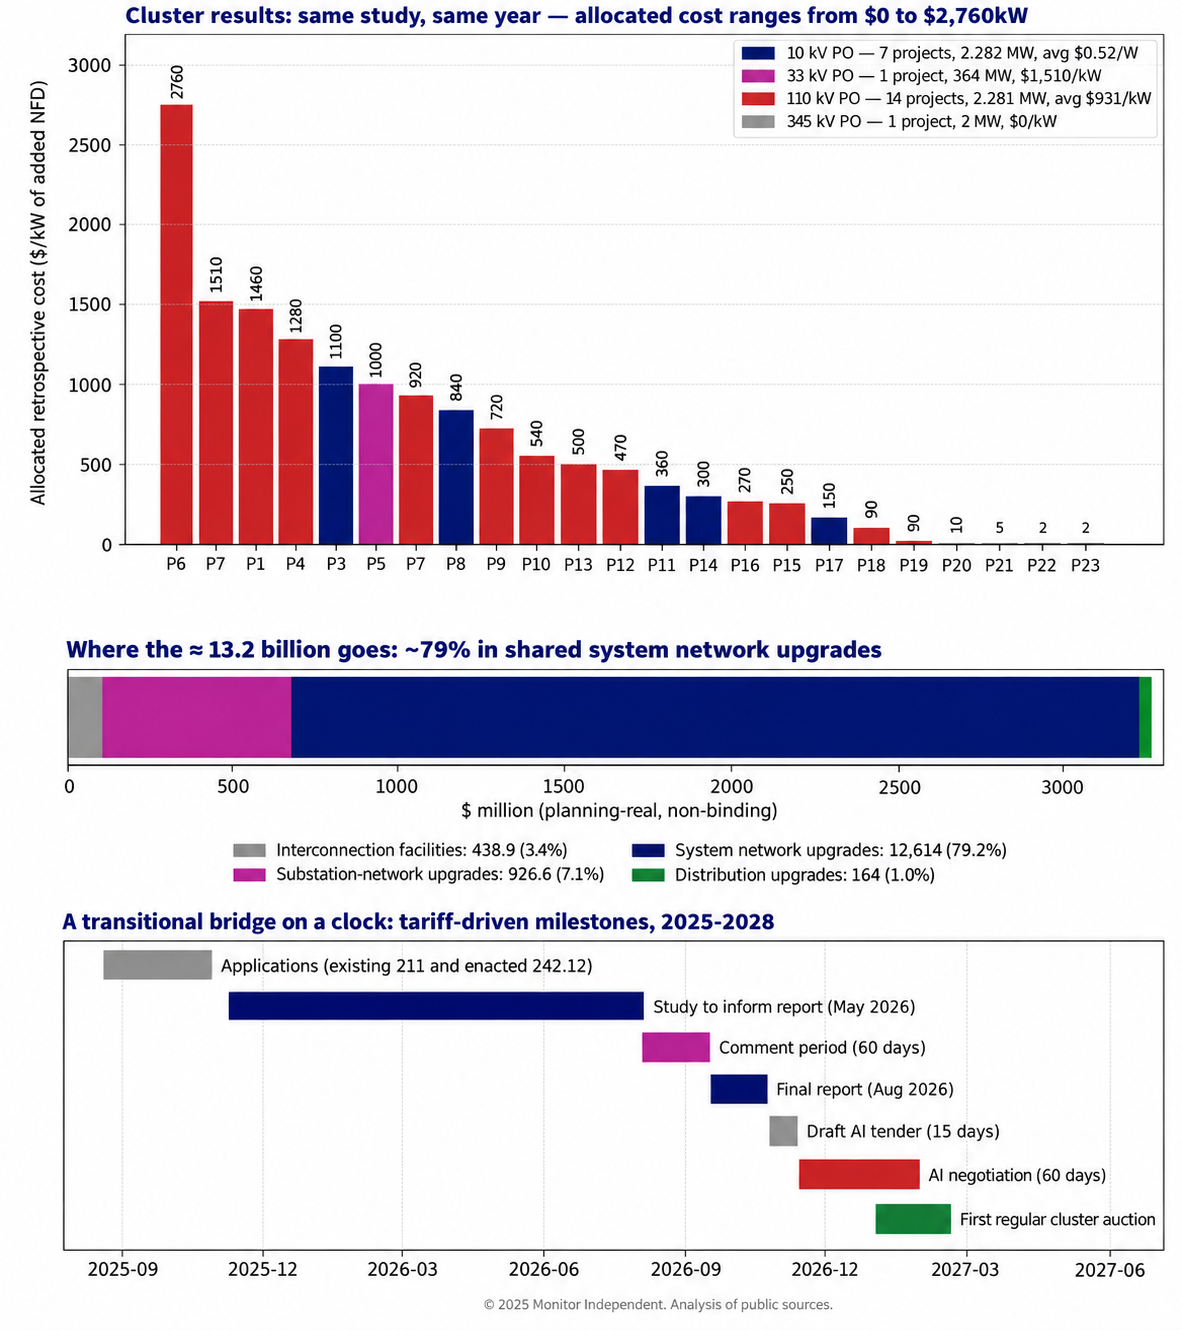
Figure 1. Keentel Engineering's analysis of the public planning-grade results. Top: allocated cost per kW for each project (anonymized), colored by point-of-interconnection voltage. Middle: composition of total cost. Bottom: tariff-driven milestones.
What Keentel's analysis shows
- Location dominates cost. The same study, using the same models and assumptions, produced allocated costs from zero to about $2,700 per kW. Four projects carried no network upgrade cost at all; one carried $541 million.
- Voltage class matters. Projects at 345 kV averaged about $453/kW. Projects at 115 kV averaged about $831/kW, nearly twice as much, because the 115 kV network saturates sooner and its upgrades are shared among fewer megawatts.
- Cluster effects are real. Four of the seven most expensive projects sat in one area on shared 115 kV corridors, where cumulative injections drove line rebuilds and new reactive devices that no single project would have triggered alone.
- Shared system upgrades carry the bill. Nearly 80% of the cost is system network upgrades — reconductoring, line rebuilds, STATCOMs and breaker work deep in the network — not the project's own substation connection.
- Schedules are long. Many upgrades are estimated at 60 to 93 months from notice to proceed. A battery project that could be built in 18 months may wait more than seven years for its network upgrades.
Engineering review of commonly circulated summaries
Several public summaries of the transitional cluster circulated widely. Keentel checked them against the primary documents.
| Commonly stated | Keentel's check |
|---|---|
| "23 to 26 qualified projects" | Both numbers are correct at different stages: 26 requests qualified, 23 executed agreements and were studied. |
| "Roughly 4.8 GW" | Correct for capacity deliverability: 4,826.5 MW summer. Energy (network) service was studied for 3,832.6 MW; five projects were studied for capacity only. Early press reports of about 8 GW included projects that did not proceed. |
| "Agreements signed and study start October 10/11, 2025" | Study agreements were issued on August 11, 2025, and had to be executed by October 10, 2025. The tariff clock (300 days to the interim report, 360 days to the final report) runs from August 11, 2025. |
| "Interim report June 7, 2026; final report August 6, 2026" | Correct: day 300 and day 360 from August 11, 2025. |
| "Interconnection agreement negotiations began August 21, 2026 (60 day window)" | Draft agreements were tendered on August 21, 2026 (within 15 days of the final report); the 60 day negotiation ran from August 22 to October 20, 2026. |
| "First post transition cluster window opens October 5, 2026" | Correct; the window closes November 19, 2026, followed by a 60 day customer engagement window and study work in early 2027. |
| "Total costs about $3.2 billion, about $2.5 billion system network upgrades" | Correct. Keentel's sum of the project table is $3.206 billion, of which $2.541 billion is system network upgrades. |
| "Costs split 50% per capita and 50% per MW" | This applies to study and restudy costs, not network upgrade costs. Under the Order No. 2023 pro forma procedures, system network upgrade costs are allocated by a proportional impact method and substation network upgrade costs per capita. |
| "Withdrawals carry nine times cumulative study costs" | Correct for the transitional cluster: the Order No. 2023 transitional withdrawal penalty is nine times study costs. Regular cluster withdrawal penalties are tiered: twice study costs early, then 5%, 10% and 20% of estimated network upgrade costs as the process advances. |
Part B — Cluster Interconnection Studies Under FERC Order No. 2023: An Engineering Guide for Developers, Utilities and Large Loads
1. Why the US interconnection process changed
1.1 The serial queue problem
Under the pre-2023 pro forma procedures, each interconnection request went through a feasibility study, a system impact study and a facilities study, in queue order. Each study assumed that every higher-queued request would be built. When a higher-queued request withdrew, every lower-queued request's results could change, triggering restudies. Speculative requests — submitted to hold a queue position while a developer tested site control, offtake or financing — therefore imposed delays and costs on everyone else.
By the early 2020s, US queues held more than two terawatts of generation and storage, several times the installed capacity of the entire US fleet. Most requests never reached commercial operation, and median time from request to operation stretched beyond four years.
1.2 The Order No. 2023 response
| Reform | What it does |
|---|---|
| Cluster studies | Requests submitted in a cluster request window are studied together, with network upgrades identified and allocated for the group |
| First ready, first served | Readiness requirements — deposits, site control, commercial readiness — replace queue date as the main gate |
| Study deposits | $5,000 application fee plus a study deposit of $35,000 plus $1,000/MW (under 80 MW), $150,000 (80 to under 200 MW) or $250,000 (200 MW and above) |
| Site control | 90% site control at request; 100% at facilities study agreement and interconnection agreement; deposit in lieu of site control allowed in limited cases ($10,000/MW, minimum $500,000, maximum $2 million) |
| Commercial readiness deposits | Escalating deposits through the process, rising to 20% of estimated network upgrade costs at agreement execution |
| Withdrawal penalties | Tiered penalties if a withdrawal materially affects others' costs or timing |
| Study delay penalties | Per business day penalties on transmission providers that miss study deadlines, with caps |
| Affected systems | Standardized affected system study process and cost allocation |
| Alternative transmission technologies | Transmission providers must evaluate technologies such as advanced power flow control, transmission switching, synchronous condensers, voltage source converters, advanced conductors and tower lifting |
| Surplus interconnection service | Faster path to add resources, such as storage, using unused capacity at an existing interconnection |
| Inverter-based resource requirements | Ride through and accurate model submission requirements |
1.3 Transition procedures
Order No. 2023 required each transmission provider to transition its existing queue:
| Transition path | Eligibility (general) | Key features |
|---|---|---|
| Transitional serial study | Requests that had already received a facilities study agreement or were far advanced | Completed under serial rules, with a transitional withdrawal penalty |
| Transitional cluster study | Requests with completed or in-progress system impact studies that met readiness requirements | Combined cluster and facilities study; transitional withdrawal penalty of nine times study costs |
| Withdrawal without penalty | Requests choosing not to proceed | Exit at the start of the transition |
The transitional cluster combines what would normally be a cluster study, cluster restudy and facilities study into one study, followed by any restudies needed after withdrawals. In New England's case, the tariff required an interim report within 300 calendar days and a final report within 360 calendar days of issuing the study agreements, with no option to elect a separate facilities study.
2. Interconnection service types
2.1 Energy and capacity services
| FERC pro forma term | Typical regional equivalent | What it provides |
|---|---|---|
| Energy Resource Interconnection Service (ERIS) | Network Resource Interconnection Service (NRIS) in New England, studied under a network capability standard | Connects the resource and allows it to deliver energy using existing transmission capacity on an as-available basis |
| Network Resource Interconnection Service (NRIS) | Capacity Network Resource Interconnection Service (CNRIS) in New England, studied under a capacity capability standard | Ensures the resource's output is deliverable to load under peak conditions, allowing participation in capacity markets |
Terminology differs among regions, so engineers must read each tariff carefully. In New England, network resource service tests whether the resource can connect without degrading reliability, while capacity network resource service additionally tests whether its capacity is deliverable under the capacity capability interconnection standard used for the Forward Capacity Market.
2.2 Study elections
In the transitional cluster, every project requested capacity service:
- 18 projects were studied for both energy and capacity service for the first time;
- 5 projects that already had energy service studies elected capacity-only study;
- 2 projects elected an automatic downgrade from capacity service to energy service if capacity testing found thermal violations that energy testing did not.
The automatic downgrade option is a useful risk management tool. A battery project whose business case relies on energy arbitrage and ancillary services can protect itself from capacity deliverability upgrades that would not pay back.
3. What a cluster study examines
3.1 Base cases
Cluster studies start from base cases representing the future system:
- all in-service, under-construction and planned transmission and generation expected in service by the study year (2030 in the New England transitional cluster);
- load forecasts from the regional capacity, energy, loads and transmission forecast for peak conditions;
- fixed load levels for off-peak conditions: intermediate (shoulder), springtime light load, spring daytime minimum and nighttime minimum.
Off-peak cases matter more than ever. Spring daytime minimum load, with behind-the-meter solar suppressing net load, can create high voltages and heavy flows from injection-heavy areas. Nighttime minimum load stresses battery charging and wind export. A cluster dominated by battery storage must be tested both discharging and charging.
3.2 Planning models
Regional planning models represent the transmission system for interconnection studies, including requests for new generators, elective transmission upgrades, network service and modifications to existing facilities. The model set typically includes:
| Model | Contents | Typical software |
|---|---|---|
| Steady-state network model | Buses, branches, transformers, loads, generators, shunts, interfaces | PSS®E, PowerWorld, TARA |
| Transient stability model | Dynamic models of generators, exciters, governors, stabilizers, inverter-based resources, loads, protection | PSS®E, PSLF |
| Short circuit model | Sequence impedances, mutual coupling, generator and inverter fault contributions | ASPEN OneLiner, CAPE |
| EMT model (project and local area) | Vendor specific inverter models and detailed local network | PSCAD |
These models contain Critical Energy/Electric Infrastructure Information (CEII). Access requires approval through the transmission provider's CEII process, and some regions also publish automation tools (often Python-based) for building study cases. Developers and their consultants should request CEII access early: without base cases, pre-application screening is guesswork.
3.3 Steady-state analysis
| Test | What it identifies |
|---|---|
| Thermal analysis under N-1 and N-1-1 contingencies | Lines, transformers and equipment loaded above their applicable ratings (normal, long-term emergency, short-term emergency) |
| Voltage analysis | Bus voltages outside limits and voltage collapse risk |
| Capacity deliverability testing | Whether resource capacity is deliverable under stressed peak conditions |
| Interface transfer testing | Impact on key transfer limits (for example, east west interfaces) |
| Sub transmission screening | Impacts on lower voltage systems below the administered transmission system |
3.4 Short-circuit analysis
Short-circuit studies identify breakers whose interrupting capability would be exceeded by the cluster's added fault current. Inverter-based resources contribute much less fault current than synchronous generators — typically 1.0 to 1.2 times rated current — but many large inverter plants clustered on one bus still add up.
3.5 Stability and EMT analysis
| Test | Purpose |
|---|---|
| Design contingency testing | Stability for normal design criteria faults and contingencies |
| Extreme contingency testing | Behavior for more severe, less likely events |
| Bulk power system classification testing | Whether faults at a facility could have significant adverse impact outside the local area, determining applicability of regional bulk power system criteria |
| EMT analysis | Inverter based resource behavior in weak grid areas, control interactions and ride-through |
| Sub synchronous torsional interaction screening | Interaction between inverter controls and nearby turbine-generator shaft modes |
In the New England transitional cluster, steady-state, short-circuit, stability, EMT and torsional interaction screening were all performed. Detailed violation results are typically redacted as CEII in public reports, but the upgrade list reveals what was found: thermal overloads, voltage and stability problems requiring STATCOMs, and breaker or substation work.
3.6 Capacity deliverability testing
Capacity deliverability tests whether a resource's capacity can reach load during system peak, together with all other capacity resources, under stressed but credible conditions. The details are region-specific, but the core idea is common:
- Dispatch existing and queued capacity resources to serve peak load plus reserves.
- Increase output of the resources near the studied project (the "study area") while reducing output elsewhere, representing the worst credible local dispatch.
- Apply contingencies and check thermal limits.
- Identify upgrades needed for the project's capacity to be deliverable without bottling up other capacity resources.
Deliverability tests are often more restrictive than energy service tests, because they assume high simultaneous output in the study area. That is why the New England transitional cluster offered an automatic downgrade from capacity to energy service when capacity testing alone produced thermal violations.
In New England, capacity service enables participation in the Forward Capacity Market. The value of that participation — weighed against any additional deliverability upgrades — is a commercial decision that engineering results must inform.
3.7 Inverter-based resource performance in cluster studies
Storage-heavy and renewable-heavy clusters place inverter-based resource performance at the center of the study:
| Requirement | Relevance in the cluster study |
|---|---|
| IEEE 2800 2022 | Performance requirements for transmission-connected inverter-based resources: reactive capability, voltage and frequency ride-through, fast frequency response, negative-sequence current |
| NERC PRC 024 and PRC 029 | Frequency and voltage protective settings and ride through for generators and inverter-based resources |
| NERC MOD 032 and MOD 026/027 | Model data submission and model verification |
| Regional EMT model requirements | Vendor specific PSCAD models with quality checks for weak grid and control interaction studies |
| Sub synchronous torsional interaction screening | Inverter control interaction with nearby turbine generator shaft modes |
When many inverter-based resources cluster in a weak part of the network, EMT studies may reveal control interactions that positive-sequence studies cannot. Mitigations range from control tuning to grid-forming capability, synchronous condensers or STATCOMs — the latter appearing among the New England cluster's network upgrades.
4. Worked examples
4.1 Distribution factors and thermal overloads
The impact of a project on a monitored line is quantified by its distribution factor (DFAX) — the fraction of the project's injection that flows on the line for a given contingency:

Consider a 115 kV line with a long-term emergency rating of 240 MVA and a pre-cluster post-contingency flow of 200 MVA. Three cluster projects affect it:
| Project | Size | DFAX | Flow impact |
|---|---|---|---|
| A | 200 MW | 0.25 | +50 MVA |
| B | 150 MW | 0.20 | +30 MVA |
| C | 100 MW | 0.05 | +5 MVA |
| Total | 450 MW | — | +85 MVA |
Post-contingency flow rises to 285 MVA, or 118.75% of the long-term emergency rating. No single project would overload the line: A alone reaches 250 MVA (104%), B alone 230 MVA (96%) and C alone 205 MVA (85%). The overload is a cluster effect — exactly the condition the cluster process is designed to capture and allocate fairly.
4.2 Allocating the upgrade
Suppose reconductoring the line costs $40 million. Three allocation methods give very different answers:
| Method | Project A | Project B | Project C |
|---|---|---|---|
| Proportional impact (by MVA contribution: 50, 30, 5) | $23.5M (58.8%) | $14.1M (35.3%) | $2.4M (5.9%) |
| Per MW (200, 150, 100) | $17.8M (44.4%) | $13.3M (33.3%) | $8.9M (22.2%) |
| Per capita | $13.3M (33.3%) | $13.3M (33.3%) | $13.3M (33.3%) |
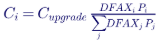
The proportional impact method assigns cost according to each project's contribution to the need, which is why Order No. 2023 adopted it for system network upgrades. Many regions also apply a minimum distribution factor threshold (often around 3% to 5%); a project below the threshold may be excluded from both the upgrade's cost and the violation list.
The general expression for proportional impact allocation is:
4.3 Study cost allocation
Study costs are allocated differently from upgrade costs. In the New England transitional cluster, study and restudy costs are allocated 50% per capita and 50% per MW. Suppose the cluster's total study cost were $6 million across 23 projects and 4,826.5 MW. A 200 MW project's share would be:

Order No. 2023 lets transmission providers choose a per capita share between 10% and 50%, with the rest allocated per MW. A higher per capita share burdens small projects relatively more; a higher per MW share burdens large projects.
4.4 Withdrawal penalties
Using the same $255,000 study cost share:
| Situation | Penalty basis | Illustrative penalty |
|---|---|---|
| Transitional cluster withdrawal | Nine times study costs | ≈ $2.29 million |
| Regular cluster, withdrawal during cluster study | Two times allocated study costs (or study deposit, if greater) | ≈ $0.51 million |
| Regular cluster, after restudy, before facilities study | 5% of estimated network upgrade costs | 5% × $178M = $8.9 million |
| Regular cluster, during facilities study or after draft agreement | 10% of estimated network upgrade costs | $17.8 million |
| Regular cluster, after agreement execution | 20% of estimated network upgrade costs | $35.6 million |
The $178 million figure is the average network upgrade cost for the 18 projects studied for energy service for the first time in the New England transitional cluster (average size about 213 MW, or about $836/kW). Under the pro forma rules, a withdrawal penalty applies only when the withdrawal materially affects other customers' costs or timing, and penalties are waived when network upgrade costs rise sharply after a study report (more than 25% after a cluster restudy, or more than 100% after the facilities study). Funds are first used to cover restudy costs and then to offset upgrade cost increases for remaining customers.
4.5 Interconnection agreement deposits
At agreement execution, the New England transitional cluster required a deposit of 20% of identified network upgrade costs. For the highest-cost project in the cluster, about $541 million, that is about $108 million — due within days of agreement execution. For the average project with first-time energy service studies, it is about $35.6 million. Developers must plan financing for these deposits well before the study report is issued.
4.6 Short-circuit impact of inverter clusters
A 300 MW battery project contributes roughly:

at 115 kV, assuming 1.2 per unit fault current on a 300 MVA base. If a 115 kV bus already has 38 kA of fault duty and 40 kA breakers, one such project raises duty to about 39.8 kA (99.5% of rating), and a second nearby project would exceed it. Breaker replacements, current-limiting reactors or bus splitting then become network upgrades.
4.7 STATCOM sizing for voltage support
The voltage change at a bus produced by a reactive power injection is approximately:

A 400 Mvar STATCOM at a 345 kV bus with 10,000 MVA of short-circuit capacity raises voltage by about 4% — a large and fast correction for post-contingency voltage collapse or weak-grid stability problems. At a 115 kV distribution-adjacent bus with 1,500 MVA, a 66 Mvar device produces a similar 4.4% change. Reactive devices of 400 Mvar, 250 Mvar and 66 Mvar appear among the New England transitional cluster upgrades, along with containerized 8 Mvar distribution-voltage STATCOMs where transmission-voltage devices would have been oversized and physically constrained.
4.8 Reconductoring with high-temperature, low-sag conductor
Aluminum conductor steel-supported (ACSS) conductor can operate continuously at much higher temperatures than conventional ACSR, increasing ampacity without heavier structures. A 345 kV line rebuilt with double-bundled 1590 kcmil ACSS and a summer long-term emergency rating of 2,557 MVA carries:
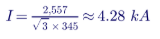
or about 2,140 A per subconductor — within the capability of 1590 kcmil ACSS at elevated temperature. Because ACSS weighs about the same as ACSR of similar size, it can often be installed on existing structures. When structures are aged wood H-frames, however, a full rebuild may be unavoidable regardless of conductor choice. NESC clearance requirements at maximum sag must be checked for any higher-temperature operation.
4.9 Worked example: commercial readiness deposits through the process
For a 200 MW regular-cluster request with an eventual network upgrade allocation of $178 million, the pro forma Order No. 2023 deposit path is approximately:
| Stage | Requirement | Cumulative amount at risk |
|---|---|---|
| Cluster request | $5,000 fee plus $250,000 study deposit | ≈ $255,000 |
| Commercial readiness deposit at request | Two times the study deposit | ≈ $755,000 |
| Entering cluster restudy | Total readiness deposit raised to 5% of allocated network upgrade costs | ≈ $8.9 million |
| Entering facilities study | Raised to 10% of network upgrade costs | ≈ $17.8 million |
| Interconnection agreement execution | Raised to 20% of network upgrade costs | ≈ $35.6 million |
The capital at risk rises sharply as the study progresses, which is the intent: a developer that is not ready to build is pushed to withdraw early, when the impact on others is smallest. Individual transmission providers may adopt variations accepted by FERC, so the applicable tariff governs.
4.10 Worked example: what an upgrade allocation means for project economics
A network upgrade allocation is a capital cost. Annualized with a capital recovery factor:
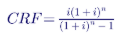
at an 8% cost of capital over 20 years, CRF ≈ 0.102. The annual cost per kW-year of different allocations is:
| Allocated network upgrade cost | Annualized cost |
|---|---|
| $100/kW | ≈ $10/kW-year |
| $453/kW (345 kV cluster average) | ≈ $46/kW-year |
| $831/kW (115 kV cluster average) | ≈ $85/kW-year |
| $1,500/kW | ≈ $153/kW-year |
| $2,700/kW (highest in the cluster) | ≈ $275/kW-year |
For a battery project, these annualized costs must be recovered from capacity revenues, energy arbitrage, ancillary services and any contracted payments. An allocation of $1,500/kW or more can exceed the entire annual revenue a storage project can expect from capacity markets in many years. Some network upgrade costs may be eligible for transmission credits or other recovery mechanisms depending on the region's tariff, which changes the calculation; developers should model both cases.
4.11 Worked example: study delay penalties
Order No. 2023 imposes penalties on transmission providers for late studies — for example, $1,000 per business day for a late cluster study, $2,000 for a late cluster restudy or affected system study, and $2,500 for a late facilities study, each subject to caps tied to study deposits. A cluster study 40 business days late would accrue $40,000 in penalties, distributed among customers that remained in the cluster. The amounts are modest relative to project costs; their purpose is accountability and transparency, with transmission providers able to seek relief for delays outside their control.
5. Keentel's analysis of the cluster results
5.1 Cost concentration
| Cost category | Total | Share |
|---|---|---|
| Interconnecting transmission owner's interconnection facilities | $75.5M | 2.4% |
| Substation network upgrades | $581.7M | 18.1% |
| System network upgrades | $2,540.9M | 79.3% |
| Distribution upgrades | $7.7M | 0.2% |
| Total | $3,205.9M | 100% |
Project-level costs are dominated by shared system network upgrades. Five of the seven most expensive projects per kW connected at 115 kV, and four of those sat in one western area where cumulative battery injections overloaded the same corridors.
5.2 Cost by point-of-interconnection voltage
| POI voltage | Projects | MW | Total cost | Average cost |
|---|---|---|---|---|
| 345 kV | 7 | 2,262 | $1,025M | $453/kW |
| 230 kV | 1 | 300 | $301M | $1,004/kW |
| 115 kV | 14 | 2,263 | $1,880M | $831/kW |
| 34.5 kV | 1 | 2 | $0 | $0/kW |
The 115 kV projects carried nearly twice the per-kW cost of the 345 kV projects. Lower-voltage networks have lower thermal capacity per circuit and are more easily overloaded by clustered injections; their upgrades are also less likely to be shared with large projects at higher voltages.
5.3 Upgrade types
| Upgrade type | Examples in the cluster | What drives it |
|---|---|---|
| Reconductoring with ACSS | Numerous 115 kV and 345 kV line segments | Thermal overloads |
| Line rebuilds | 345 kV line with aged wood structures (111.6% overload) | Thermal overload where structures cannot support reconductoring |
| Transmission STATCOMs | 400 Mvar and 250 Mvar at 345 kV; 66 Mvar at a 230 kV POI | Voltage and stability violations |
| Distribution voltage STATCOMs | Containerized 8 Mvar units at 23 kV | Local voltage needs where transmission devices were oversized |
| Transformer replacements | Substation autotransformers and step-down transformers | Thermal overloads |
| Breaker work | 345 kV breaker addition or replacement | Short-circuit duty or configuration needs |
| Substation network upgrades | New POI substations and line taps | Physical connection of projects |
5.4 Schedule
Construction time estimates ranged from 6 to 93 months from notice to proceed. Upgrades longer than five years usually involve multiple line rebuilds, siting and permitting, and outage coordination on heavily used corridors. For battery storage projects that can be built in 12 to 24 months, network upgrade schedules — not project construction — set the commercial operation date. Limited operation studies, interim deliverability and phased interconnection can sometimes bridge the gap.
6. Alternative transmission technologies
Order No. 2023 requires transmission providers to evaluate alternative transmission technologies when identifying network upgrades. A typical set of guidelines maps each technology to the violation types it may address:
| Technology | Violation types it may address |
|---|---|
| Static synchronous compensators (STATCOMs) | Voltage, stability, reactive requirements |
| Static var compensators (SVCs) | Voltage, stability, reactive requirements |
| Advanced power flow controllers | Thermal, voltage, stability |
| Transmission switching | Thermal, voltage, stability |
| Synchronous condensers | Voltage, stability, reactive requirements, weak grid |
| Voltage source converters | Voltage, stability, reactive requirements |
| Advanced conductors | Thermal |
| Tower lifting | Thermal |
Keentel's observations from the New England results:
- ACSS is now standard. Transmission owners treated high-temperature, low-sag conductor as their default reconductoring choice, with composite-core conductors reserved for long spans, river crossings or structures with spare strength and clearance.
- Power flow controllers were considered but often more expensive than reconductoring for single thermal violations.
- Transmission switching was rejected where opening circuits would weaken reliability, especially on critical interfaces.
- Modular STATCOMs created value: containerized distribution-voltage units kept two projects viable at lower cost than transmission-voltage devices.
- Dynamic line ratings (not in the list above, but required for consideration under FERC's related transmission rules) may offer further near-term capacity on wind-cooled lines.
7. Contingent facilities, affected systems and restudies
7.1 Contingent facilities
Contingent facilities are unbuilt network upgrades or higher-queued projects on which a project's interconnection depends. If a contingent facility is delayed or cancelled, the project's schedule and costs may change. Interconnection agreements must identify them, and developers should track their status as closely as their own construction.
7.2 Affected systems
When a cluster affects a neighboring transmission system — another utility's lower-voltage system within the region, or a neighboring region — an affected system study determines whether additional upgrades are required. Order No. 2023 standardized affected system study timelines and cost allocation. In New England, projects requiring affected system studies could request an extended agreement execution deadline of 30 days after receipt of the affected system study report.
7.3 Restudies
The New England transitional cluster had no formal restudy window, but restudies may occur if withdrawals of transitional cluster projects or higher-queued requests change results. The extent depends on where and how much capacity withdraws. Restudy costs are allocated 50% per capita and 50% per MW among affected projects, and are offset first by forfeited deposits from withdrawn requests. Restudies can run in parallel with the first regular cluster study.
7.4 Withdrawal cascades
Because shared upgrades are allocated across the cluster, a withdrawal can raise costs for those who remain:
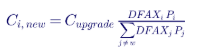
In the example of Section 4.2, if Project A withdraws and the $40 million upgrade is still needed (flow without A is 235 MVA, just under the 240 MVA rating, so it would not be), the upgrade could disappear entirely. If instead the base-case flow were 220 MVA, B and C alone would produce 255 MVA, the upgrade would remain, and B's share would rise from $14.1 million to $34.3 million. Withdrawal penalties exist precisely to fund cases like this.
8. Large loads and the interconnection queue
Data centers and other large loads are not subject to generator interconnection procedures, but they compete for the same transmission capacity. A cluster study's base case includes forecast load; a large load that appears after the base case is set can change flows, create new violations and require restudies. Increasingly, regions and utilities are developing large-load interconnection processes, co-location rules and surplus interconnection options for load-plus-generation sites. Developers of data center campuses with on-site generation or storage must understand both the load and generator interconnection processes, because the storage or generation portion may enter a generator cluster.
8A. How cluster processes compare across US regions
Every FERC-jurisdictional transmission provider now runs some form of cluster study, but the details differ. Engineers working in several regions must keep the differences straight.
| Region | Process (general description) | Notable features |
|---|---|---|
| ISO New England | Annual cluster request window; transitional cluster in 2025–2026; first regular window October–November 2026 | Energy (network resource) and capacity network resource services; capacity deliverability tied to the Forward Capacity Market |
| PJM | Cycle-based process introduced under its own interconnection reform before Order No. 2023, with transition cycles | Readiness deposits and site control gates; deliverability testing for capacity |
| MISO | Definitive Planning Phase cycles in multiple study phases | Milestone payments by phase; energy and network resource service |
| SPP | Definitive interconnection system impact study clusters | Energy and network resource service; affected system coordination with neighbors |
| CAISO | Cluster process with intake limits tied to zonal transmission capacity | Deliverability allocation linked to resource adequacy |
| NYISO | Cluster study replacing the former class year process | Deliverability tied to capacity market participation |
| ERCOT | Not FERC jurisdictional for interconnection; generator interconnection studies under ERCOT protocols and planning guides | Connect and manage approach; no deliverability service; congestion managed through the market |
The common lesson: interconnection service definitions, deposit schedules, withdrawal penalties and allocation methods are tariff-specific. A strategy that works in one region can fail in another, and published summaries often compress these differences. Engineering teams should always work from the current tariff and business practice manuals, and confirm interpretations with the transmission provider during scoping.
9. A practical developer strategy for the cluster era
9.1 Before the cluster window
- Obtain CEII access and planning models. Use the transmission provider's base cases, not public approximations.
- Screen points of interconnection. Run distribution factor analysis on candidate POIs against known constraints; avoid corridors already loaded by queued projects.
- Consider higher-voltage POIs. The New England results show 345 kV POIs averaging about half the per-kW cost of 115 kV POIs.
- Right-size the request. Model multiple sizes; a smaller request may avoid an expensive upgrade threshold.
- Choose the service type deliberately. Energy-only service, capacity service, or capacity with an automatic downgrade option.
- Secure site control and financing for deposits, including the 20% network upgrade deposit at agreement execution.
- Prepare accurate models. Validated PSS®E and PSCAD models of the actual inverters, collector system and plant controller.
9.2 During the cluster study
- Attend the scoping meeting and confirm modeling assumptions for the project.
- Track other cluster members and their likely withdrawals.
- Review interim results critically: check model data, ratings, contingency definitions and upgrade scope.
- Comment within the comment window with specific engineering evidence.
- Evaluate alternatives: POI changes allowed under material modification rules, size reductions, service downgrades, surplus interconnection.
9.3 After the study
- Negotiate the interconnection agreement within the 60-day window.
- Post deposits on time to avoid deemed withdrawal.
- Track contingent facilities and network upgrade schedules.
- Submit as-purchased and as-built data, keeping the project's equipment rated for the duties assumed in the study.
9.4 Worked example: screening two POIs
A developer considers a 200 MW battery at either of two POIs:
| Factor | POI 1: 115 kV | POI 2: 345 kV |
|---|---|---|
| Distance to site | 2 miles | 9 miles |
| Gen-tie cost (developer) | ≈ $6M at 115 kV | ≈ $33M at 345 kV |
| POI substation cost | ≈ $15M | ≈ $40M |
| Screening DFAX on known constrained elements | 0.18 to 0.30 on two loaded 115 kV corridors | Below 0.05 on all monitored elements |
| Expected network upgrade exposure (from regional averages) | $800 to $1,500/kW, or $160M to $300M | $200 to $450/kW, or $40M to $90M |
| Total exposure | ≈ $180M to $320M | ≈ $115M to $165M |
The 345 kV POI has higher direct costs but much lower network upgrade risk. Screening with actual base cases, rather than proximity alone, changes the decision.
9.5 Surplus interconnection and material modifications
Two provisions give developers flexibility outside the full cluster process:
| Provision | What it allows | Engineering considerations |
|---|---|---|
| Surplus interconnection service | Adding a new resource (often storage) that uses unused interconnection capacity of an existing facility, without increasing the facility's total injection at the POI | Plant controller must limit total injection; studies confirm no new reliability impacts; reactive capability and protection must cover the combined plant |
| Material modification review | Changes to a request (technology, size, POI, equipment) evaluated for whether they materially affect other requests | Changes after study begins are limited; inverter changes require new models; size reductions are generally permitted within limits |
| Generating facility modifications | Equipment changes such as a different inverter model | Updated PSS®E and PSCAD models must show equal or better performance |
A storage addition at an existing solar or wind site via surplus interconnection can avoid the cluster process entirely, provided total injection stays within the existing interconnection service. For many developers, this is the fastest way to add storage in congested regions.
10. Engineering quality in cluster studies
10.1 Model accuracy
Cluster results are only as good as the models submitted. Common problems include:
- generic inverter models that do not match the selected equipment;
- incorrect reactive capability curves;
- plant controller settings inconsistent with the interconnection requirements;
- collector system impedances that differ from the design;
- PSCAD models that fail quality checks or do not initialize.
NERC reliability guidelines on inverter-based resource modeling and IEEE 2800-2022 performance requirements set expectations for model fidelity and plant performance. Transmission providers increasingly reject or delay requests with poor models.
10.2 Ratings
Thermal violations depend on facility ratings. Transmission owner rating methodologies, governed by NERC FAC-008, determine normal, long-term emergency and short-term emergency ratings. A rating error — such as an outdated limiting element — can create or hide a violation. Developers and their engineers should check that limiting elements and ratings in the study match current transmission owner data.
10.3 Contingency definitions
N-1 and N-1-1 contingencies, breaker-failure and stuck-breaker events, and common-tower contingencies must match the transmission owner's protection and substation configuration. An incorrect contingency definition can drive an expensive upgrade.
10.4 Battery charging
Storage-dominated clusters must be tested in charging mode at light load. A battery charging at full power is a large load on the system; clustered charging can overload facilities in the opposite direction from discharge. Operating restrictions on charging can sometimes avoid upgrades.
10.5 Reviewing a cluster study report: Keentel's checklist
Public cluster reports redact violation details, short-circuit results, stability results, cost allocation details and contingent facilities as CEII. Interconnection customers receive the full report. Keentel's review of a cluster report for a client follows a structured checklist:
| Area | Questions to ask |
|---|---|
| Project data | Does the model match the latest one-line, inverter model, transformer impedances, collector system and plant controller settings? |
| Base case | Are the right in-service dates, load levels and dispatch assumptions used? Are recently withdrawn projects removed? |
| Ratings | Do monitored element ratings match the transmission owner's current ratings? Is the limiting element correct? |
| Contingencies | Do contingency definitions reflect actual protection and breaker configurations? |
| Distribution factors | Does the project's DFAX on each violated element exceed the allocation threshold? |
| Upgrade scope | Is the proposed upgrade the least cost solution that resolves the violation? Were alternative technologies fairly evaluated? |
| Cost estimate | Are planning grade estimates consistent with recent transmission owner costs for similar work? Are contingencies and escalation reasonable? |
| Allocation | Is the proportional impact calculation applied correctly? Are substation upgrades allocated only among projects at that substation? |
| Schedule | Which upgrades drive the project's in service date? Are there contingent facilities with uncertain status? |
| Stability and EMT | Are any dynamic performance issues tied to the project's model quality rather than physical behavior? |
| Short circuit | Are inverter fault contributions modeled per the manufacturer's data? |
| Service type | Would energy only service or a smaller size avoid the costliest upgrades? |
Questions should be raised during the comment period with specific engineering evidence: corrected ratings, revised models, alternative upgrade proposals or sensitivity results. Transmission providers are far more responsive to precise technical comments than to general objections about cost.
10.6 Interim versus final reports
The interim report is the main opportunity to influence results. Between interim and final reports in the New England transitional cluster, the process allowed comments, refinement of upgrade scopes (for example, adjusting distribution-voltage STATCOM costs from 10 Mvar to the required 8 Mvar rating) and correction of data. After the final report, changes generally come only through restudies triggered by withdrawals, or through detailed design during the interconnection agreement phase.
11. Common misconceptions corrected
| Misconception | Engineering reality |
|---|---|
| "Cluster studies make interconnection cheaper." | They make costs more predictable and allocate them more fairly; they do not reduce the physical upgrades needed. |
| "The study cost allocation method also allocates upgrade costs." | Study costs and network upgrade costs use different methods: study costs per capita and per MW; system network upgrades by proportional impact. |
| "Withdrawal penalties are always nine times study costs." | Nine times applies to transitional studies. Regular cluster penalties are tiered and rise to 20% of network upgrade costs. |
| "Project size determines cost." | Location, POI voltage and cluster neighbors dominate. In New England, costs ranged from $0 to about $2,700/kW. |
| "Network upgrades will be built in time for my project." | Many upgrades take 5 to nearly 8 years; schedules must be checked before committing to commercial operation dates. |
| "Planning grade estimates are final." | They are non-binding, good faith estimates and can change through detailed design, restudy and construction. |
| "Generic models are acceptable." | Inaccurate models delay studies and can produce incorrect upgrades; vendor-specific validated models are required. |
12. Key takeaways
- First-ready, first-served replaced first-come, first-served. Readiness, not queue date, now drives priority.
- Clusters reveal cumulative impacts. Upgrades no single project would trigger are identified and shared.
- Location and POI voltage dominate cost. Screen POIs with actual base cases.
- Know the allocation rules. Study costs, substation upgrades and system upgrades are allocated differently.
- Price withdrawal risk. Transitional penalties of nine times study costs, and regular penalties up to 20% of upgrade costs, change the economics of speculative requests.
- Plan for long upgrade schedules and large deposits.
- Model quality is a commercial issue. Accurate models reduce delays and avoid unnecessary upgrades.
13. How Keentel Engineering helps
Keentel Engineering supports developers, independent power producers, utilities and large-load customers through every stage of the interconnection process, from 4 kV to 765 kV.
| Stage | Keentel scope | Outcome |
|---|---|---|
| Site and POI screening | Distribution factor and headroom analysis using CEII base cases, cost exposure estimates | Better POI selection before the cluster window |
| Interconnection request preparation | Applications, one-lines, PSS®E and PSCAD models, model quality checks | Complete, accurate requests that avoid deficiency delays |
| Cluster study participation | Scoping meeting support, interim result review, technical comments | Errors caught and challenged with engineering evidence |
| Independent cluster studies | Steady-state, short circuit, stability, EMT and capacity deliverability studies replicating transmission provider methods | Independent view of upgrade risk and alternatives |
| Upgrade alternatives | Alternative transmission technologies, size optimization, service type decisions, surplus interconnection | Lower cost paths to interconnection |
| Interconnection agreement support | Technical review of agreements, contingent facilities and schedules | Clear understanding of obligations and risks |
| Owner's engineer and design | POI substations, gen-tie lines, collector systems, plant controllers, protection | Designs that match study assumptions |
| Large-load interconnection | Data center and industrial load studies, co-located generation and storage | Coordinated load and generation interconnection |
Why clients choose Keentel Engineering
- Interconnection expertise across regions: ISO-NE, PJM, MISO, SPP, ERCOT, CAISO, NYISO and non-RTO utilities.
- Study depth: steady-state, short-circuit, stability and EMT under one team.
- Commercial understanding: engineering results translated into cost, schedule and risk decisions.
- Practical design experience: substations, transmission lines and inverter-based plants.
- Licensed professional engineering: a Florida-registered firm with offices in Tampa, Austin, Sacramento and Baltimore, supporting projects nationwide.
Preparing for a cluster request window or reviewing cluster study results? Talk to Keentel Engineering at (813) 389-7871, contact@keentelengineering.com, or book a 15-minute scoping call at calendly.com/keentel-engineering/15min.
Part C — Technical FAQ: Cluster Interconnection Studies
A study that evaluates all interconnection requests submitted in a request window together, identifying the network upgrades needed for the group and allocating their costs among the members.
Serial studies evaluated requests one at a time in queue order, assuming all higher-queued requests were built. Cluster studies evaluate the group simultaneously, reducing cascading restudies.
Priority is based on meeting readiness requirements — deposits, site control and commercial readiness — rather than the date a request was submitted.
A one-time study under Order No. 2023 transition procedures for eligible existing requests, combining the cluster study and facilities study into a single study with a transitional withdrawal penalty.
Under Order No. 2023, nine times the study costs for transitional studies, applied to projects that withdraw or do not reach commercial operation.
The greater of the study deposit or a tiered amount: twice allocated study costs during the cluster study, then 5%, 10% and 20% of estimated network upgrade costs as the process advances, applied only when the withdrawal materially affects others.
Between per capita and per MW shares; Order No. 2023 allows 10% to 50% per capita. The New England transitional cluster used 50% per capita and 50% per MW.
Under the pro forma procedures, system network upgrades are allocated by the proportional impact method based on each project's contribution to the need, and substation network upgrades per capita among projects at that substation.
The fraction of a project's injection that flows on a monitored element, typically for a specific contingency. It measures the project's impact on that element.
Energy service allows a resource to connect and deliver energy using available transmission capacity. Capacity service additionally ensures deliverability under peak conditions for capacity market participation.
Peak load from the regional forecast plus off-peak levels such as shoulder, light load, spring daytime minimum and nighttime minimum, which are critical for storage and renewable-heavy clusters.
PSS®E for power flow and stability, TARA for deliverability and transfer analysis, ASPEN OneLiner for short circuit and PSCAD for EMT studies.
Lower-voltage networks have less thermal capacity per circuit and saturate sooner under clustered injections. In New England's transitional cluster, 115 kV projects averaged about $831/kW versus about $453/kW at 345 kV.
Network upgrades at the substation where the project interconnects, such as new breaker positions and bus work, as distinct from system network upgrades elsewhere in the network.
Unbuilt network upgrades or higher-queued projects on which a project's interconnection depends. Their delay or cancellation can affect the project's schedule and cost.
Typically 20% of estimated network upgrade costs, as in the New England transitional cluster.
Technologies such as STATCOMs, SVCs, advanced power flow controllers, transmission switching, synchronous condensers, voltage source converters, advanced conductors and tower lifting, which must be evaluated as alternatives to conventional upgrades.
Batteries charging at full power act as large loads. Clustered charging can overload facilities at light load, in the opposite direction from discharge.
In the New England transitional cluster, estimates ranged from 6 to 93 months from notice to proceed.
Screen points of interconnection with actual CEII base cases and distribution factor analysis, and prepare accurate, validated models of the project.
References and Further Reading
Links were current at publication (October 2026).
- FERC Order No. 2023, Improvements to Generator Interconnection Procedures and Agreements, 184 FERC ¶ 61,054 (2023), and Order No. 2023-A, 186 FERC ¶ 61,199 (2024). Federal Energy Regulatory Commission.
- FERC pro forma Large Generator Interconnection Procedures (as revised by Order No. 2023). Federal Energy Regulatory Commission.
- ISO New England, Interconnection Service Study Planning Models (iso-ne.com, System Planning section). ISO New England Inc.
- ISO New England Open Access Transmission Tariff, Schedules 22, 23 and 25, and Planning Procedure PP5-6. ISO New England Inc.
- ISO New England public materials on the transitional cluster study and next steps (2025–2026). ISO New England Inc.
- NERC Reliability Standards FAC-008, TPL-001, MOD-032 and MOD-026/027; NERC reliability guidelines on inverter-based resource modeling. North American Electric Reliability Corporation.
- IEEE Std 2800-2022, Interconnection and Interoperability of Inverter-Based Resources Interconnecting with Associated Transmission Electric Power Systems. IEEE.
- IEEE Std 738, Calculating the Current-Temperature Relationship of Bare Overhead Conductors. IEEE.
- National Electrical Safety Code (NESC), IEEE C2. IEEE.
- Lawrence Berkeley National Laboratory, Queued Up: Characteristics of Power Plants Seeking Transmission Interconnection (annual editions).
Disclaimer
This article is general technical information for educational purposes. It is not engineering, legal or financial advice for any specific project and does not create a professional relationship. Figures summarized here are drawn from public, planning-grade, non-binding estimates and may change through restudy, detailed design and construction; Keentel's aggregations and per-kW calculations are its own analysis, and projects are anonymized. Tariff provisions vary by transmission provider and change over time; readers must consult the current FERC-accepted tariff, transmission provider procedures and qualified legal counsel. Worked examples use illustrative values. Engineering work must follow applicable IEEE standards, the NESC, NERC requirements and transmission provider criteria, sealed by a licensed professional engineer where required.
FERC, NERC, IEEE,
ISO New England and other names are the property of their respective owners. Keentel Engineering is not affiliated with or endorsed by these organizations or any software vendor.
| Office | Address | Phone |
|---|---|---|
| Head Office — Tampa | 400 N Ashley Dr STE #2600, Tampa FL 33602 | (813) 389-7871 |
| Austin | 5900 Balcones Drive STE 100, Austin TX 78731 | (512) 591-0752 |
| Sacramento | 1401 21st St Ste R, Sacramento CA 95811 | (916) 913-4524 |
| Baltimore | 306 W Redwood St STE 200, Baltimore MD 21201 | (410) 225-2181 |

About the Author:
Sandip "Sonny" R. Patel, P.E.
IEEE Senior Member · Founder & CEO, Keentel Engineering
In 1995, Sonny Patel earned his Electrical Engineering degree from the University of Illinois. But degrees don't build legacies — action does.
For three decades, he has worked the power industry from every side of the table: 16 years as a utility engineer at Exelon/Commonwealth Edison; generation leadership across hydroelectric, industrial steam turbine, and a 9 GW renewable fleet; NERC Regional Entity Senior Compliance Engineer and Audit Team Lead, auditing some of the nation's largest utilities; and testing and commissioning lead on equipment up to 765 kV — the very top of the North American grid.Utility. Generator. Regulator. Consultant. Few engineers have seen all four seats. Fewer still have sat in them.
His experience spans nuclear, hydro, conventional generation, renewables, oil and gas, mining — and today's data centers, where he is authoring a three-book series on data center design. He is a Licensed Professional Engineer in six states and a Licensed Electrical Contractor in Florida (Unlimited EC) — he doesn't just design the work; he's qualified to stand behind its execution.Today, as Founder and CEO of Keentel Engineering, Sonny leads a nationwide team of engineers delivering substation design, power system studies, NERC compliance, and commissioning — done right, coast to coast.Three decades. Every side of the table. One standard: accountable engineering.
Services

Let's Discuss Your Project
Let's book a call to discuss your electrical engineering project that we can help you with.
About the Author:
Sandip "Sonny" R. Patel, P.E.
IEEE Senior Member · Founder & CEO, Keentel Engineering
In 1995, Sonny Patel earned his Electrical Engineering degree from the University of Illinois. But degrees don't build legacies — action does.
For three decades, he has worked the power industry from every side of the table: 16 years as a utility engineer at Exelon/Commonwealth Edison; generation leadership across hydroelectric, industrial steam turbine, and a 9 GW renewable fleet; NERC Regional Entity Senior Compliance Engineer and Audit Team Lead, auditing some of the nation's largest utilities; and testing and commissioning lead on equipment up to 765 kV — the very top of the North American grid.
Utility. Generator. Regulator. Consultant. Few engineers have seen all four seats. Fewer still have sat in them.
His experience spans nuclear, hydro, conventional generation, renewables, oil and gas, mining — and today's data centers, where he is authoring a three-book series on data center design. He is a Licensed Professional Engineer in six states and a Licensed Electrical Contractor in Florida (Unlimited EC) — he doesn't just design the work; he's qualified to stand behind its execution.
Today, as Founder and CEO of Keentel Engineering, Sonny leads a nationwide team of engineers delivering substation design, power system studies, NERC compliance, and commissioning — done right, coast to coast.Three decades. Every side of the table. One standard: accountable engineering.
Leave a Comment
Thank you for contacting us.
We will get back to you as soon as possible.
We will get back to you as soon as possible.
Oops, there was an error sending your message.
Please try again later.
Please try again later.
Related Posts
By SANDIP R PATEL
•
October 23, 2026
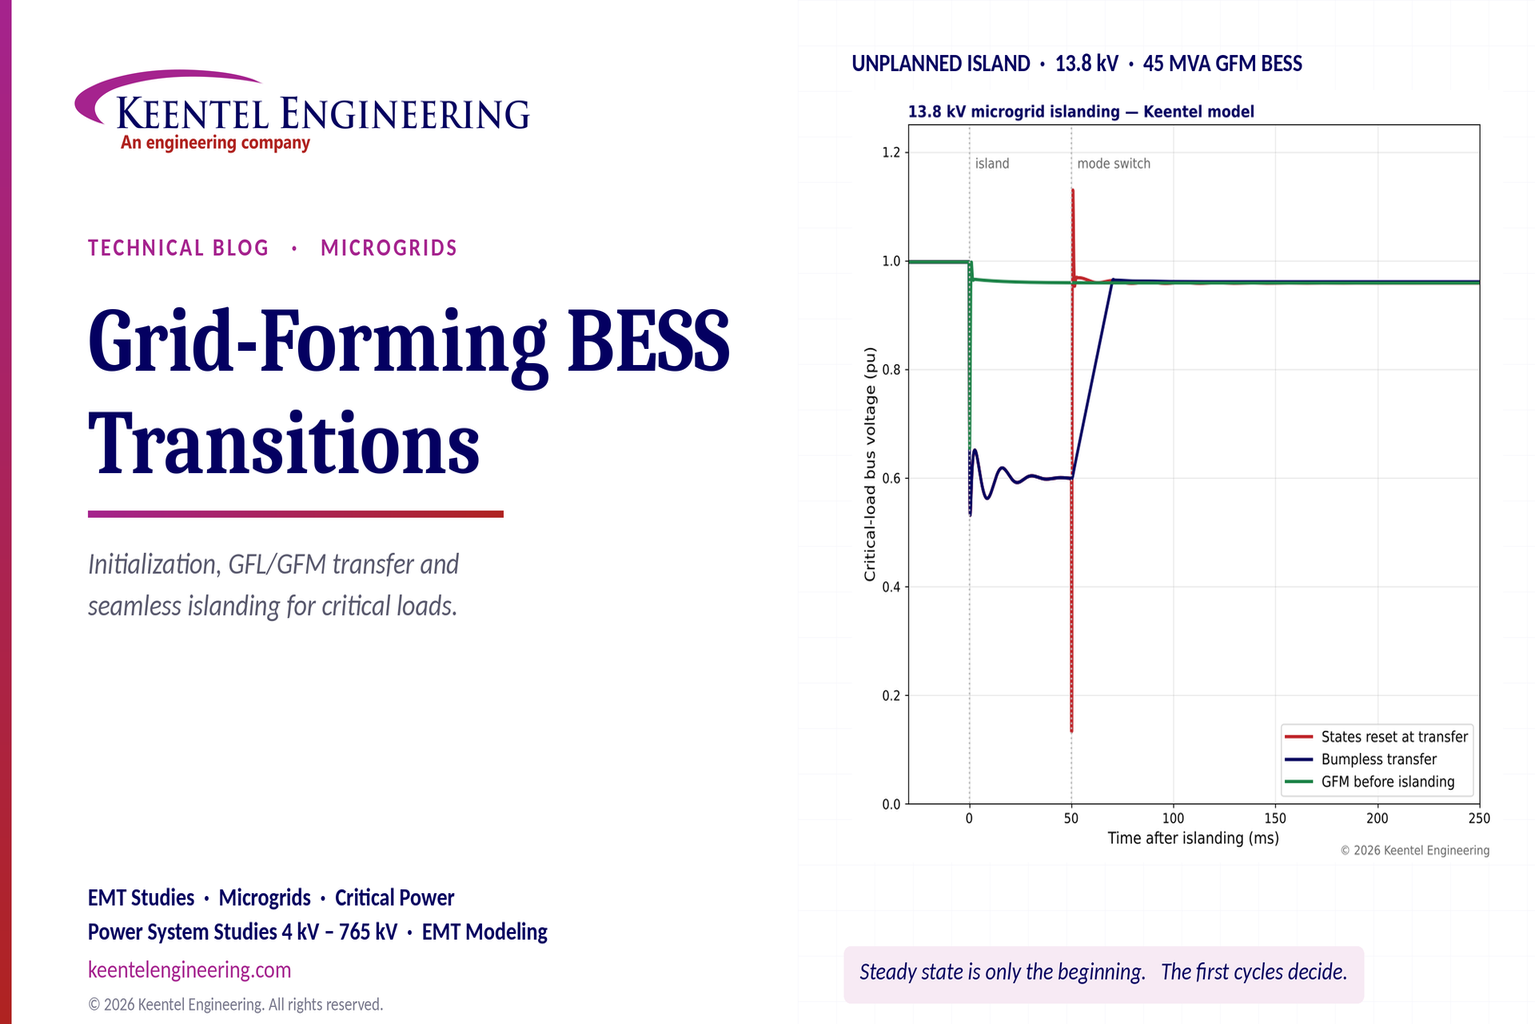
Explore grid-forming BESS initialization, GFL-to-GFM transitions, seamless islanding, EMT simulations, current limiting and microgrid protection.
By SANDIP R PATEL
•
October 23, 2026
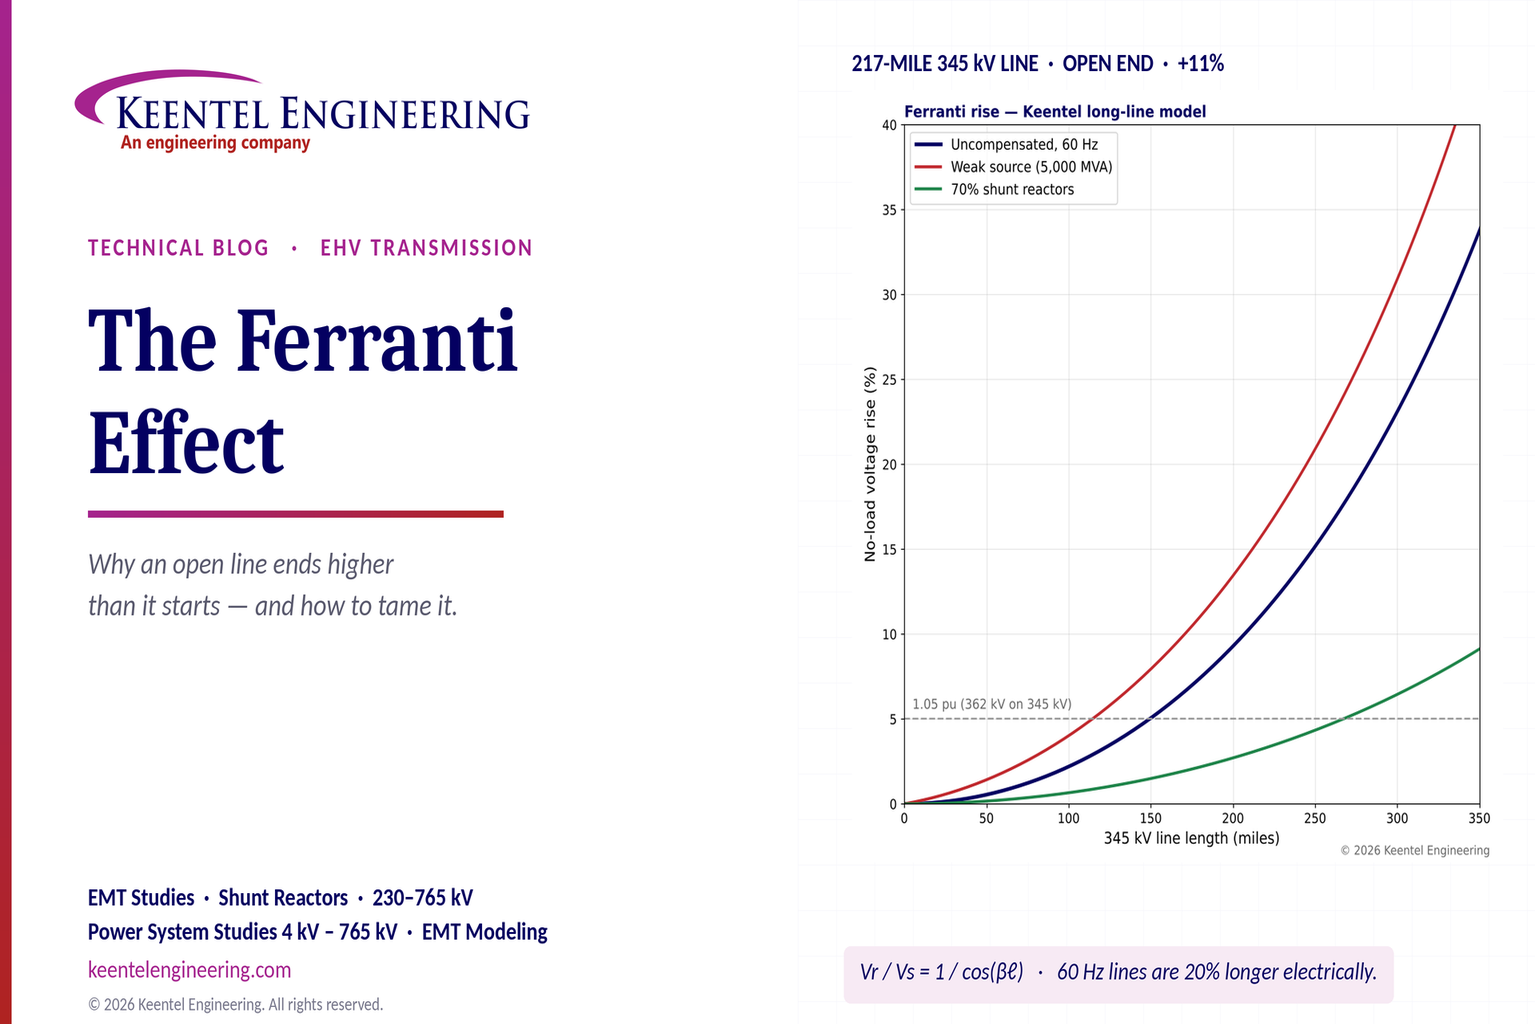
Explore the Ferranti effect in EHV transmission lines: voltage rise, 345 kV examples, switching overvoltages, shunt reactor sizing and mitigation.
By SANDIP R PATEL
•
October 21, 2026
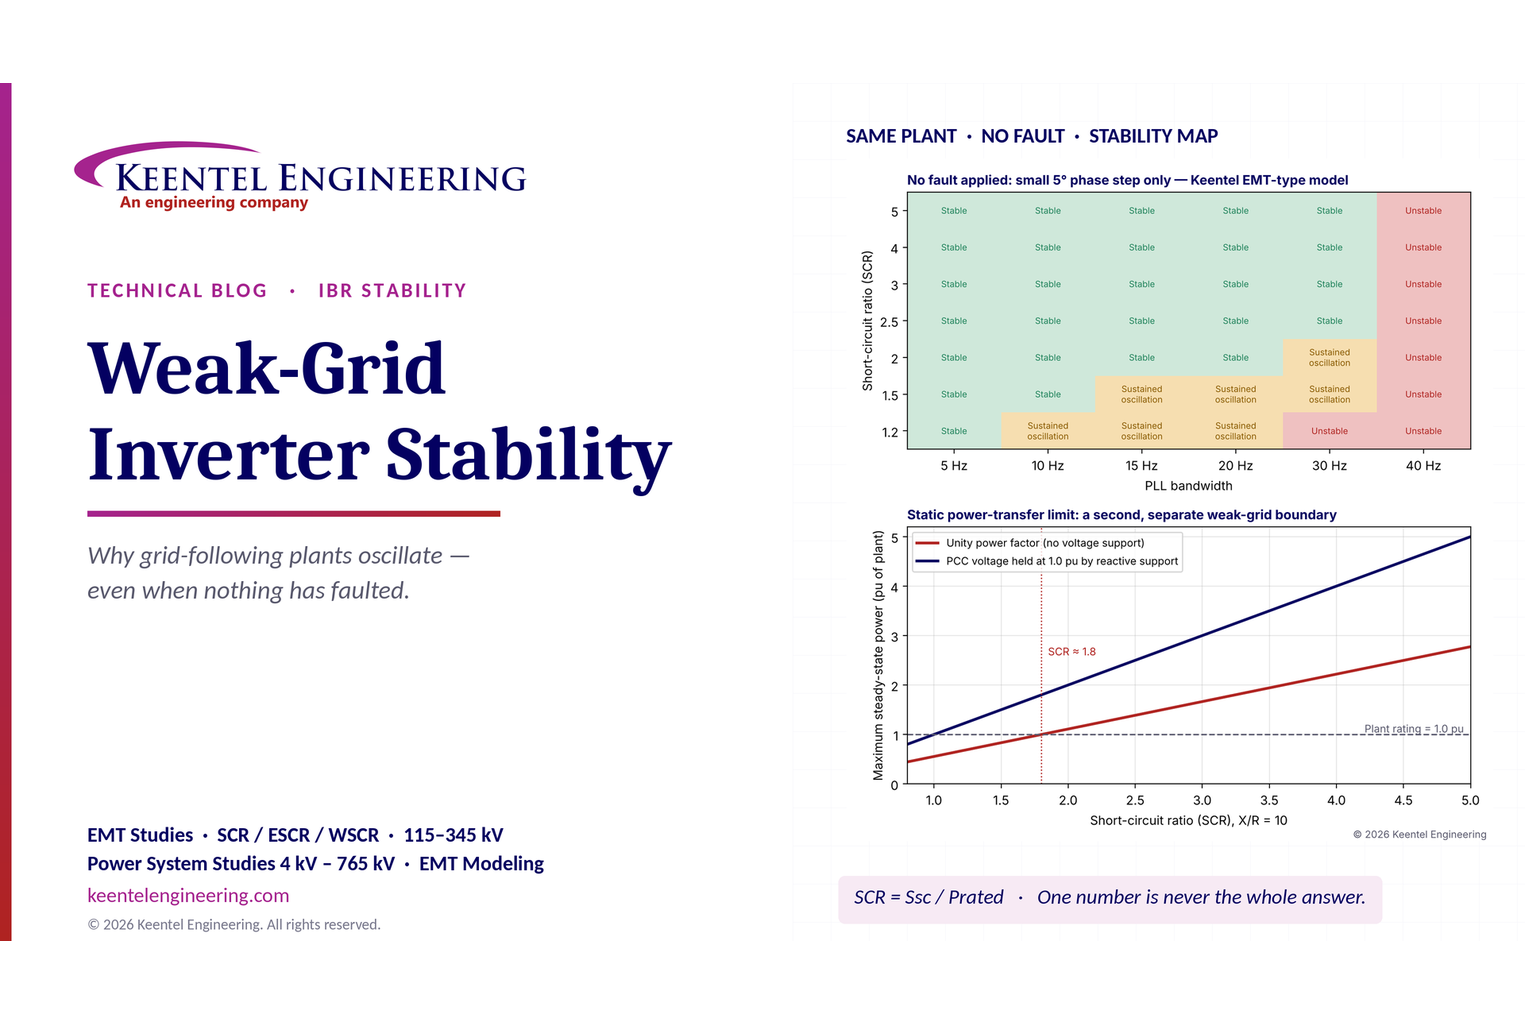
Learn why grid-following inverters become unstable without grid faults. Explore SCR, PLL interactions, EMT studies, grid strength, and mitigation.
By SANDIP R PATEL
•
October 21, 2026
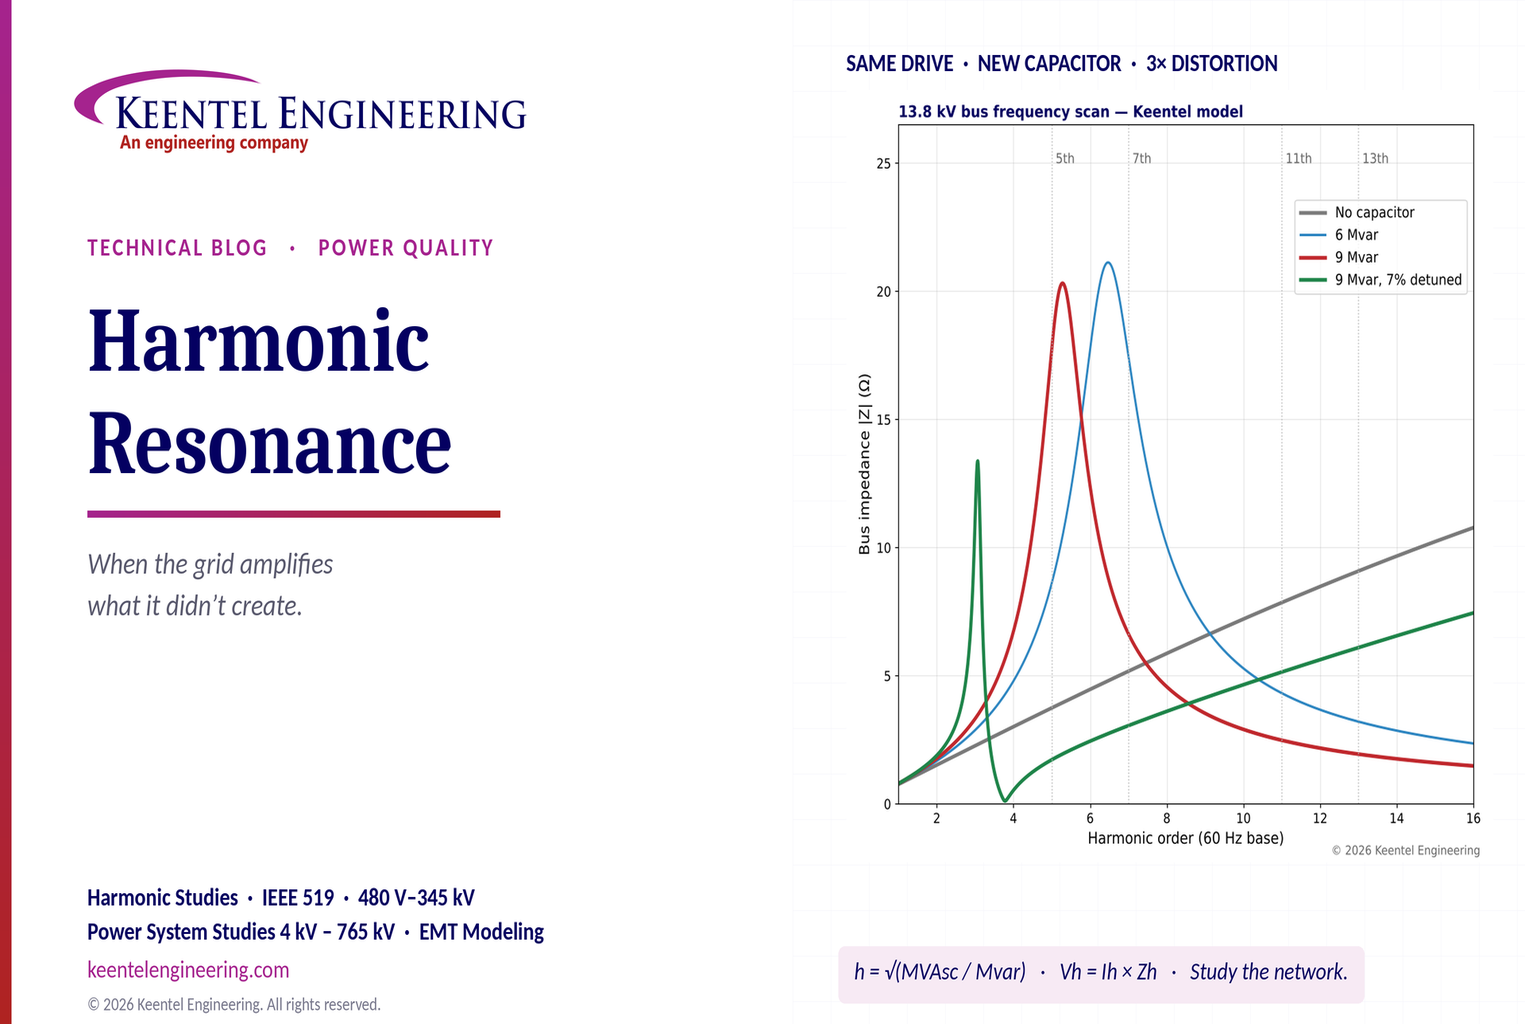
Learn how harmonic resonance amplifies distortion in power systems. Explore capacitor banks, detuned reactors, frequency scans, and IEEE 519 solutions.
By SANDIP R PATEL
•
October 20, 2026
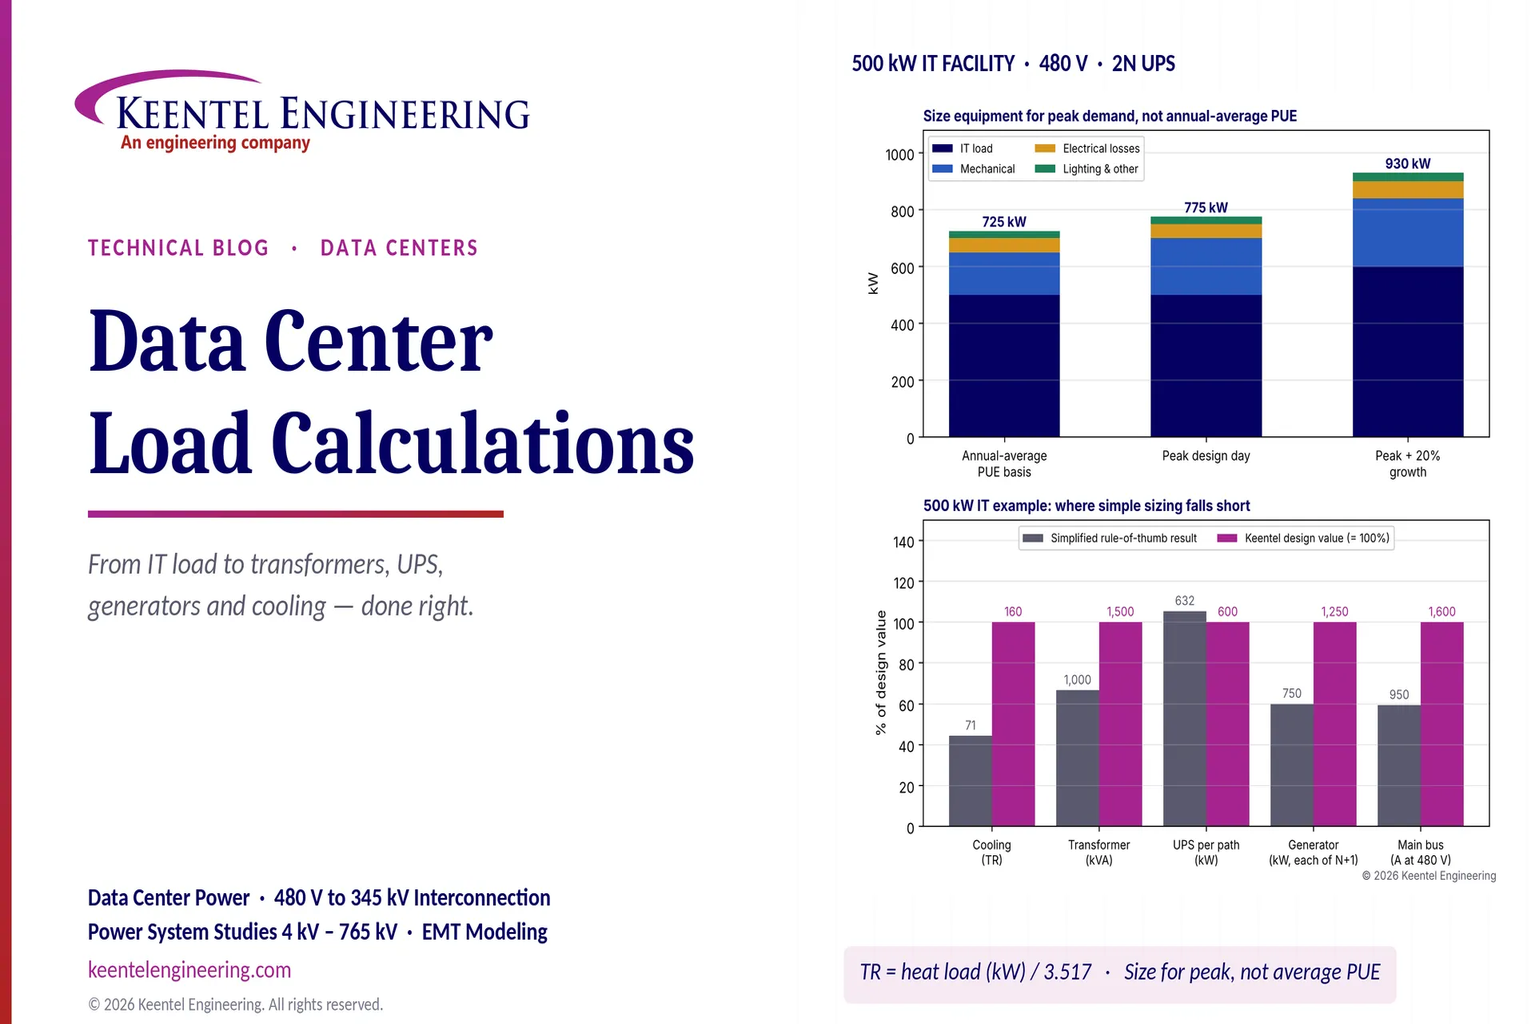
Learn data center electrical load calculations, including IT demand, PUE, UPS and generator sizing, cooling loads, redundancy, and worked US examples.
By SANDIP R PATEL
•
October 20, 2026
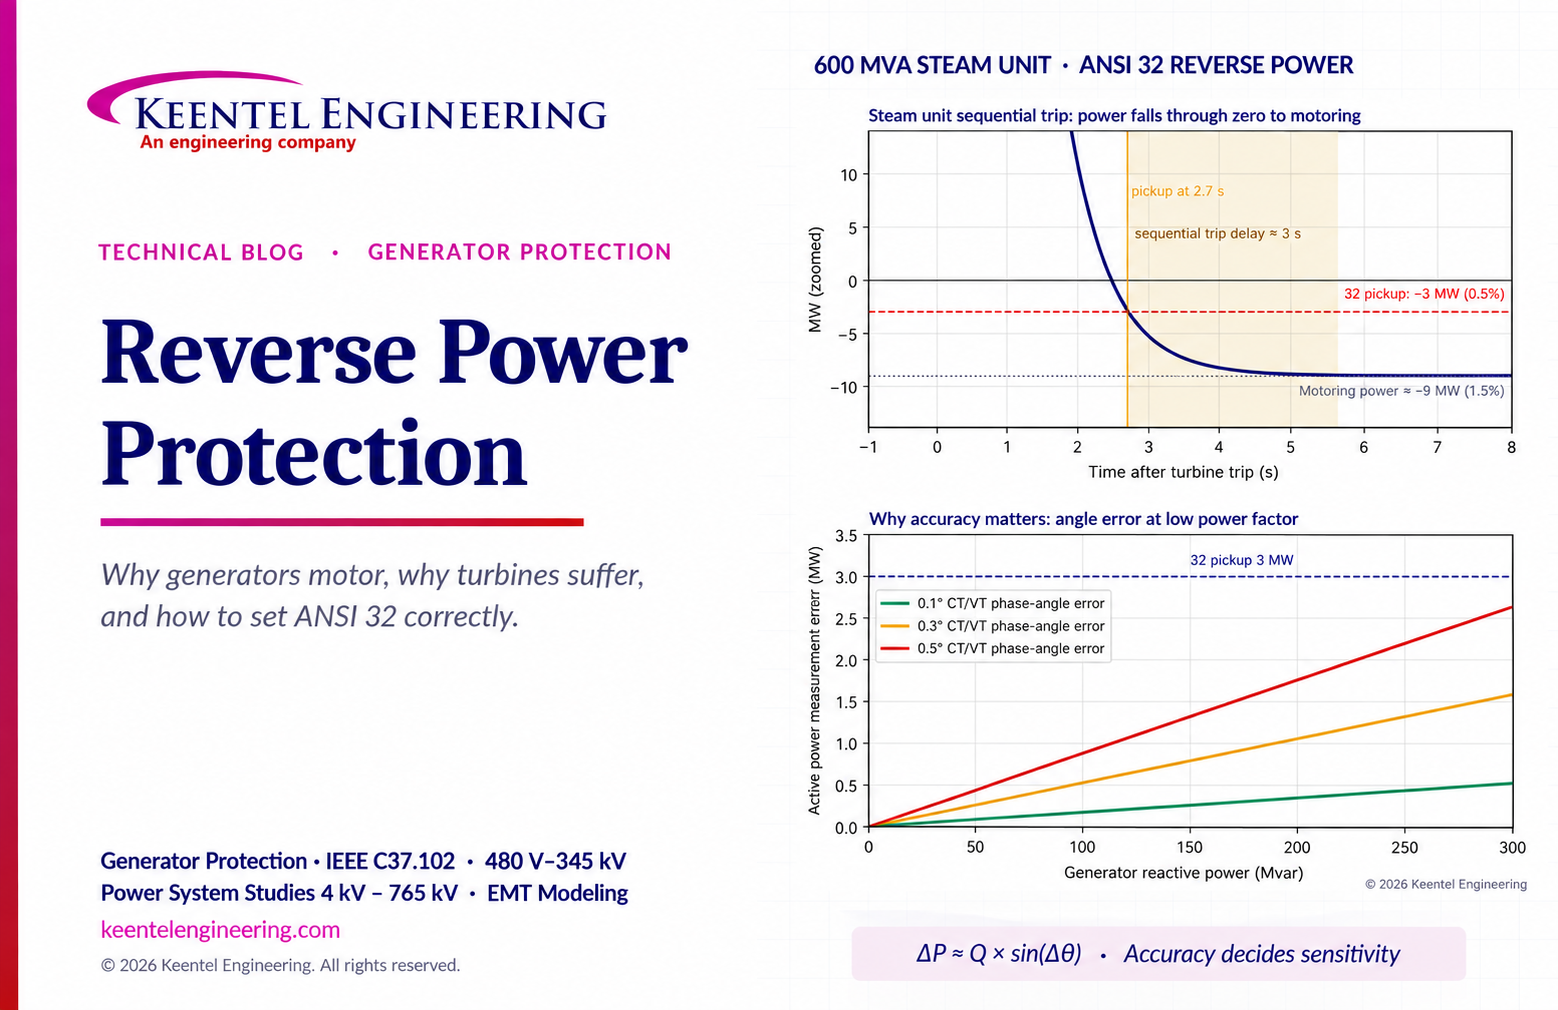
Learn reverse power protection (ANSI 32), generator motoring, relay pickup settings, time delays, sequential tripping and testing for US power plants.
By Team 2 Dexora
•
October 20, 2026
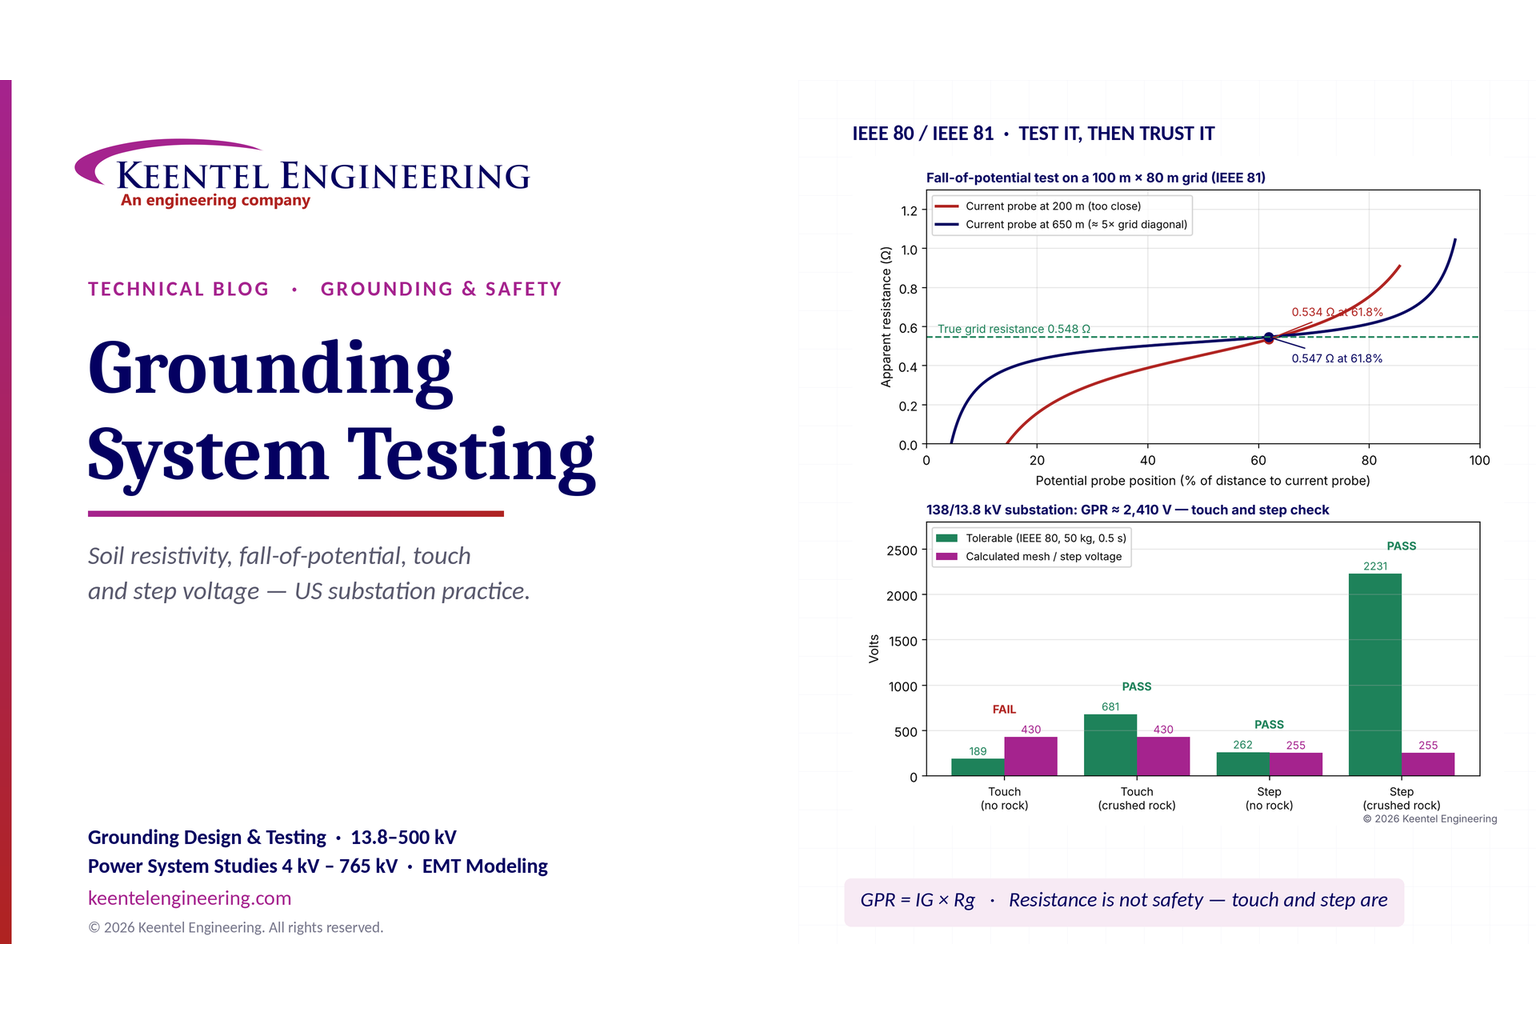
Explore grounding system testing with Keentel Engineering. Learn IEEE 80/81 methods, soil resistivity, ground resistance, and touch and step voltage safety.
By SANDIP R PATEL
•
October 13, 2026
Plan data center capacity with land screening, MW-per-acre estimates, grid power availability and interconnection feasibility studies from Keentel Engineering.
By SANDIP R PATEL
•
October 11, 2026
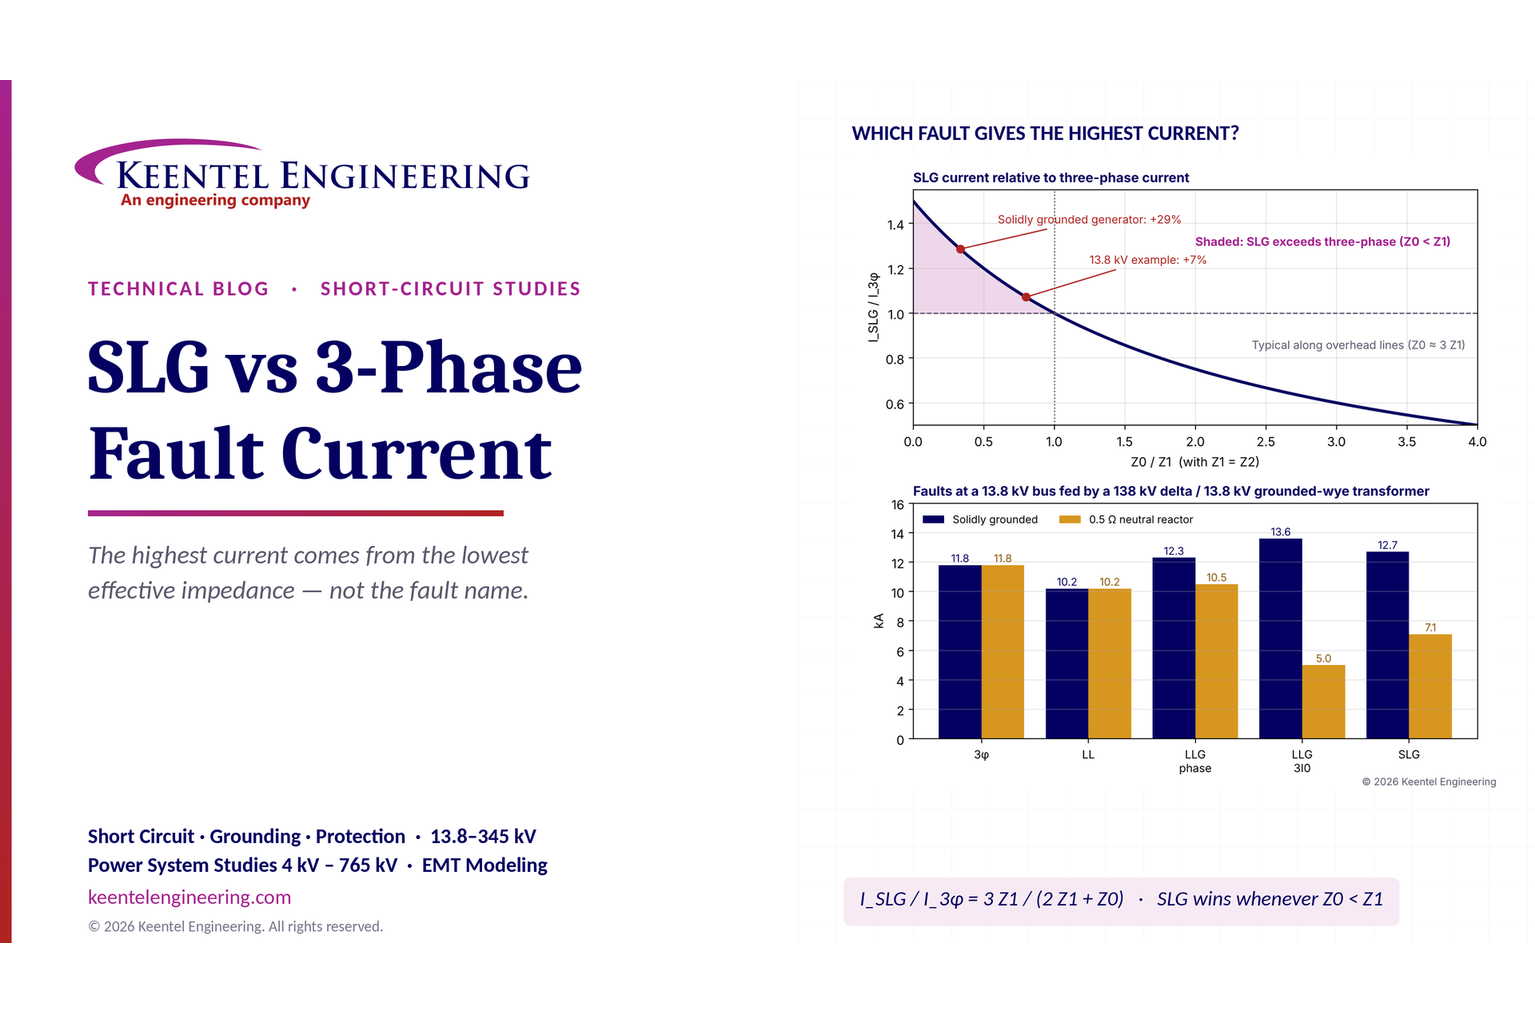
Learn which fault produces the highest current at a bus, why SLG faults can exceed three-phase faults, and how symmetrical components determine fault duty.