A Coordinated Electric System Interconnection Review—the utility’s deep-dive on technical and cost impacts of your project.
Challenge: Frequent false tripping using conventional electromechanical relays
Solution: SEL-487E integration with multi-terminal differential protection and dynamic inrush restraint
Result: 90% reduction in false trips, saving over $250,000 in downtime
The three operating regions you have to design to
| Device | Output vs voltage | Response | Best suited to | Main limitations |
|---|---|---|---|---|
| Mechanically switched capacitor or reactor | Proportional to voltage squared | Seconds; discrete steps; limited switching operations per day | Steady-state reactive supply, voltage profile, loss reduction | No dynamic capability; step voltage change on switching; capability collapses when most needed |
| Static var compensator | Capacitive branches proportional to voltage squared | A few cycles; continuously controllable | Continuous control where cost matters and deep voltage support is not the driver | Square-law capability loss; harmonic filters are part of the plant and interact with the network |
| STATCOM | Approximately proportional to voltage — constant current capability | One to two cycles closed loop; converter response faster still | Voltage stability margin, weak interconnections, fast disturbance recovery, flicker and unbalance compensation | Higher capital cost; converter losses; adds a converter and its control dynamics to the network |
| Synchronous condenser | Governed by machine capability and excitation | Excitation response in the hundreds of milliseconds; inherent inertial response instantaneous | System strength and inertia, short-circuit contribution, black start support | Rotating plant with maintenance and losses; slower controlled response than a converter |
| STATCOM with energy storage | Reactive as a STATCOM, plus real power within the storage rating | As STATCOM for reactive; real power limited by storage | Where a real power deficiency is part of the problem | Cost and complexity of the storage; different failure and maintenance profile |
| Stage | Keentel scope | Outcome |
|---|---|---|
| Screening | Series-compensation proximity, radial contingency review, UIF and short-circuit ratio screening, frequency scans | Early identification of which SSO types apply |
| Detailed studies | PSCAD/EMTDC EMT studies with vendor real-code models, impedance-based and frequency-scan analysis | Clear evidence of stability margins or risk |
| Model quality | EMT model review, benchmarking against positive-sequence models, model acceptance support | Models that system operators accept |
| Mitigation | Control retuning recommendations with vendors, SSDC and bypass logic requirements, protection and monitoring specifications | Practical, coordinated solutions |
| Interconnection support | SSR and SSO study reports for ISO and utility requirements, response to reviewer comments | Fewer delays in the interconnection process |
Resilience: designing CDUs to the facility Tier objective
Liquid cooling makes heat removal more critical, not less. Cold plates hold only seconds of thermal buffer. If TCS flow stops, processors throttle or shut down very quickly. Resilience design must therefore cover:
- Pump redundancy: N+1 pumps at minimum, with automatic changeover.
- CDU redundancy: N+1 CDUs on a common TCS header, or 2N CDUs serving A and B manifolds for fault-tolerant designs.
- Power to CDUs: dual-corded CDUs fed from A and B sources, with pumps and controls on UPS power so coolant keeps flowing through a utility failure and generator start. This is the liquid-cooling equivalent of continuous cooling.
- Facility water continuity: chilled water or condenser water must also continue, through thermal storage, UPS-backed pumps or a high enough FWS temperature that the TCS can coast on stored thermal mass for the transfer period.
- Concurrent maintainability: isolation valves so any CDU, pump, filter or manifold section can be serviced without stopping the others.
- Leak management: leak detection, drip trays, automatic isolation valves and procedures for fluid spills.
Electrical engineering considerations
CDUs and liquid-cooling plants are electrical loads with their own design requirements:
- Pump motors and VFDs. Large CDUs use variable-frequency drives on their pump motors. These introduce harmonic current that must be included in the facility's harmonic study and IEEE 519 evaluation.
- Critical mechanical load on UPS. Putting CDU pumps on UPS increases UPS and battery sizing. The mechanical UPS load must be included in redundancy and ride-through calculations.
- Feeder and protection design. Dual feeds, automatic transfer, selective coordination and arc-flash labelling apply to CDU power distribution just as they do to IT power.
- Generator transient response. CDU pumps restarting together after a transfer create motor inrush on the generators. Staged restarts and soft acceleration reduce the step load.
- Load dynamics. AI training loads can swing rapidly between high and low power. Cooling controls must track those swings without temperature overshoot, and electrical systems must handle both the IT and the cooling load changes.
Commissioning a liquid-cooled data hall
- Flush and clean the TCS piping and manifolds to the specified cleanliness, using high-purity flush water.
- Fill and vent with the specified coolant, verifying glycol concentration and chemistry.
- Pressure test for leaks at design and test pressures, including quick-disconnect fittings.
- Verify sensors and controls: flow meters, temperature sensors, pressure transmitters, leak detection and BMS points.
- Load test with heat load banks connected through the cold-plate interfaces or rack manifolds, across the operating range.
- Prove the heat balance on both loops at several load steps, and the approach temperature against the design.
- Test failure scenarios: pump failure, CDU failure, power transfer to generator, valve failure and loss of facility water, confirming temperatures stay within the IT vendor's limits.
How Keentel Engineering helps
Keentel Engineering supports data center owners, developers and EPCs with the electrical engineering that liquid-cooled facilities depend on, and coordinates with the mechanical engineer of record and cooling vendors on the integrated design.
Data Center Electrical Load Calculations: US Engineering Guide
October 20, 2026 | Blog
Part A — Data Center Electrical Load Calculation at a Glance
Every data center begins with a number: the IT load. Everything else — the utility service, the substation, transformers, switchgear, UPS systems, generators, cooling plant, cables and protection — is sized from that number and the assumptions layered on top of it. Get the load calculation right and the facility delivers its rated capacity reliably for decades. Get it wrong and the owner either strands capital in oversized equipment or, worse, discovers on the first hot day at full load that a generator, transformer or chiller cannot carry the facility.
A sound load calculation answers four questions:
- How much power do the IT systems need, now and at full build-out?
- How much power do the facility systems need to support them — cooling, electrical losses, lighting, life safety and building services — at the worst operating condition, not the average?
- How is that power delivered through redundant paths (N+1, 2N, distributed redundant or block redundant) so that every component can carry its share when another is out of service?
- What do those loads mean for each piece of equipment — kVA, kW, amperes, tons of refrigeration, fault current and harmonics?
The typical power architecture in US practice
| Level | Typical US configuration |
|---|---|
| Utility supply | 12.47 kV, 13.8 kV, 24.9 kV or 34.5 kV distribution service for smaller sites; 69 kV, 115 kV, 138 kV, 230 kV or 345 kV transmission service with an on-site substation for large campuses |
| Medium-voltage distribution | 13.8 kV or 34.5 kV switchgear, often in a tie-main-tie or ring arrangement |
| Unit substations | Medium voltage stepped down to 480Y/277 V (or 415Y/240 V for some IT distribution) |
| UPS systems | A-path and B-path UPS, typically at 480 V, with static and maintenance bypass |
| IT distribution | PDUs, remote power panels, busway and rack PDUs at 415Y/240 V or 208Y/120 V |
| Standby power | Diesel or natural gas generators at 480 V or 13.8 kV through ATS or paralleling switchgear |
| Mechanical power | Chillers, cooling towers or dry coolers, CRAH/CRAC units, pumps and fans from mechanical switchboards |
| Other critical loads | Lighting, fire alarm and suppression, security, access control, BMS and EPMS |
| Optional on-site resources | Solar PV, battery energy storage and, increasingly, on-site generation for bridging or islanding |
The core relationships
- IT load: PIT = ΣPi, the sum of rack and equipment loads at their design (not nameplate) power.
- Facility power from PUE: Pfacility = PIT × PUE — useful for energy estimates, but not sufficient for equipment sizing.
- Three-phase current: I = P × 1000 ÷ (√3 × VLL × PF).
- Apparent power: S = P ÷ PF.
- Cooling load in tons of refrigeration: heat rejected (kW) ÷ 3.517.
Five corrections every load calculation needs
| Common simplification | Engineering reality |
|---|---|
| Size equipment from annual-average PUE | Size from the peak design-day load; mechanical demand at design ambient is well above the annual average |
| Cooling tons equal facility power minus IT power | Cooling must remove the heat produced by the IT load plus losses and other loads in the space — not the cooling system's own electrical consumption |
| One transformer, UPS or generator at the total load | In 2N or block-redundant designs, each path or block must carry its full share with another out of service |
| Generator kVA = facility kW ÷ 0.8 | Generators must also handle motor starting, UPS rectifier harmonics, altitude and temperature derating, and the correct duty rating |
| Add a 20% growth factor at the end | Growth, diversity, rack densification and future AI loads must be planned per system, with explicit assumptions |
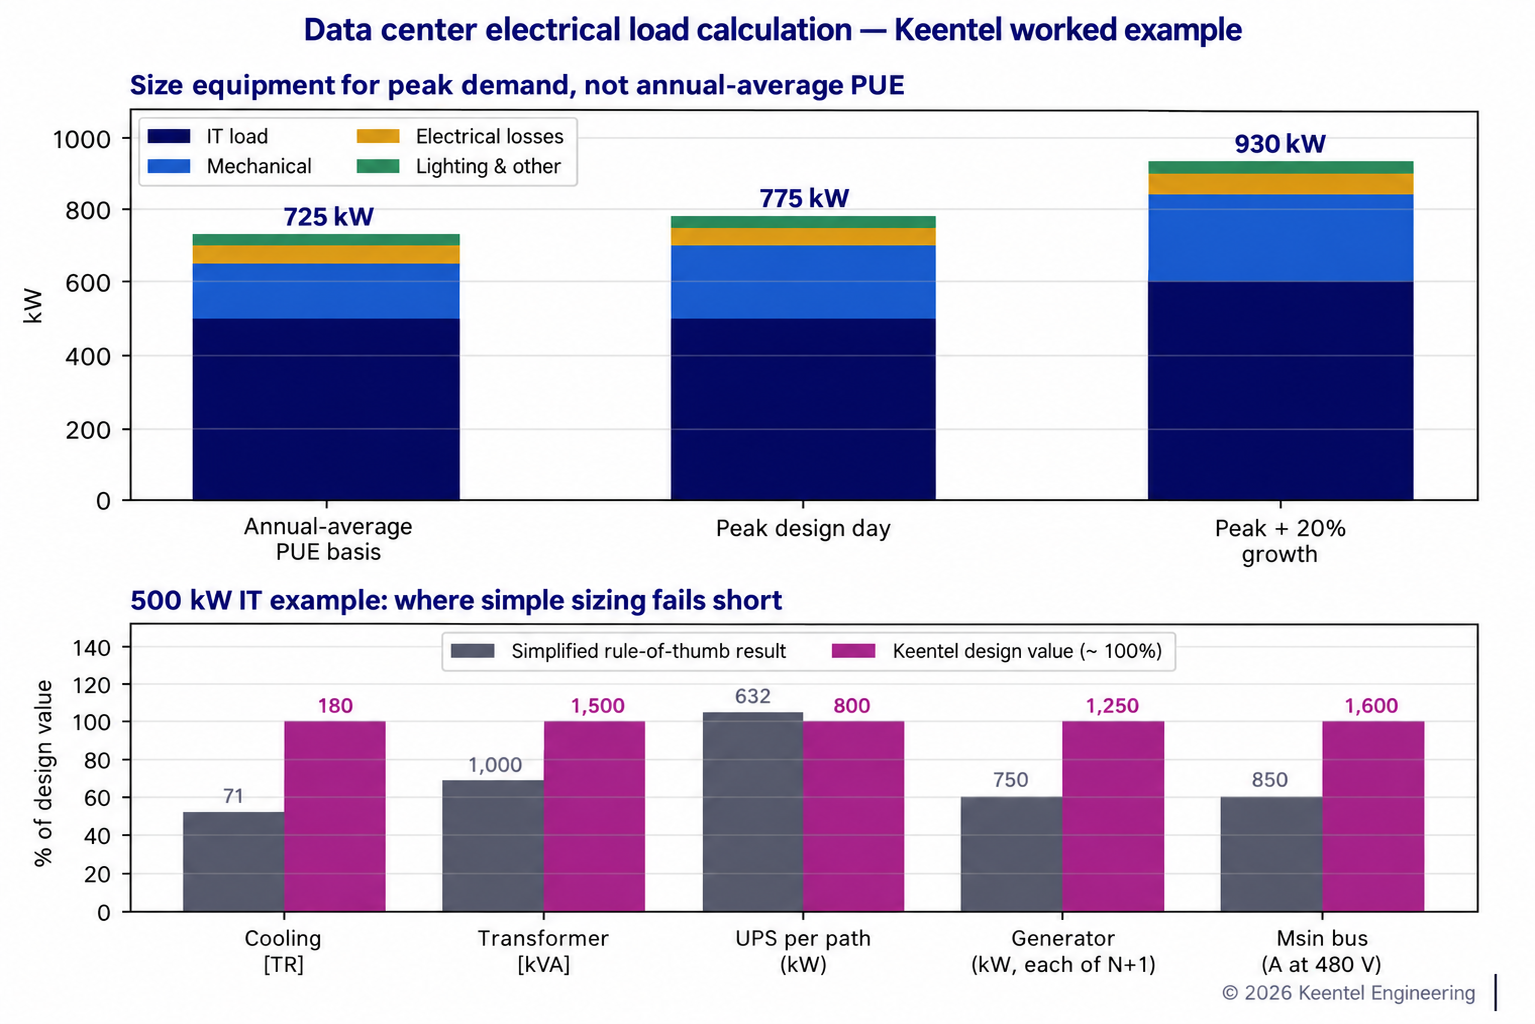
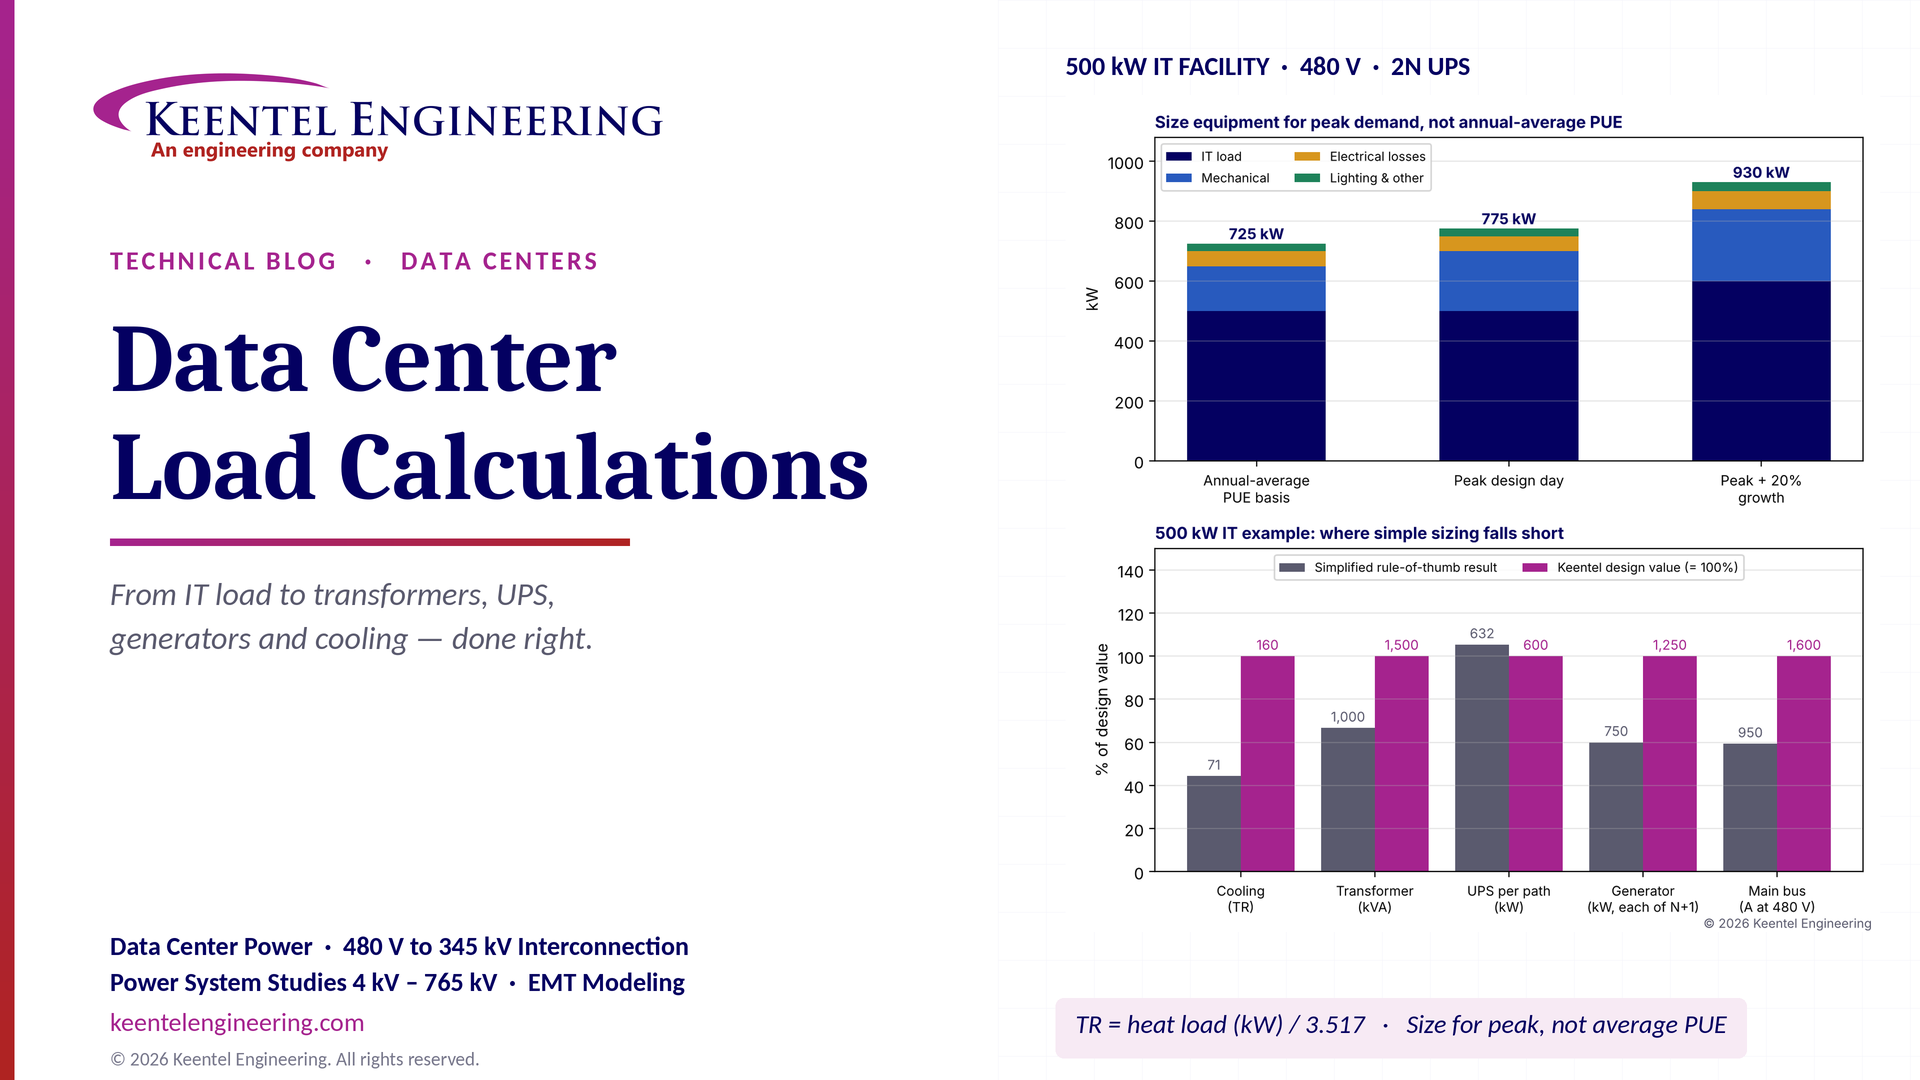
Figure 1. Top: the same 500 kW IT facility gives 725 kW on an annual-average PUE basis, 775 kW on the peak design day, and 930 kW with 20% growth. Bottom: equipment sizes from simple rules of thumb compared with Keentel's design values for the same facility.
Accurate load calculations ensure reliable, efficient and safe operation — but only if they are based on peak conditions, the redundancy topology and the real behavior of each piece of equipment.
Part B — Data Center Electrical Load Calculations: An Engineering Guide for US Facilities
1. Why load calculations decide data center success
The data center market in the US has moved from multi-megawatt enterprise facilities to hyperscale and AI campuses measured in hundreds of megawatts. A single AI training building can require more power than a small city, and utilities across Texas, Virginia, Georgia, Arizona, Ohio and the Midwest are managing interconnection queues full of large-load requests. In that environment, the electrical load calculation is not a formality. It drives:
- The utility service request: the demand and ramp schedule submitted to the utility or transmission provider.
- The capital plan: the number and rating of transformers, switchgear lineups, UPS modules and generators.
- The redundancy design: how many components can fail or be maintained without dropping load.
- Power quality and protection: fault currents, harmonics and coordination.
- Energy and operating cost: losses, PUE and demand charges.
- Schedule: long-lead equipment large transformers, medium-voltage switchgear and generators must be ordered early, based on the load calculation.
An undersized design fails visibly. An oversized design fails quietly: equipment runs at light load with poor efficiency, capital is stranded and the facility's PUE suffers. The goal is the right size, with explicit margins.
2. Defining IT load correctly
2.1 Nameplate, measured and design load
| Quantity | Description | Use |
|---|---|---|
| Nameplate (power supply ratings) | Maximum rating of server power supplies | Not used for sizing; typically far above actual demand |
| Measured or vendor-estimated peak | Actual power at maximum workload, from vendor calculators or measurement | Basis for rack design power |
| Rack design power | Power allocated per rack (for example, 8 kW, 17 kW, 40 kW or 130 kW for liquid-cooled AI racks) | Basis for PDU, busway and cooling design |
| Critical IT capacity | The total IT load the facility is designed and sold to support | Basis for UPS and facility design |
Rack densities have increased dramatically. Traditional enterprise racks were 5 to 10 kW; general-purpose cloud racks are commonly 10 to 20 kW; and liquid-cooled AI training racks now range from about 40 kW to more than 130 kW per rack. Higher density concentrates load on fewer distribution paths and shifts cooling from air to liquid, changing both electrical and mechanical load profiles.
2.2 IT load summation
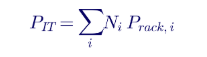
where Ni is the number of racks of type i and Prack,i is their design power. Diversity between racks is applied cautiously: in cloud and AI facilities, workloads can drive many racks to peak simultaneously, so the critical IT capacity is usually taken without diversity at the UPS level.
2.3 AI load dynamics
AI training clusters introduce rapid, synchronized power swings. Thousands of GPUs can change power within milliseconds as training steps start and stop, producing load fluctuations of a large fraction of the cluster's rating. These swings affect UPS behavior, generator governors in island mode, and at campus scale the utility grid. Load calculations for AI facilities must therefore include not only steady-state demand but also the magnitude and rate of load changes.
3. PUE: useful, but not a sizing tool
3.1 Definition
Power usage effectiveness, as defined by The Green Grid and in ISO/IEC 30134-2, is an annual energy ratio:

where E is energy over a year, not instantaneous power. A facility with a PUE of 1.5 uses, on average over a year, 0.5 kWh of facility overhead for every kWh delivered to IT equipment.
3.2 Why annual PUE underestimates peak demand
Mechanical power varies with outdoor conditions. On the design day the hottest, most humid day used for equipment selection, typically based on ASHRAE climatic design data chillers and heat rejection equipment work hardest, and economizers are unavailable. Peak mechanical demand can be 30% to 60% higher than the annual average. Equipment must be sized for the peak:

In the 500 kW example in this guide, annual-average mechanical power is 150 kW, but peak design-day mechanical power is about 200 kW, raising facility demand from 725 kW to 775 kW. A design based on the average would be undersized on the day it matters most.
3.3 Partial load matters too
Data centers rarely operate at their full critical capacity for the first several years. At 25% or 50% of IT capacity, fixed losses transformer no-load losses, UPS losses at light load, minimum airflow and pump power make the PUE worse. Phased build-outs and modular equipment help keep efficiency reasonable as the load grows.
4. The facility load breakdown
4.1 Load categories
| Category | Examples | Typical share of facility peak |
|---|---|---|
| IT equipment | Servers, storage, network | 60% to 85% |
| Mechanical | Chillers, cooling towers, dry coolers, CRAH/CRAC, CDUs, pumps, fans, humidification | 10% to 35% |
| Electrical losses | Transformers, UPS, PDUs, cables, busway | 3% to 10% |
| Lighting and building | Lighting, offices, receptacles, elevators | 1% to 3% |
| Life safety and security | Fire alarm, suppression, access control, security systems | Under 1% |
| Controls and monitoring | BMS, EPMS, DCIM | Under 1% |
4.2 Fact-check: does the breakdown add up?
A common illustrative breakdown lists IT equipment at 500 kW, cooling at 150 kW, electrical losses at 50 kW and lighting and other at 25 kW, and reports a total of 750 kW with percentages of 66.7%, 20%, 6.7% and 3.3%. Those components actually sum to 725 kW, and the percentages then sum to only 96.7%. The correct total for those components is 725 kW, giving an annual PUE of 1.45, not 1.5. Small inconsistencies like this matter, because every downstream size inherits them. Keentel's practice is to reconcile every load table, document the source of every value and carry the assumptions explicitly.
4.3 Electrical losses
Electrical losses come from every conversion and conductor between the utility and the server
| Component | Typical efficiency or loss |
|---|---|
| Medium-voltage transformer (DOE 2016 efficiency levels, near 50% load) | About 98.9% to 99.5% efficient |
| Double-conversion UPS | About 94% to 97% efficient; eco-mode up to about 99% |
| PDU transformer (where used) | About 97% to 98.5% efficient |
| Cables and busway | About 0.5% to 2% loss |
Losses must be included both as electrical load and as heat that the cooling system must remove.
5. Key formulas
5.1 Three-phase current
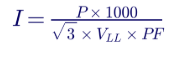
where P is in kW, VLL is line-to-line voltage in volts and PF is the power factor.
5.2 Apparent power
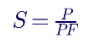
5.3 Cooling load
The cooling system removes heat. In steady state, nearly all electrical energy delivered to the IT equipment, plus losses and lighting within the conditioned space, becomes heat:

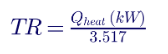
One ton of refrigeration equals 12,000 Btu/h, or 3.517 kW of heat removal.
5.4 Fact-check: cooling tons
A frequent error is to compute cooling capacity from the difference between facility power and IT power for example, (750 − 500) kW = 250 kW, or 71 tons. That number is the electrical overhead, not the heat load. The cooling plant must remove the heat produced by the IT equipment itself, plus losses and other loads in the space. For the 500 kW example, the heat load is about 500 + 50 + 10 ≈ 560 kW, or about 160 tons more than twice the erroneous figure. A cooling plant sized at 71 tons would fail almost immediately.
5.5 Mechanical electrical demand
The electrical power drawn by the cooling system depends on its efficiency:

Total plant efficiency, including chillers, pumps, towers and air handlers, typically ranges from about 0.6 kW/TR for efficient water-cooled plants to 1.2 kW/TR or more for air-cooled systems on a hot day. Free cooling and liquid cooling with warm water can reduce annual mechanical energy dramatically, but design-day peak still governs sizing.
6. Redundancy topologies and their effect on sizing
6.1 Definitions
| Topology | Description | Sizing implication |
|---|---|---|
| N | Exactly enough capacity for the load | No redundancy |
| N+1 | One extra component beyond the need | Each component sized so N units carry the load |
| 2N | Two complete, independent systems (A and B), each able to carry the full load | Each path sized for 100% of critical load; normal loading below 50% |
| 2(N+1) | Two independent systems, each with N+1 redundancy | Highest availability and cost |
| Distributed redundant (for example, 4-to-make-3) | Several blocks share load; any one block can fail and the rest carry its load | Each block normally loaded to about 75% of its rating |
| Block redundant (catcher) | A reserve block picks up any failed block through static transfer switches | Reserve block sized for the largest block |
The Uptime Institute Tier Standard, TIA-942 and BICSI 002 describe how these topologies relate to concurrent maintainability and fault tolerance.
6.2 What redundancy does to equipment ratings
In a 2N design for a 500 kW critical load, each UPS path is sized for the full 500 kW plus growth. In normal operation each path carries only half the load. In a 4-to-make-3 distributed redundant design for a 6 MW critical load, each of four 2 MW blocks carries 1.5 MW normally and 2 MW when another block is out of service. The load calculation must state which condition each component is sized for.
7. Worked example A: 500 kW IT facility at 480 V
7.1 Design basis
| Item | Value |
|---|---|
| Critical IT load | 500 kW |
| Growth allowance | 20% on IT and associated loads |
| Annual-average mechanical power | 150 kW |
| Peak design-day mechanical power | 200 kW |
| Electrical losses | 50 kW |
| Lighting and other | 25 kW |
| Utility service | 13.8 kV, stepped down to 480Y/277 V |
| UPS topology | 2N (A and B paths) |
| Generator topology | N+1 |
| Facility power factor at the main bus | 0.95 |
7.2 Facility demand
| Case | IT | Mechanical | Losses | Other | Total |
|---|---|---|---|---|---|
| Annual average | 500 | 150 | 50 | 25 | 725 kW |
| Peak design day | 500 | 200 | 50 | 25 | 775 kW |
| Peak with 20% growth | 600 | 240 | 60 | 30 | 930 kW |
The annual PUE is 725 ÷ 500 = 1.45; the peak design-day ratio is 1.55.
7.3 Main bus current at 480 V

NEC Article 215 and 230 requirements for continuous loads require conductors and standard-rated overcurrent devices to be sized at 125% of continuous load (or the device to be 100% rated). 1,178 A × 1.25 = 1,472 A, so a 1,600 A main is selected. At the 400 V used in many international designs, the same load would draw about 1,413 A one reason US designs at 480 V use smaller conductors for the same power.
7.4 Transformer
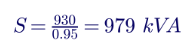
Selecting a transformer at roughly 80% loading at design peak gives 979 ÷ 0.8 ≈ 1,224 kVA, so a 1,500 kVA, 13.8 kV to 480Y/277 V unit is selected. In a 2N utility-transformer design, two such transformers are provided, each able to carry the whole facility. A design with a single 1,000 kVA transformer the result of the simple rule would run at 98% of rating at peak with no growth margin and no redundancy.
7.5 UPS
Each UPS path carries the full critical load plus growth:

Modern data center UPS units are rated at unity power factor (kVA = kW), so 600 kVA per path is sufficient. The common formula 500 × 1.2 ÷ 0.95 ≈ 632 kVA assumes a 0.95 output rating that no longer reflects typical equipment; it slightly oversizes the UPS, but more importantly it hides the real decision whether each path is sized for the full load (2N) or whether modules are added in an N+1 configuration. Battery or energy storage autonomy is calculated separately, typically 5 to 15 minutes at full load for lithium-ion or VRLA systems bridging to generators.
7.6 Generators
Generators must supply the whole facility during a utility outage, including mechanical load, UPS recharge and all support loads:
- Running load: 930 kW at design peak with growth.
- UPS battery recharge: adds typically 10% to 20% of UPS rating for a period after the outage.
- Motor starting: chillers and pumps restarting after a utility outage create large inrush, often staggered by controls.
- Non-linear load: UPS rectifiers draw harmonic current that heats generator windings and can disturb voltage regulators.
- Derating: generator output falls at high altitude and high ambient temperature.
A practical selection is two 1,250 kW generators in an N+1 configuration, each able to carry the full facility load alone, rated for data center continuous duty (a rating recognized by many manufacturers for data center applications, distinct from emergency standby). The rule "750 kW ÷ 0.8 = 938 kVA" gives one generator at the average load, with no redundancy and no margin for recharge, motor starting or growth.
7.7 Cooling
Heat load with growth: 600 + 60 + 12 ≈ 672 kW, or about 191 tons. Without growth, about 160 tons. An N+1 chiller plant might use three 100-ton chillers (two duty, one standby) for the growth case.
7.8 Summary
| Equipment | Simplified result | Keentel design value |
|---|---|---|
| Facility demand | 750 kW (with an arithmetic error) | 775 kW peak; 930 kW with growth |
| Transformer | 1,000 kVA | 2 × 1,500 kVA (2N) or 1 × 1,500 kVA (N) |
| UPS | 632 kVA plus N+1 | 600 kW per path, 2N |
| Generator | 938 kVA | 2 × 1,250 kW, N+1 |
| Cooling | 71 TR | 160 TR now; about 190 TR with growth |
| Main bus current | 1,140 A at 400 V | 1,178 A at 480 V; 1,600 A main |
8. Worked example B: 20 MW IT hall on a 138 kV campus
8.1 Design basis
| Item | Value |
|---|---|
| Critical IT load | 20 MW |
| Topology | Distributed redundant, 4-to-make-3 blocks |
| Peak design-day PUE (ratio) | 1.35 (liquid-cooled IT with air-cooled support spaces) |
| Growth allowance | 15% |
| Utility service | 138 kV, on-site substation to 34.5 kV |
| Building distribution | 34.5 kV to 480Y/277 V unit substations |
8.2 Facility peak demand

Each block contains UPS and distribution rated about 7.7 MW critical, normally loaded at about 5.75 MW (75%).
8.4 Substation transformers
Two 138/34.5 kV transformers in a 2N arrangement, each able to carry the full 31.1 MW at 0.95 power factor (32.7 MVA), are typically selected at a standard rating such as 33/44/55 MVA (ONAN/ONAF/ONAF) so the base rating covers normal load and the forced-air rating covers contingency and growth. The interconnection request to the utility states the 31 MW demand, the ramp schedule and the facility's ride-through and power quality characteristics.
8.5 Generators
At 2.5 MW (data center continuous rating) each, 31.1 MW requires 13 units; N+1 gives 14 generators, typically connected through 13.8 kV or 34.5 kV paralleling switchgear or distributed per block at 480 V. Medium-voltage generator plants reduce cable quantities but require medium-voltage paralleling and protection design.
8.6 Utility-scale considerations
At this scale, the utility will typically require:
- Load interconnection studies: load flow, short circuit and, increasingly, dynamic studies of the facility's response to transmission faults.
- Ride-through characteristics: large data center loads have dropped offline during transmission faults, and NERC has issued alerts and guidance on large-load behavior. Utilities increasingly specify voltage and frequency ride-through expectations for large loads.
- Power quality limits: harmonic emission at the point of common coupling under IEEE 519.
- Ramp rates and load fluctuation limits: especially for AI training loads.
9. Medium-voltage and low-voltage voltage selection
| Voltage | Typical use in US data centers | Considerations |
|---|---|---|
| 480Y/277 V | UPS input and output, mechanical loads, distribution | Standard for US facilities; NEC 240.87 arc energy reduction requirements for breakers 1,200 A and above |
| 415Y/240 V | IT distribution to racks | Reduces transformation steps; 240 V phase-to-neutral suits server power supplies |
| 208Y/120 V | Legacy IT and small loads | Higher current per kW; declining in new designs |
| 13.8 kV | Building medium-voltage distribution, generator plants | Common for campus and building distribution |
| 34.5 kV | Campus distribution for large sites | Fewer feeders for large loads; larger clearances |
| 69 kV to 345 kV | Utility transmission service | On-site substation; utility interconnection studies required |
Emerging designs also use higher DC voltages (for example 400 V or 800 V DC) to IT racks and medium-voltage solid-state transformers, which change loss and protection calculations.
10. Short circuit, protection and arc flash
Load calculations feed directly into fault and protection studies:
- Short-circuit study: larger transformers and paralleled generators raise fault current. A 1,500 kVA, 5.75% impedance transformer can deliver about 31 kA at 480 V from the utility alone, before adding motor and generator contributions. Switchgear and breaker ratings must exceed the calculated fault current.
- Coordination study: breakers and fuses must be selectively coordinated. NEC 700.32 and 701.32 require selective coordination for emergency and legally required standby systems, and NEC 708 for critical operations power systems where applicable.
- Arc flash study: IEEE 1584-2018 incident energy calculations and NFPA 70E labeling. Data centers frequently use arc energy reduction, such as maintenance switches and zone-selective interlocking, to keep incident energy manageable.
- Ground fault protection: NEC 230.95 requires ground-fault protection of equipment on 480Y/277 V services rated 1,000 A or more.
10.1 Transformer fault current estimate
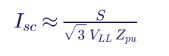
For 1,500 kVA, 480 V and 5.75% impedance, Isc ≈ 1,500,000 ÷ (1.732 × 480 × 0.0575) ≈ 31.4 kA, assuming an infinite source.
11. Power quality
| Issue | Source | Mitigation |
|---|---|---|
| Current harmonics | UPS rectifiers, VFDs, server power supplies | Active front-end UPS, active harmonic filters, IEEE 519 compliance at the PCC |
| Voltage distortion on generator | Harmonic current through generator subtransient reactance | Oversized alternators, low-reactance generators, harmonic mitigation |
| Leading power factor | Modern IT power supplies and UPS input filters at light load | Generator and UPS compatibility checks; generators can become unstable with excessive leading kVAR |
| Voltage sags | Utility faults | UPS ride-through, mechanical system ride-through or restart logic |
| Load steps | AI training cycles, UPS transfers | Generator and UPS dynamic response studies |
The leading power factor issue deserves emphasis. At light load, capacitive input filters on UPS units and IT power supplies can drive the facility to a leading power factor. Generators operating in island mode have limited capability to absorb reactive power; excessive leading kVAR can cause voltage regulator instability or loss of excitation. Generator selection and UPS configuration must be checked for this condition.
12. Cable and voltage drop
Cable sizing follows NEC Article 310 ampacity tables with corrections for ambient temperature and conductor grouping, plus voltage drop limits. NEC informational notes recommend limiting voltage drop to 3% on feeders or branch circuits and 5% overall. For high-current data center feeders:

Busway is common for IT distribution because it simplifies rack additions and has low impedance. Liquid-cooled AI halls with very high rack power often use overhead busway rated 800 A to 1,600 A or more at 415 V.
13. Utility interconnection and large-load requirements
Large US data centers interact with the grid in ways that utilities and regulators now treat seriously:
- Interconnection queues: many utilities have large-load tariffs, study processes and ramp schedules for loads above thresholds such as 75 MW.
- NERC attention: NERC has studied large loads disconnecting during transmission faults and is developing guidance for large-load modeling and ride-through.
- Behind-the-meter generation: on-site gas turbines, reciprocating engines, fuel cells and batteries are increasingly used to bridge until grid capacity is available, adding generation interconnection and air permitting considerations.
- Demand response and flexibility: some campuses participate in demand response or curtailment programs, which require load calculations that identify flexible and inflexible loads.
14. Load calculation workflow
- Define the critical IT capacity, rack densities, phasing and future load.
- Develop the mechanical design at the design-day condition and calculate peak mechanical demand.
- Calculate electrical losses from equipment efficiency curves at the expected loading.
- Add support and life safety loads.
- Reconcile the load table: check sums, units and consistency.
- Apply the redundancy topology to determine the design condition for each component.
- Apply growth and diversity explicitly, system by system.
- Size equipment — transformers, switchgear, UPS, batteries, generators, chillers and cables.
- Run short-circuit, coordination, arc flash, harmonic and voltage drop studies.
- Submit the load profile to the utility with ramp schedule and power quality data.
- Update the calculation as equipment is selected and as the IT plan evolves.
15. Common load calculation mistakes
- Using annual-average PUE to size equipment.
- Calculating cooling tons from electrical overhead instead of heat load.
- Ignoring the redundancy condition, so equipment cannot carry its share during a failure.
- Using nameplate IT power without verification, or applying excessive diversity to AI loads.
- Ignoring generator derating, motor starting and UPS recharge.
- Forgetting NEC 125% continuous-load sizing.
- Not checking leading power factor compatibility of generators and UPS.
- Using international voltages (400 V, 11 kV or 33 kV) in calculations for US facilities.
- Not reconciling tables — percentages that do not add up, or totals that do not match components.
- Not updating the calculation as rack densities change.
16. Codes and standards
| Standard | Scope |
|---|---|
| NFPA 70 (NEC), including Articles 215, 220, 230, 240, 250, 645, 700, 701, 702 and 708 | Electrical installation, load calculations, information technology equipment and standby systems |
| NFPA 75 | Fire protection of information technology equipment |
| NFPA 110 | Emergency and standby power systems |
| NFPA 70E | Electrical safety in the workplace |
| IEEE 3000 Standards Collection (3001 to 3007 series) | Design of industrial and commercial power systems |
| IEEE 446 (historical Orange Book practices) and IEEE 3006 series | Emergency, standby and reliability considerations |
| IEEE 519 | Harmonic control |
| IEEE 1584 | Arc flash calculations |
| ASHRAE 90.4 | Energy standard for data centers |
| ASHRAE TC 9.9 thermal guidelines | Environmental envelopes for IT equipment |
| TIA-942 and BICSI 002 | Data center infrastructure design |
| UL 1778 and UL 9540 | UPS and energy storage system listing |
17. UPS energy storage sizing
The UPS energy storage — VRLA batteries, lithium-ion batteries or flywheels — must carry the critical load from the moment the utility fails until generators are online and stable, with margin for a failed first start.

For the 600 kW UPS path in Example A with 10 minutes of autonomy, 96% inverter efficiency and an 80% end-of-life aging factor:

| Factor | Effect on autonomy |
|---|---|
| Temperature | Low temperature reduces available capacity; high temperature shortens life |
| Discharge rate | Short, high-rate discharges deliver less energy from lead-acid batteries than rated capacity at slower rates |
| Aging | Capacity declines over life; end-of-life sizing preserves autonomy |
| Generator start strategy | Longer autonomy covers a failed start and a second attempt |
| Lithium-ion fire safety | NFPA 855 and UL 9540A requirements affect room design and spacing |
Many modern facilities use 5 to 7 minutes of lithium-ion autonomy, relying on fast, reliable generator starts. Others choose 10 to 15 minutes. The choice is an owner risk decision, but the calculation must be explicit.
18. Generator load steps and transient response
Generators respond to load changes with a temporary frequency and voltage dip. When the utility fails, the UPS systems are already carrying the IT load from batteries, but when the generator breaker closes, the UPS rectifiers, mechanical loads and support loads transfer onto the generator. Good practice:
- Walk in the UPS load: UPS rectifiers ramp their input current over several seconds rather than stepping instantly.
- Stagger mechanical restart: chillers, pumps and fans start in sequence to limit simultaneous inrush.
- Check generator step capability: many diesel generators can accept about 50% to 100% of rating in one step with acceptable dips, while lean-burn natural gas engines may accept only 15% to 30% per step.
- Verify NFPA 110 requirements: for emergency loads, Level 1 systems must restore power within 10 seconds.
For Example A, the largest single step after the generator closes might be the first chiller and its pumps at about 120 kW, plus a portion of UPS recharge. On a 1,250 kW diesel generator, that step is about 10% of rating — comfortably within capability. If natural gas generators were selected for emissions reasons, the same step would need to be checked carefully against the engine's step-load limits.
19. Annual energy and operating cost
Load calculations also support operating cost and sustainability planning. For Example A at an annual-average facility demand of 725 kW:

At an illustrative blended electricity cost of $0.08/kWh, annual energy cost is about $508,000, before demand charges. Every 0.1 improvement in PUE on a 500 kW IT load saves about 438 MWh, or roughly $35,000, per year in this example. For a 20 MW IT campus, the same 0.1 PUE improvement saves about 17,500 MWh and about $1.4 million per year at the same rate.
Demand charges are set by peak demand, often over 15-minute intervals. For data centers, whose load is relatively flat, the annual load factor is high, but the peak design-day demand still sets the demand charge in summer months.
20. Electrical losses as heat: closing the loop
Electrical losses appear twice in a load calculation: once as electrical demand and again as heat the cooling plant must remove. For the 500 kW IT load:
| Loss source | Approximate loss | Where the heat appears |
|---|---|---|
| UPS at 96% efficiency | About 21 kW | UPS room, which needs its own cooling |
| Medium-voltage transformer | About 5 to 8 kW | Outdoor or electrical room |
| PDUs and distribution | About 10 to 15 kW | Data hall or electrical rooms |
| Cables and busway | About 5 kW | Distributed |
UPS rooms are often overlooked in the cooling design. Lithium-ion and VRLA batteries have temperature limits, and UPS losses can raise room temperature quickly if cooling fails. The mechanical and electrical designs must agree on where losses occur and how they are removed.
21. Liquid cooling and its electrical implications
Liquid cooling direct-to-chip cold plates with coolant distribution units (CDUs) or immersion is now standard for high-density AI racks. Electrically, liquid cooling:
- Shifts load from fans to pumps: server fan power falls, while CDU and facility water pump power rises.
- Enables warmer water: facility water at higher temperatures allows more hours of chiller-free operation, reducing annual mechanical energy.
- Creates new critical loads: CDUs and their pumps often require UPS-backed power, because loss of coolant flow can overheat high-density processors within seconds or minutes.
- Changes the PUE breakdown: some cooling energy moves inside the IT boundary (server fans), which can complicate PUE comparisons.
Load calculations for liquid-cooled halls must therefore identify which mechanical loads are critical and must be on UPS, and must size those UPS systems accordingly.
22. Communicating the load to the utility
A utility load application for a large data center typically includes:
| Item | Description |
|---|---|
| Peak demand by phase | MW per building phase and target in-service dates |
| Ramp schedule | Expected demand by month or quarter as IT load is installed |
| Load factor and profile | Expected daily and seasonal profile |
| Power factor and harmonics | Expected power factor range and harmonic emission |
| Ride-through and transfer behavior | How UPS and facility respond to voltage sags and faults |
| Backup generation | Generator capacity and whether it can parallel with the grid |
| Flexibility | Ability to curtail load or shift to on-site generation |
A clear, well-documented load application shortens utility review and builds credibility for later phases.
23. Worked example C: main feeder sizing and voltage drop at 480 V
The 1,600 A main feeder in Example A runs 150 ft from the 1,500 kVA transformer to the main switchboard.
23.1 Ampacity
The design current with the NEC 125% continuous-load factor is 1,472 A. Using four parallel sets of 500 kcmil copper conductors rated at 380 A each at 75°C (NEC Table 310.16), the ampacity is 4 × 380 = 1,520 A, which exceeds 1,472 A. Corrections for ambient temperature above 30°C and for more than three current-carrying conductors in a raceway must also be applied where they occur.
23.2 Voltage drop
Using NEC Chapter 9, Table 9 values for 500 kcmil copper in steel conduit (R ≈ 0.029 Ω and X ≈ 0.048 Ω per 1,000 ft per conductor), with four sets in parallel:

That is about 0.7% of 480 V, well within the recommended 3% feeder limit. The same load at 400 V would draw more current and produce a larger percentage drop on the same conductors.
24. Availability and redundancy: a simple comparison
Redundancy decisions are about availability. A simplified comparison uses component availability A for each path:
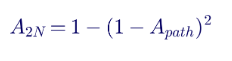
If a single UPS path has an availability of 99.9% (about 8.8 hours of unavailability per year), a 2N arrangement of two independent paths gives an idealized availability of 99.9999% (about 32 seconds per year), assuming independent failures. In practice, common-mode failures shared controls, shared switchgear, human error and maintenance mistakes dominate, so the real benefit of 2N depends on true physical and operational separation of the paths. Load calculations support this by confirming that each path can actually carry the full load when the other is unavailable.
25. Phasing and modular build-out
Most data centers are built in phases. The load calculation should cover each phase:
| Phase | IT load | Equipment installed | Equipment loading |
|---|---|---|---|
| Phase 1 | 25% of build-out | Substation, MV switchgear, first unit substations, first UPS blocks and generators | Light loading; check UPS and transformer efficiency and generator minimum loading |
| Phase 2 | 50% | Additional UPS blocks, generators and cooling modules | Moderate loading |
| Phase 3 | 75% | Further blocks | Approaching design loading |
| Full build-out | 100% | All equipment | Design loading with redundancy |
Light loading in early phases has practical consequences: diesel generators running lightly loaded during tests can suffer wet stacking, UPS efficiency drops at low load, and transformer no-load losses become a larger share of total consumption. Load banks for generator testing and phased equipment installation help manage these issues.
26. NEC considerations specific to data centers
- Article 645 (information technology equipment): provides special provisions for IT rooms, including disconnecting means and cable installation, where the room meets its specific requirements.
- Article 220 (branch circuit, feeder and service load calculations): governs minimum service and feeder calculations; data center critical loads are generally calculated at full design value rather than with general demand factors.
- Articles 700, 701, 702 and 708: classify emergency, legally required standby, optional standby and critical operations power systems; most data center IT backup is optional standby, while life safety loads are emergency loads with separate requirements.
- Article 240.87: requires arc energy reduction methods for circuit breakers rated or adjustable to 1,200 A or higher.
- Article 230.95: requires ground-fault protection of equipment for solidly grounded wye services of more than 150 V to ground and 1,000 A or more.
27. Bringing it together: a load calculation deliverable
A complete data center electrical load calculation package that owners, lenders, utilities and design teams can rely on includes:
- Design basis memorandum: critical IT capacity, rack densities, phasing, redundancy topology, design ambient conditions and growth assumptions.
- IT load schedule: racks by type and hall, with design power and the source of each value.
- Mechanical load schedule: equipment ratings, design-day demand and annual-average demand, coordinated with the mechanical engineer.
- Electrical loss schedule: efficiency data for transformers, UPS, PDUs and distribution at expected loading.
- Support load schedule: lighting, life safety, security, controls and office loads.
- Reconciled facility load table: annual average, design-day peak and peak with growth, with checked sums and percentages.
- Equipment sizing calculations: transformers, switchgear, UPS, batteries, generators, chillers, cables and busway.
- Redundancy verification: each component's loading under normal and failure or maintenance conditions.
- Supporting studies: short circuit, coordination, arc flash, harmonics, voltage drop and generator transient response.
- Utility load application data: demand, ramp schedule, power quality and ride-through characteristics.
28. Key takeaways
- Start with defensible IT load, not nameplate ratings.
- Size for the peak design day, not annual-average PUE.
- Calculate cooling from heat load, not electrical overhead.
- Apply redundancy explicitly so every component can carry its share during a failure.
- Treat generators as a system, including recharge, motor starting, harmonics, step loading and leading power factor.
- Use US voltages and the NEC, including 125% continuous-load sizing and arc energy reduction.
- Reconcile every table: a load calculation is only as good as its arithmetic and its documentation.
29. How Keentel Engineering helps
Keentel Engineering provides electrical design, power system studies and utility interconnection engineering for enterprise, colocation, hyperscale and
AI data centers, from 4 kV to 765 kV.
| Stage | Keentel scope | Outcome |
|---|---|---|
| Load and capacity planning | IT and facility load calculations, phasing, redundancy and growth analysis | A defensible megawatt number |
| Utility interconnection | Large-load applications, transmission substation design, load flow, short-circuit and dynamic studies | Faster, smoother interconnection |
| Electrical design | Medium- and low-voltage distribution, UPS and generator systems, grounding and lightning protection | Constructible, code-compliant designs |
| Power system studies | Short circuit, coordination, arc flash, harmonics and voltage drop | Safe, reliable operation |
| Generator and UPS integration | Paralleling, load steps, leading power factor and transient studies | Systems that perform during outages |
| On-site generation and storage | Bridging power, BESS and microgrid design | Capacity when the grid is constrained |
| Owner's engineer | Design review, equipment specifications and commissioning support | Confidence in every design decision |
Why clients choose Keentel Engineering
- Grid-to-rack expertise: from the 345 kV interconnection to the rack PDU, one team understands the entire power chain.
- Utility and NERC experience: practical knowledge of large-load interconnection and ride-through expectations.
- Rigorous calculations: every assumption documented, every table reconciled.
- Licensed professional engineering: a Florida-registered firm with offices in Tampa, Austin, Sacramento and Baltimore, supporting projects nationwide.
- Independent advice: recommendations based on the owner's needs, not a vendor's product line.
Planning a data center or expanding an existing facility? Talk to Keentel Engineering at (813) 389-7871, contact@keentelengineering.com, or book a 15-minute scoping call at calendly.com/keentel-engineering/15min.
Part C — Case Studies
The following are illustrative scenarios based on conditions typical of US data center projects. They show how Keentel Engineering approaches load and capacity problems; site details are generalised and figures are rounded.
Case Study 1 — enterprise data center expansion: generators sized on average PUE
Situation
An enterprise owner plans to expand a 2 MW IT facility to 3 MW. The original design team sized new generators using the facility's annual PUE of 1.4, giving 4.2 MW of required generation.
Analysis
Keentel's review uses design-day mechanical demand, UPS recharge and the starting sequence of new chillers. Peak facility demand on a hot day reaches about 4.7 MW, and the first chiller restart after a utility outage would coincide with UPS recharge, pushing the generators beyond their rating.
Engineered solution
Keentel resizes the generator plant with an additional unit, implements staggered mechanical restart and limits UPS recharge current during generator operation. Generator load-step testing is added to the commissioning plan.
Outcome
The expanded facility passes a full-load, design-condition generator test with margin, and the owner avoids a capacity shortfall that would have surfaced only during a summer outage.
Case Study 2 — 60 MW AI campus at 230 kV: interconnection and load dynamics
Situation
A developer plans a 60 MW AI training campus served from a new 230 kV substation. The utility requests load flow, short-circuit and dynamic data, including the facility's behavior during transmission faults and its load fluctuation characteristics.
Analysis
Keentel develops a facility load model including UPS ride-through behavior, mechanical load response and synchronized AI training load swings. Studies show that, without mitigation, training cycles could produce load fluctuations visible at the 230 kV bus, and that a fault on a nearby line could cause the UPS systems to transfer to battery, momentarily removing the facility's load from the grid.
Engineered solution
Keentel recommends a campus battery energy storage system to smooth AI load fluctuations, UPS settings that ride through transmission faults without unnecessary transfer, and a phased ramp schedule agreed with the utility.
Outcome
The utility approves the interconnection with defined ramp rates and ride-through characteristics, and the campus energizes on schedule.
Case Study 3 — colocation facility: cooling plant undersized by the load calculation
Situation
A colocation provider's preliminary design calculated cooling capacity from the difference between facility power and IT power, resulting in a chiller plant roughly half the required size.
Analysis
Keentel's review recalculates the heat load from IT, losses, lighting and envelope gains, and confirms that the chiller plant must be more than twice the preliminary capacity. Electrical loads for the revised mechanical plant increase the transformer and generator sizes.
Engineered solution
Keentel coordinates with the mechanical engineer to update the cooling design, then recalculates the electrical design, transformer ratings, generator plant and short-circuit and arc flash studies.
Outcome
The error is corrected before equipment is ordered, avoiding a cooling shortfall that would have limited the facility to about half its marketed capacity.
Part D — Technical FAQ: Data Center Electrical Load Calculations
The critical IT capacity — the total IT load the facility is designed to support — based on rack design power, not server nameplate ratings.
Power usage effectiveness is the ratio of total facility energy to IT energy over a year. It measures efficiency, not peak demand.
Only as a rough estimate. Equipment must be sized for peak design-day demand, which is higher than the annual-average PUE implies.
From the heat load: IT power plus losses and other loads in the conditioned space, divided by 3.517 to obtain tons of refrigeration. It is not the difference between facility power and IT power.
I = P × 1000 ÷ (√3 × VLL × PF), with P in kW, VLL in volts and PF the power factor.
480Y/277 V is the standard US low-voltage system. For the same power, it draws less current than 400 V, reducing conductor and equipment sizes.
N+1 adds one redundant component to the number needed. 2N provides two complete, independent systems, each able to carry the full load.
In 2N designs, each UPS path is sized for the full critical load. In distributed redundant designs, each block is sized for its share of the load with one block out of service.
Modern UPS designs are commonly rated so that kVA equals kW, reflecting the near-unity power factor of IT power supplies.
For the full facility peak load including mechanical systems, UPS recharge, motor starting, harmonics, derating and growth, with the required redundancy and an appropriate duty rating.
A generator rating offered by many manufacturers for data center applications, allowing operation at rated load for unlimited hours during utility outages, distinct from emergency standby ratings.
At light load, UPS input filters and IT power supplies can make the load capacitive. Generators have limited ability to absorb reactive power, and excessive leading power factor can destabilize their voltage regulators.
Conductors and standard overcurrent devices for continuous loads must be sized at 125% of the continuous load unless the device is listed for 100% operation.
Many designs target about 80% loading at design peak, plus explicit growth margins and redundancy.
With 5.75% impedance and an infinite source, about 31 kA, before adding motor and generator contributions.
AI training clusters can change power rapidly and in synchronization, causing load swings that affect UPS systems, generators in island mode and the utility grid.
Typically load applications, ramp schedules, load flow and short-circuit studies, and increasingly dynamic models, ride-through characteristics and power quality data.
From efficiency curves of transformers, UPS systems, PDUs and cables at expected loading. Losses add to both electrical demand and heat load.
The NEC (NFPA 70), NFPA 75 and 110, IEEE 519 and 1584, ASHRAE 90.4, TIA-942 and BICSI 002, among others.
Sizing from annual-average PUE and calculating cooling from electrical overhead. Both can undersize critical equipment significantly.
References and Further Reading
Links were current at publication (October 2026).
- NFPA 70, National Electrical Code (Articles 215, 220, 230, 240, 250, 645, 700, 701, 702 and 708); NFPA 75; NFPA 110; NFPA 70E. National Fire Protection Association.
- IEEE Std 519, Standard for Harmonic Control in Electric Power Systems; IEEE Std 1584, Guide for Performing Arc-Flash Hazard Calculations; IEEE 3000 Standards Collection. IEEE.
- ANSI/ASHRAE Standard 90.4, Energy Standard for Data Centers; ASHRAE TC 9.9 Thermal Guidelines for Data Processing Environments. ASHRAE.
- ANSI/TIA-942, Telecommunications Infrastructure Standard for Data Centers; ANSI/BICSI 002, Data Center Design and Implementation Best Practices.
- ISO/IEC 30134-2, Key Performance Indicators — Power Usage Effectiveness; The Green Grid PUE guidance.
- US Department of Energy, energy conservation standards for distribution transformers (10 CFR 431).
- NERC, reports and alerts on large load behavior during transmission system disturbances. North American Electric Reliability Corporation.
Disclaimer
This article is general technical information for educational purposes. It is not engineering advice for any specific project and does not create a professional relationship. Load values, efficiencies, ratings, PUE values and equipment sizes are illustrative; actual designs must follow the current editions of applicable codes and standards, utility requirements, equipment manufacturer data and project-specific engineering analysis, sealed by a licensed professional engineer where required.
Case studies are illustrative scenarios based on typical project conditions, not records of specific client projects. Figures are rounded and indicative.
NFPA, IEEE, ASHRAE, TIA, BICSI, The Green Grid, Uptime Institute, NERC and other names are the property of their respective owners. Keentel Engineering is not affiliated with or endorsed by these organisations or any equipment vendor.
| Office | Address | Phone |
|---|---|---|
| Head Office — Tampa | 400 N Ashley Dr STE #2600, Tampa FL 33602 | (813) 389-7871 |
| Austin | 5900 Balcones Drive STE 100, Austin TX 78731 | (512) 591-0752 |
| Sacramento | 1401 21st St Ste R, Sacramento CA 95811 | (916) 913-4524 |
| Baltimore | 306 W Redwood St STE 200, Baltimore MD 21201 | (410) 225-2181 |

About the Author:
Sandip "Sonny" R. Patel, P.E.
IEEE Senior Member · Founder & CEO, Keentel Engineering
In 1995, Sonny Patel earned his Electrical Engineering degree from the University of Illinois. But degrees don't build legacies — action does.
For three decades, he has worked the power industry from every side of the table: 16 years as a utility engineer at Exelon/Commonwealth Edison; generation leadership across hydroelectric, industrial steam turbine, and a 9 GW renewable fleet; NERC Regional Entity Senior Compliance Engineer and Audit Team Lead, auditing some of the nation's largest utilities; and testing and commissioning lead on equipment up to 765 kV — the very top of the North American grid.Utility. Generator. Regulator. Consultant. Few engineers have seen all four seats. Fewer still have sat in them.
His experience spans nuclear, hydro, conventional generation, renewables, oil and gas, mining — and today's data centers, where he is authoring a three-book series on data center design. He is a Licensed Professional Engineer in six states and a Licensed Electrical Contractor in Florida (Unlimited EC) — he doesn't just design the work; he's qualified to stand behind its execution.Today, as Founder and CEO of Keentel Engineering, Sonny leads a nationwide team of engineers delivering substation design, power system studies, NERC compliance, and commissioning — done right, coast to coast.Three decades. Every side of the table. One standard: accountable engineering.
Services

Let's Discuss Your Project
Let's book a call to discuss your electrical engineering project that we can help you with.
About the Author:
Sandip "Sonny" R. Patel, P.E.
IEEE Senior Member · Founder & CEO, Keentel Engineering
In 1995, Sonny Patel earned his Electrical Engineering degree from the University of Illinois. But degrees don't build legacies — action does.
For three decades, he has worked the power industry from every side of the table: 16 years as a utility engineer at Exelon/Commonwealth Edison; generation leadership across hydroelectric, industrial steam turbine, and a 9 GW renewable fleet; NERC Regional Entity Senior Compliance Engineer and Audit Team Lead, auditing some of the nation's largest utilities; and testing and commissioning lead on equipment up to 765 kV — the very top of the North American grid.
Utility. Generator. Regulator. Consultant. Few engineers have seen all four seats. Fewer still have sat in them.
His experience spans nuclear, hydro, conventional generation, renewables, oil and gas, mining — and today's data centers, where he is authoring a three-book series on data center design. He is a Licensed Professional Engineer in six states and a Licensed Electrical Contractor in Florida (Unlimited EC) — he doesn't just design the work; he's qualified to stand behind its execution.
Today, as Founder and CEO of Keentel Engineering, Sonny leads a nationwide team of engineers delivering substation design, power system studies, NERC compliance, and commissioning — done right, coast to coast.Three decades. Every side of the table. One standard: accountable engineering.
Leave a Comment
Thank you for contacting us.
We will get back to you as soon as possible.
We will get back to you as soon as possible.
Oops, there was an error sending your message.
Please try again later.
Please try again later.
Related Posts
By SANDIP R PATEL
•
October 20, 2026
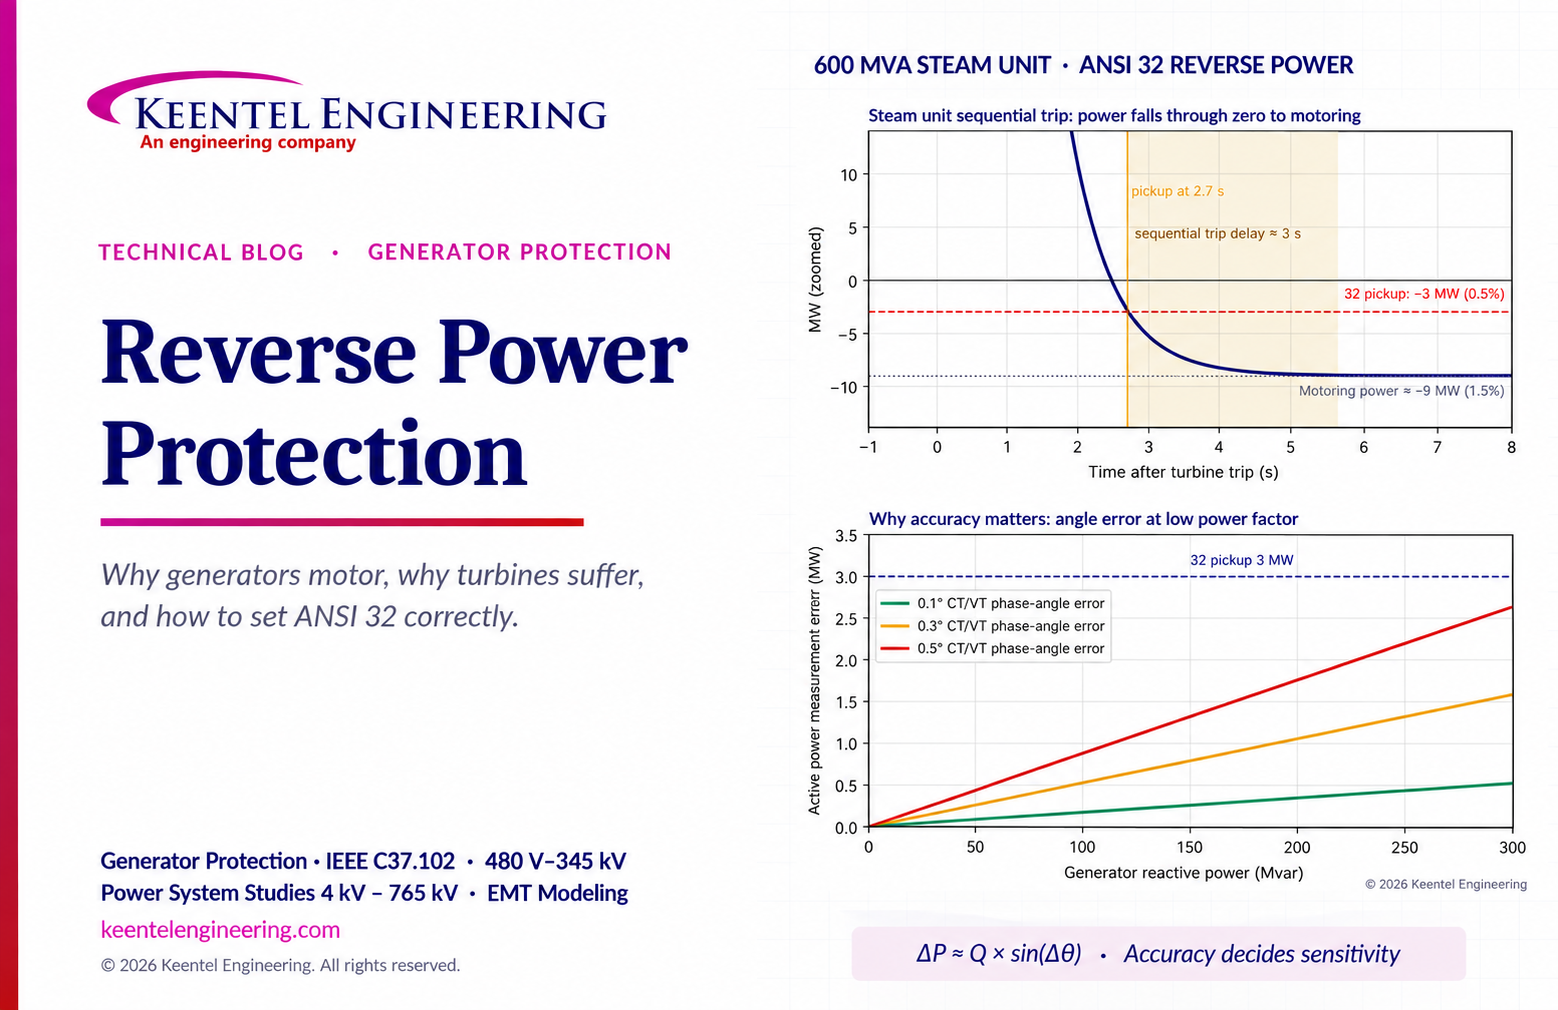
Learn reverse power protection (ANSI 32), generator motoring, relay pickup settings, time delays, sequential tripping and testing for US power plants.
Copy
By Team 2 Dexora
•
October 20, 2026
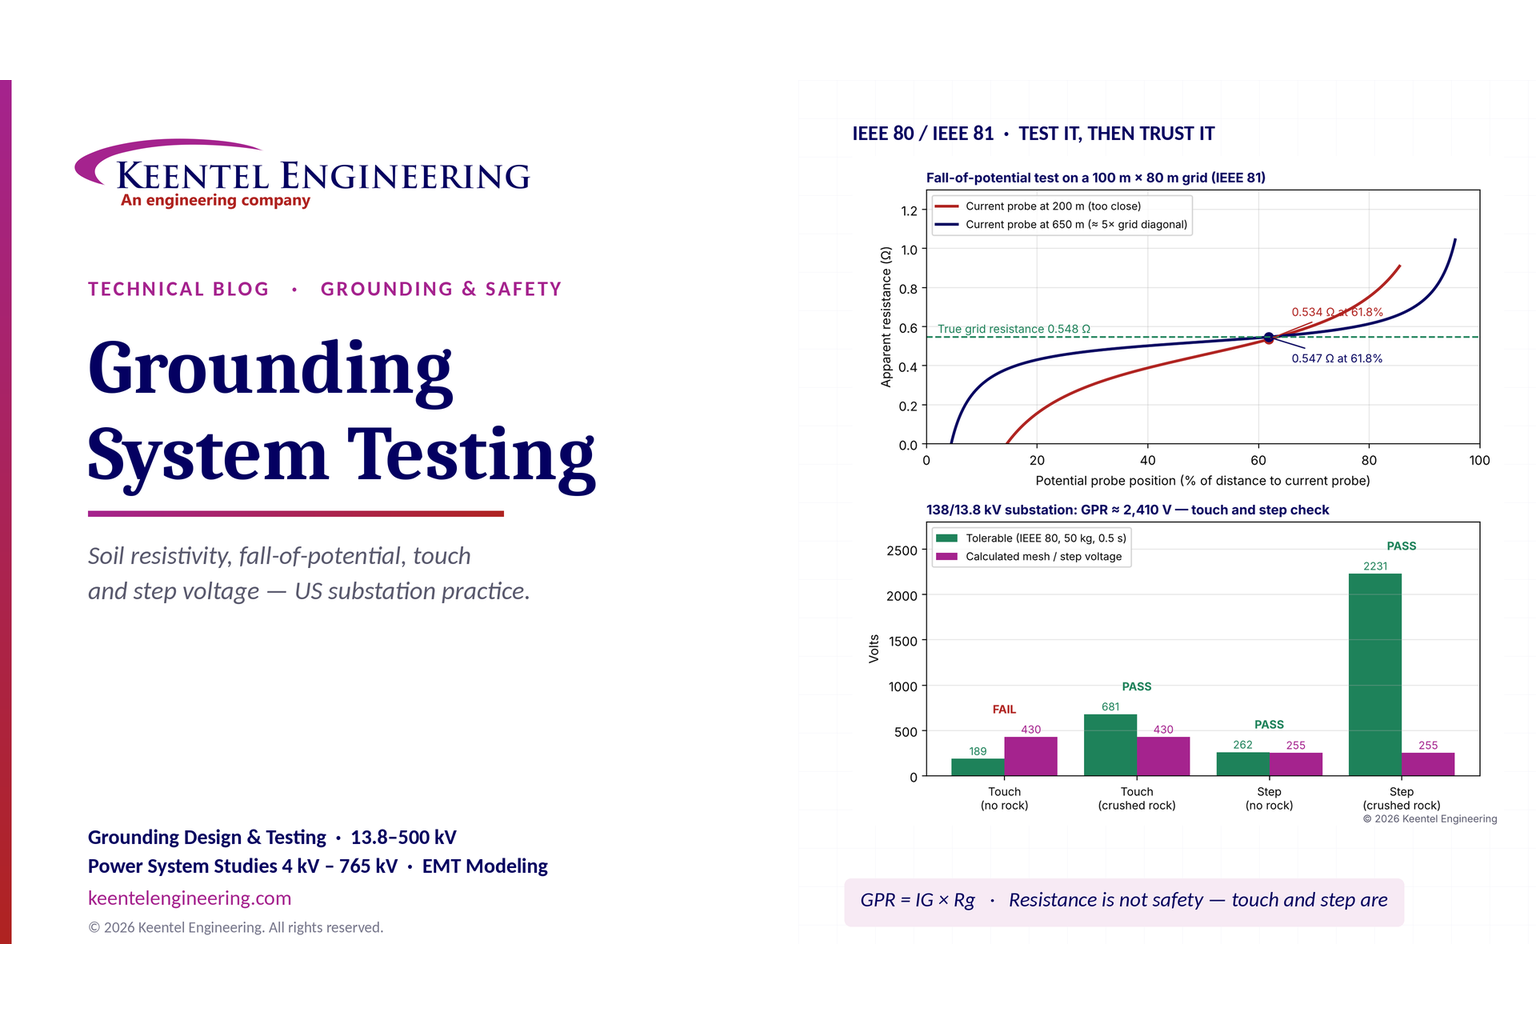
Explore grounding system testing with Keentel Engineering. Learn IEEE 80/81 methods, soil resistivity, ground resistance, and touch and step voltage safety.
By SANDIP R PATEL
•
October 13, 2026
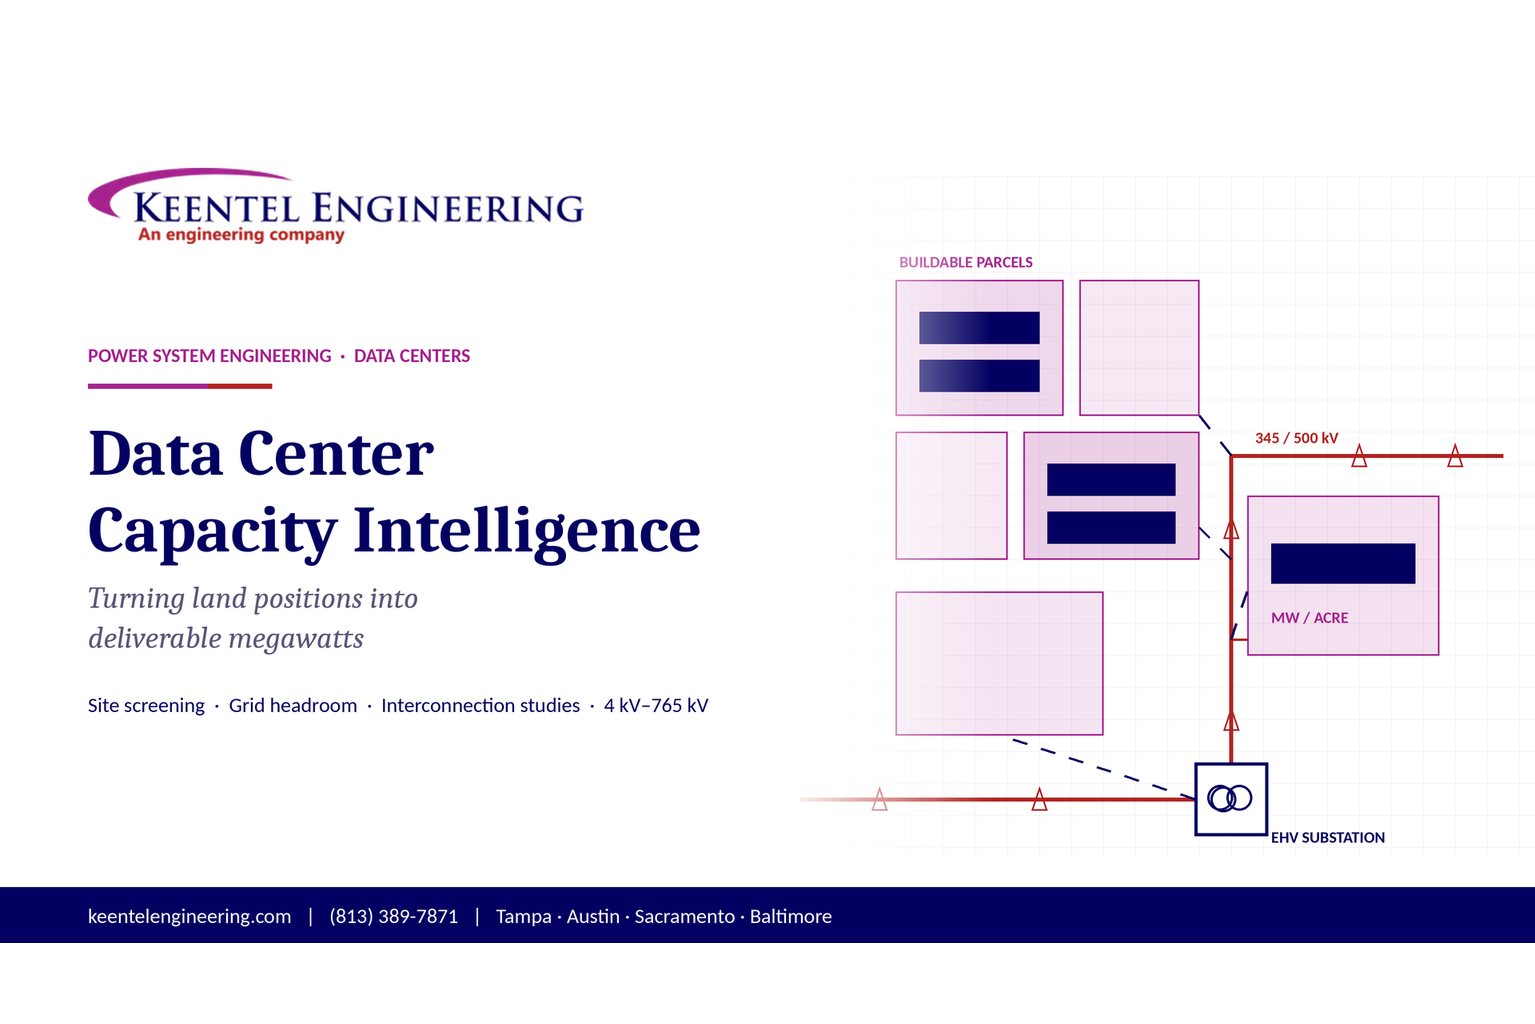
Plan data center capacity with land screening, MW-per-acre estimates, grid power availability and interconnection feasibility studies from Keentel Engineering.
By SANDIP R PATEL
•
October 11, 2026
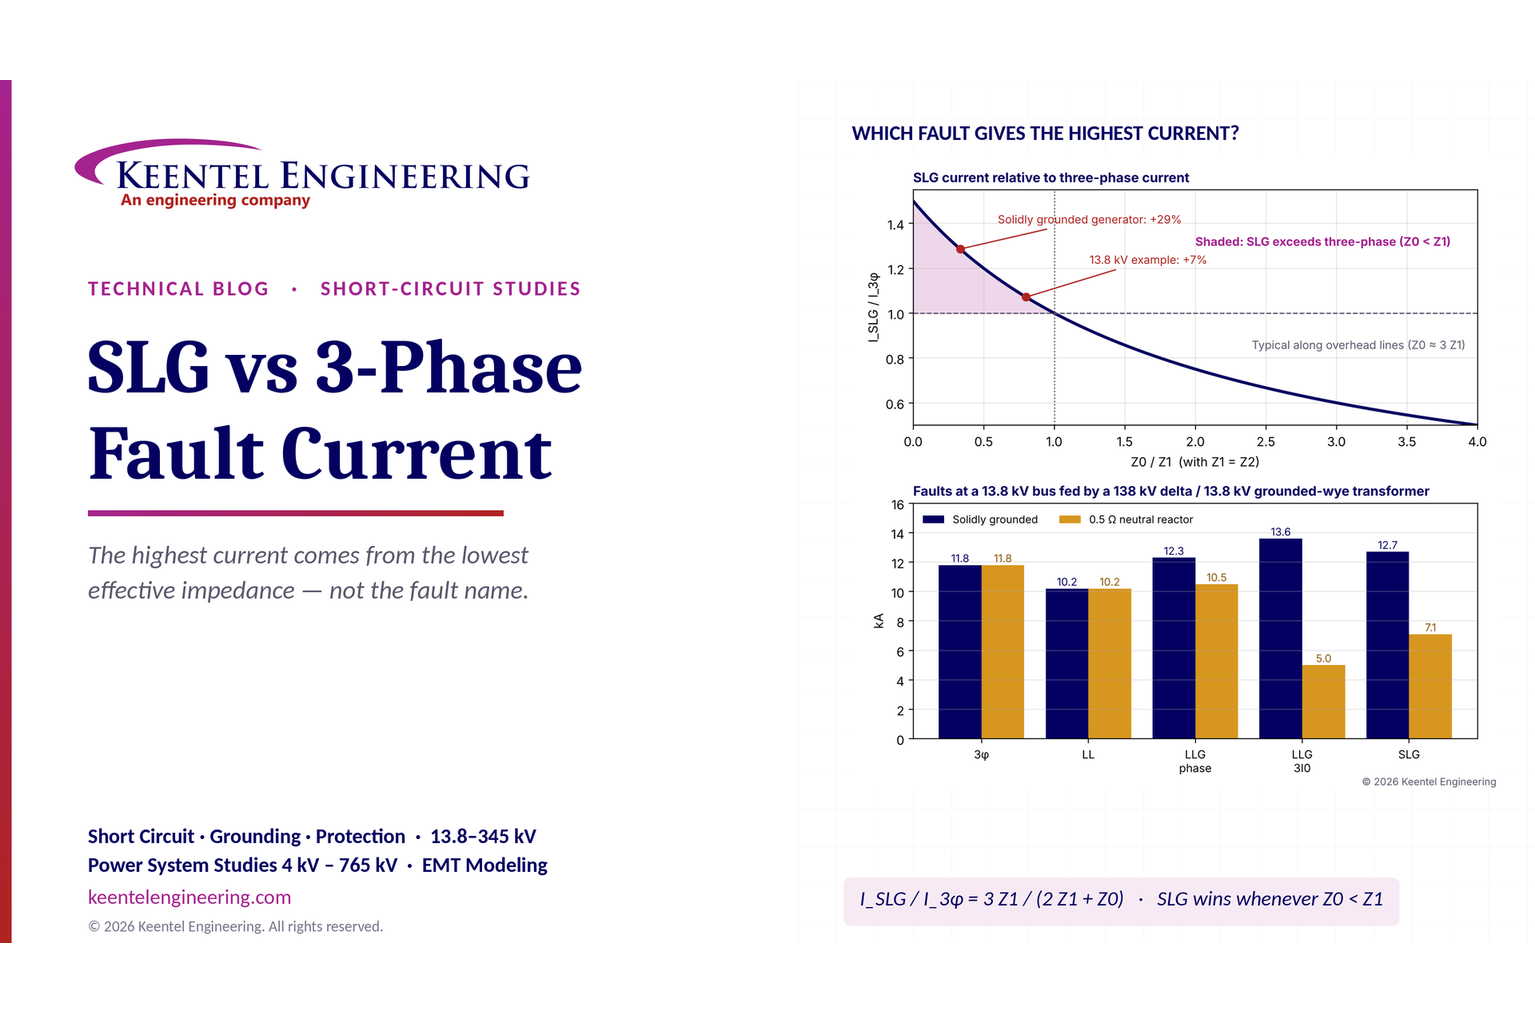
Learn which fault produces the highest current at a bus, why SLG faults can exceed three-phase faults, and how symmetrical components determine fault duty.
By SANDIP R PATEL
•
October 11, 2026
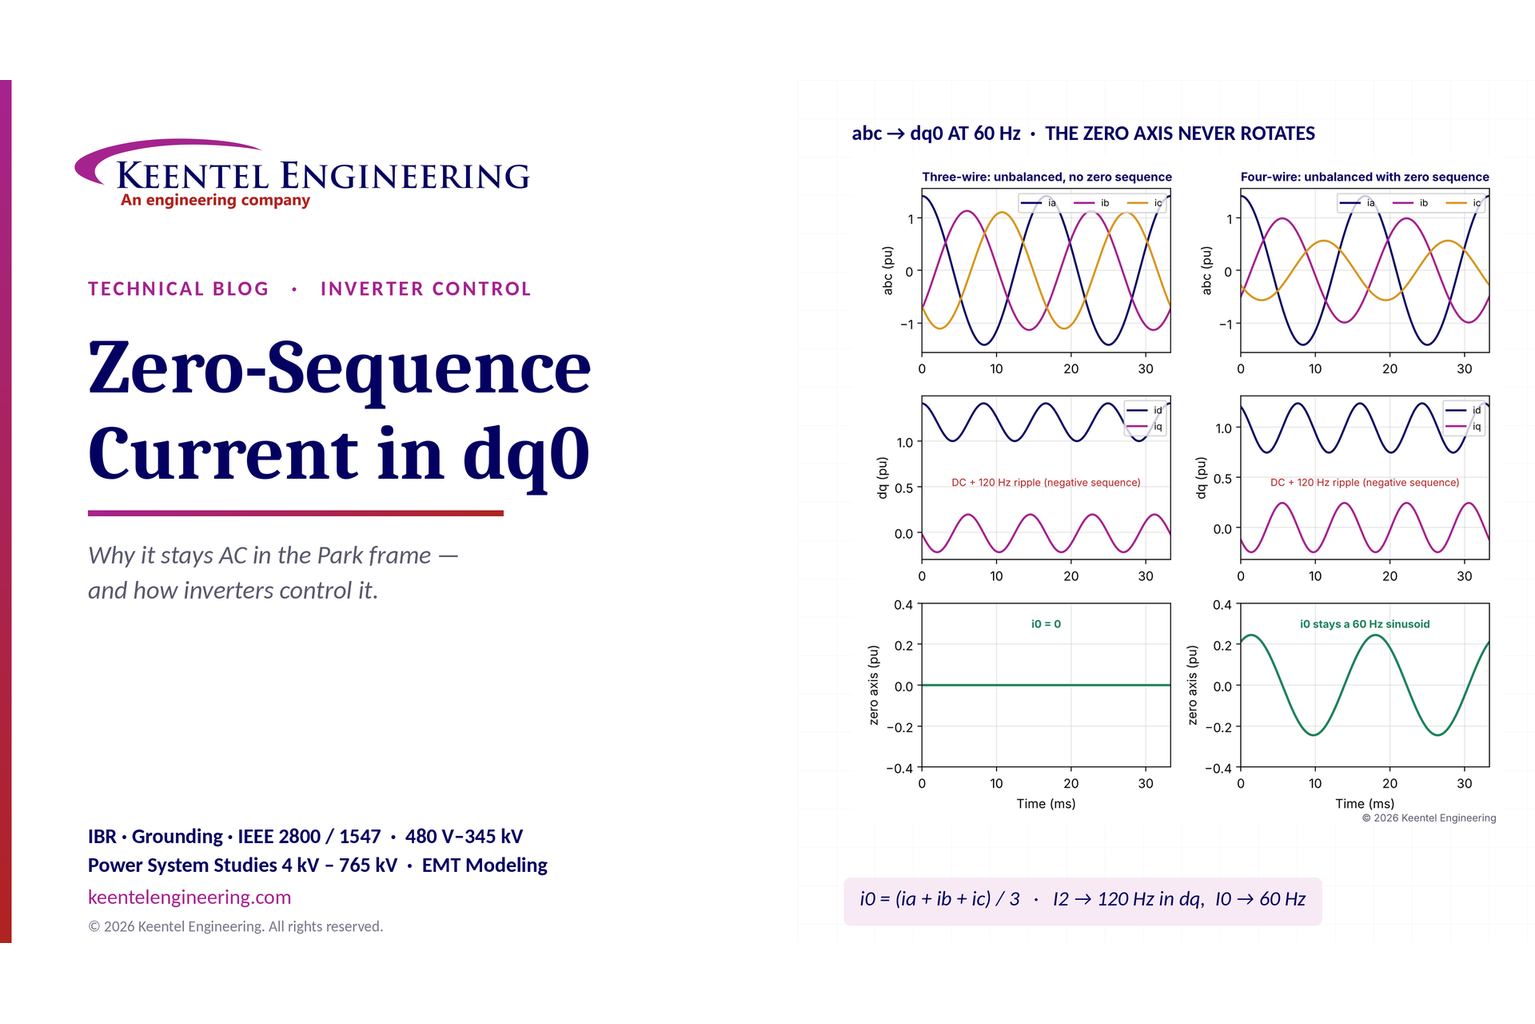
Learn why zero-sequence current pulsates in the dq0 frame, how Park's transformation works, and how inverter controls handle unbalance and ground faults.
By SANDIP R PATEL
•
October 11, 2026
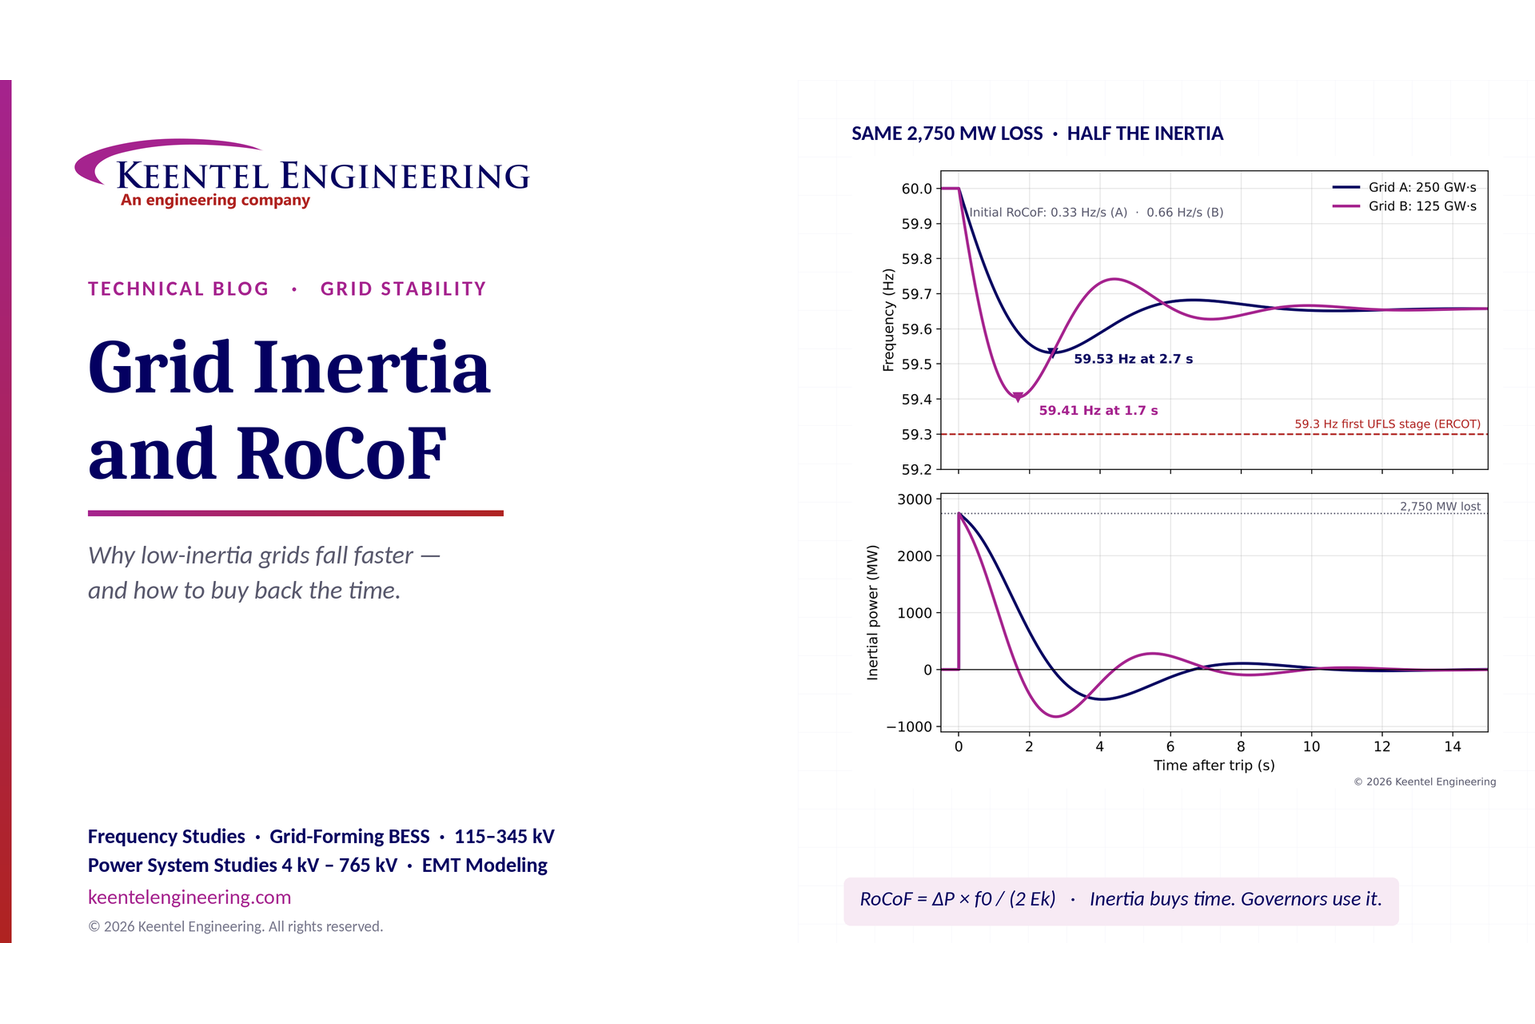
Explore grid inertia, RoCoF and frequency response, with swing equation calculations, frequency nadir analysis and US power system simulation examples.
By SANDIP R PATEL
•
October 11, 2026
Learn transient stability analysis, swing equation, equal-area criterion and critical clearing time with a 345 kV worked example and NERC TPL-001 guidance.
By SANDIP R PATEL
•
October 11, 2026
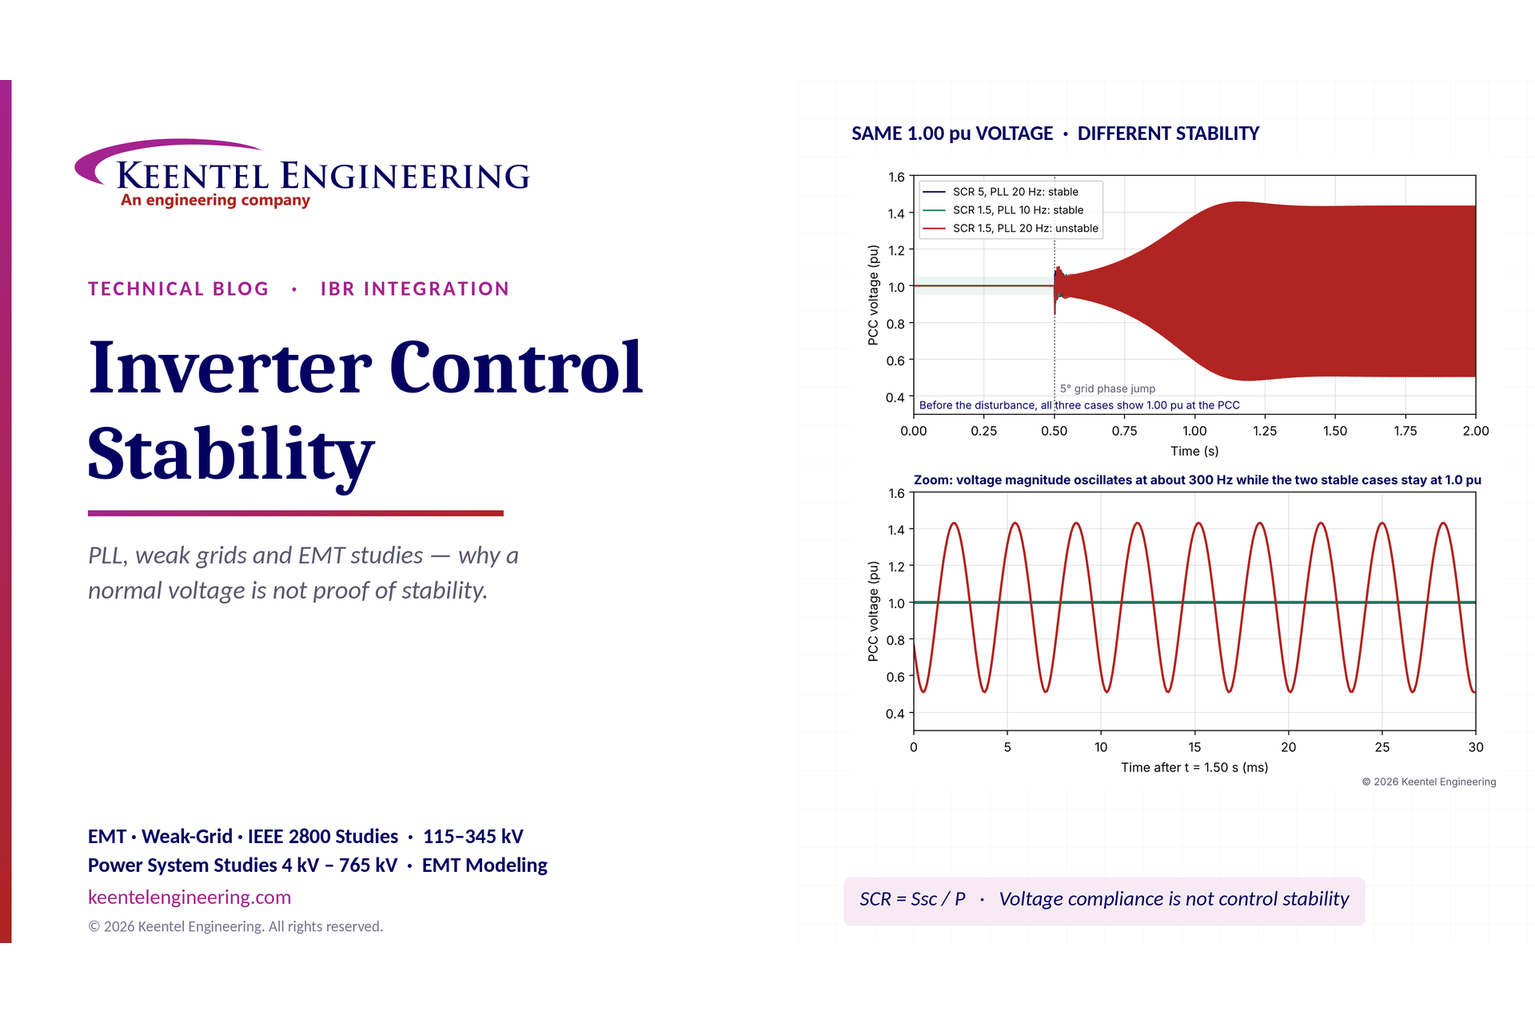
Learn why inverter controls become unstable in weak grids, how PLL bandwidth and SCR affect stability, and how PSCAD EMT studies identify and mitigate oscillations.
By SANDIP R PATEL
•
October 11, 2026
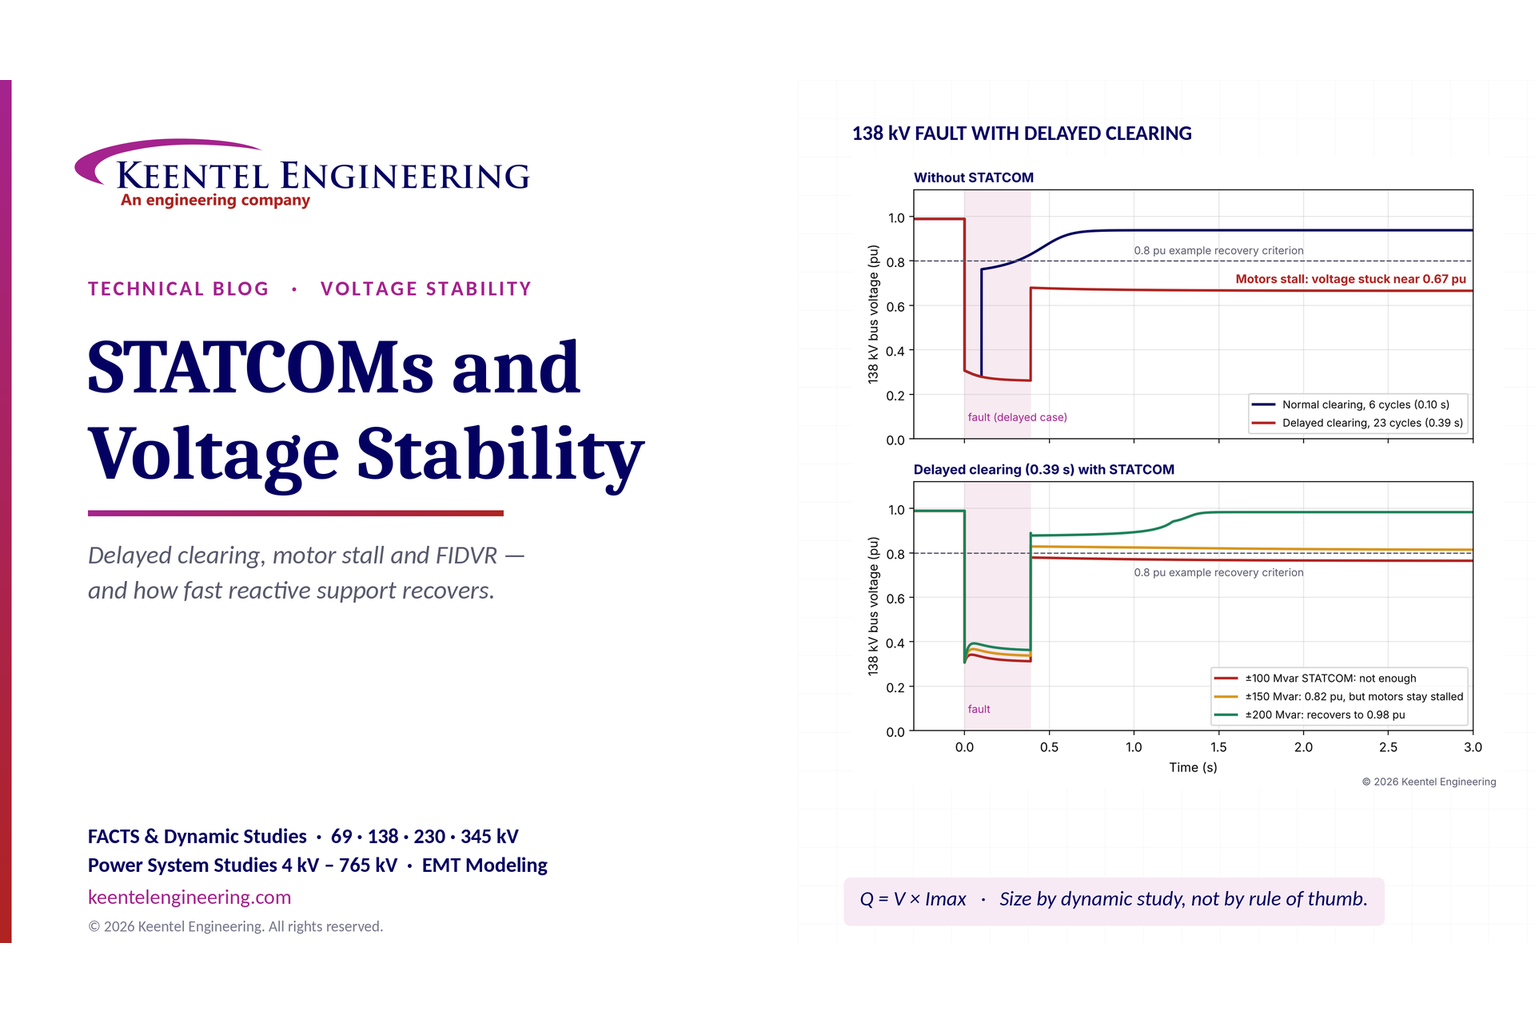
Learn how STATCOMs improve voltage stability and prevent FIDVR. Explore reactive power sizing, delayed fault clearing, NERC criteria and 138 kV simulation results.