
A Coordinated Electric System Interconnection Review—the utility’s deep-dive on technical and cost impacts of your project.
Challenge: Frequent false tripping using conventional electromechanical relays
Solution: SEL-487E integration with multi-terminal differential protection and dynamic inrush restraint
Result: 90% reduction in false trips, saving over $250,000 in downtime
The three operating regions you have to design to
| Device | Output vs voltage | Response | Best suited to | Main limitations |
|---|---|---|---|---|
| Mechanically switched capacitor or reactor | Proportional to voltage squared | Seconds; discrete steps; limited switching operations per day | Steady-state reactive supply, voltage profile, loss reduction | No dynamic capability; step voltage change on switching; capability collapses when most needed |
| Static var compensator | Capacitive branches proportional to voltage squared | A few cycles; continuously controllable | Continuous control where cost matters and deep voltage support is not the driver | Square-law capability loss; harmonic filters are part of the plant and interact with the network |
| STATCOM | Approximately proportional to voltage — constant current capability | One to two cycles closed loop; converter response faster still | Voltage stability margin, weak interconnections, fast disturbance recovery, flicker and unbalance compensation | Higher capital cost; converter losses; adds a converter and its control dynamics to the network |
| Synchronous condenser | Governed by machine capability and excitation | Excitation response in the hundreds of milliseconds; inherent inertial response instantaneous | System strength and inertia, short-circuit contribution, black start support | Rotating plant with maintenance and losses; slower controlled response than a converter |
| STATCOM with energy storage | Reactive as a STATCOM, plus real power within the storage rating | As STATCOM for reactive; real power limited by storage | Where a real power deficiency is part of the problem | Cost and complexity of the storage; different failure and maintenance profile |
Moving 100 MW of Heat: What the Cooling Plant Arithmetic Actually Says
September 5, 2026 | Blog
CDUs, Primary and Secondary Loops, Free Cooling, Thermal Storage and Controls on an AI Campus — Worked Through in Numbers, and Why the Electrical Design Decides Whether Any of It Survives a Disturbance
1. Executive Summary
A hundred megawatts of artificial intelligence compute produces very close to a hundred megawatts of heat, and that heat has to leave the building continuously, through equipment that keeps working when parts of it fail and when the load changes faster than the machinery can respond.
The architecture that does it is now fairly settled: cold plates on the silicon, a secondary fluid loop serving the racks, a coolant distribution unit separating that loop from the facility, a primary fluid loop carrying heat to a central plant, and heat rejection through dry coolers, adiabatic assistance, cooling towers or mechanical refrigeration depending on the weather. Thermal storage buffers the transients. A control hierarchy coordinates all of it.
What is less settled is the arithmetic underneath, and this paper works through it. Three results are worth stating up front. The heat rejection equipment does not size to 100 MW — in mechanical cooling it sizes to roughly 115 to 125 MW, because the compressor work becomes condenser heat. Temperature difference across the loop is the single most powerful design lever available, and doubling it halves flow and cuts pump power by close to an order of magnitude. And thermal storage sized for transients buys seconds rather than minutes: a five hundred cubic metre buffer with five kelvin of allowable rise holds a hundred megawatt load for about a hundred seconds.
The last of those points to the argument this paper ends on. At a hundred megawatts of compute the cooling plant is itself a fifteen to twenty megawatt electrical load, dominated by variable-speed drives. A voltage disturbance that the servers ride through can trip the cooling plant, and a cooling plant that stops has roughly a hundred seconds of stored margin. The thermal design and the electrical design are the same problem, and they are usually done by different teams.
The framing this paper argues for
A cooling plant does not fail thermally. It fails electrically, hydraulically or in its controls, and the thermal consequence follows within seconds.
Which means the cooling plant has to be evaluated inside the electrical resilience architecture, not alongside it.
2. The Plant Does Not Reject 100 MW
It is true that essentially all electrical energy delivered to the servers becomes heat. It is not true that the heat rejection equipment sizes to that number, and the difference is large enough to change equipment counts.
In free cooling the plant rejects the information technology heat plus the work the pumps put into the fluid — a modest addition. In mechanical cooling the picture changes. A chiller does not destroy heat; it moves it, and the compressor work it consumes appears at the condenser on top of the evaporator load. Condenser heat is therefore the evaporator load multiplied by one plus the reciprocal of the coefficient of performance.
| Chiller COP | Evaporator load | Compressor work | Heat rejected at the condenser |
|---|---|---|---|
| 4 | 100 MW | 25 MW | 125 MW |
| 5 | 100 MW | 20 MW | 120 MW |
| 6 | 100 MW | 16.7 MW | 116.7 MW |
| 7 | 100 MW | 14.3 MW | 114.3 MW |
So the towers, dry coolers or condensers are sized for something in the region of a hundred and fifteen to a hundred and twenty-five megawatts, not a hundred. That is fifteen to twenty-five percent more heat rejection capacity, and on a plant of this size it is several additional cells or modules.
Two related points follow. Pump and fan work also lands in the fluid as heat, which is a second reason the loop carries slightly more than the information technology load. And the same arithmetic explains why free cooling is worth so much: in free cooling there is no compressor work to reject, so the heat rejection duty drops back toward the information technology load and the equipment operates further from its limit.
3. Checking the Flow Calculation
The governing relationship is that heat transported equals mass flow multiplied by specific heat multiplied by the temperature difference between supply and return. Rearranged for flow, and worked for a hundred megawatts of water-based coolant across ten kelvin, it gives about two thousand three hundred and ninety kilograms per second.
That figure is correct. Taking specific heat at roughly 4.19 kilojoules per kilogram-kelvin, a hundred megawatts divided by 41.9 gives 2,389 kilograms per second, which at near-unity density is close to 2,400 litres per second, or approximately 38,000 gallons per minute.
What that number is not, however, is a pipe size. It is the total circulation for an entire hundred megawatt campus, and Section 7 works through what happens if anyone tries to move it in a single header.
4. Delta-T Is the Most Powerful Lever You Have
Because flow is inversely proportional to temperature difference, the delta-T chosen at design is the decision with the largest downstream consequence in the whole hydraulic system.
| Loop ΔT | Mass flow | Volume flow | Approximate US flow | Relative pump power |
|---|---|---|---|---|
| 5 K | 4,778 kg/s | 4,800 L/s | 76,100 GPM | about 8× the 10 K case |
| 10 K | 2,389 kg/s | 2,400 L/s | 38,100 GPM | reference |
| 15 K | 1,593 kg/s | 1,600 L/s | 25,400 GPM | about 0.30× |
| 20 K | 1,194 kg/s | 1,200 L/s | 19,000 GPM | about 0.13× |
| 25 K | 956 kg/s | 960 L/s | 15,200 GPM | about 0.06× |
The pump power column deserves explanation because the effect is not linear. On a given piping system, friction head varies roughly with the square of flow and pump shaft power with the product of flow and head — so with the cube of flow. Halving flow by doubling delta-T therefore reduces pump power by something approaching a factor of eight on the same pipework.
The benefit compounds. A larger delta-T at a fixed supply temperature means a higher return temperature, and a higher return temperature is easier to reject to ambient air. So the same decision that shrinks the pumps also widens the free cooling window discussed in Section 6.
What limits it is the silicon. The supply temperature is bounded below by what the plant can produce economically and above by the cold plate approach and the processor temperature limit. Increasing delta-T at a fixed supply temperature means the coolant leaves the cold plate hotter, and at some point the last processor in the flow path is running too close to its limit. Delta-T is therefore optimised against the thermal budget in the next section, not chosen freely.
5. The Fluid Is Probably Not Water
Treatments of this subject routinely say water-like coolant and move on. The fluid properties matter enough to be worth a paragraph, because they enter the flow equation directly.
Where freeze protection is required — outdoor piping, dry coolers in cold climates — the loop carries a glycol solution, and glycol has a lower specific heat than water. At around twenty-five percent propylene glycol the specific heat falls to roughly 3.9 kilojoules per kilogram-kelvin, which means about seven percent more mass flow is needed for the same duty. At forty percent it falls further, toward fifteen percent more flow.
That is the smaller effect. The larger ones are that glycol raises viscosity substantially at low temperature, which increases friction losses and pumping power beyond the flow increase alone, and that it reduces the convective heat transfer coefficient, which degrades performance at every heat exchanger and cold plate in the path. Selecting a glycol concentration is therefore a hydraulic and thermal decision as much as a freeze protection one, and the lowest concentration that protects the exposed portion of the system is usually the right answer.
Where only part of the system is exposed — the heat rejection loop outdoors, the interior loops not — separating the fluids at a heat exchanger so glycol is confined to the exposed circuit is generally worth the additional approach temperature it costs.
6. The Temperature Chain From Silicon to Sky
This is the analysis that determines whether a site can free cool, and it is absent from most descriptions of these plants. Every heat exchange step between the atmosphere and the processor junction consumes part of a fixed temperature budget, and what remains at the end is the operating margin.
Working from the outside in:
| Step | What consumes temperature | Design consequence |
|---|---|---|
| Ambient to heat rejection outlet | Dry cooler or tower approach to dry bulb, or to wet bulb with evaporative assistance | Larger coil area buys a closer approach and widens the free cooling hours, at capital and space cost |
| Heat rejection outlet to PFN supply | Piping gains, mixing, and any intermediate heat exchanger | An extra separation heat exchanger costs approach temperature every hour of the year, which is why fluid separation decisions are not free |
| PFN supply to SFN supply | Plate heat exchanger approach across the coolant distribution unit | Plate heat exchangers can be specified to a close approach, but closer approach means more plates, more pressure drop and more pump work |
| SFN supply to cold plate inlet | Distribution losses through headers, manifolds and hoses | Manifold and quick-disconnect selection has a thermal cost as well as a hydraulic one |
| Cold plate inlet to processor junction | Coolant temperature rise through the plate plus the plate and thermal interface resistance | This is the vendor’s number and it is largely fixed. It sets the maximum acceptable cold plate inlet temperature |
Add those up from the processor limit backwards and the result is the highest ambient temperature at which the plant can hold the required supply temperature without mechanical refrigeration. That single number determines the free cooling hours at the site, which determines annual energy, which determines whether the chillers are a backstop or the primary cooling mode.
Why warm-water cooling changes the economics
Traditional chilled water systems deliver coolant well below ambient for much of the year, so compressors run most of the time. Direct liquid cooling to silicon tolerates far warmer supply, which moves the entire budget upward.
Every kelvin of supply temperature the equipment will accept converts directly into free cooling hours. Negotiating the acceptable cold plate inlet temperature with the equipment vendor is therefore an energy decision, not a specification detail.
7. Hydraulics at 38,000 Gallons per Minute
Return to the flow figure and ask what it means physically. At a typical design velocity for a large header, moving 38,000 gallons per minute in one pipe requires a diameter of about forty inches — forty-four at eight feet per second, thirty-nine at ten, thirty-six at twelve.
That is a plausible pipe in a power station and an implausible one distributed through a data hall. Which is why the architecture in practice divides the load: multiple primary loops, zone headers, and a coolant distribution unit population sized so that each unit handles a manageable fraction. A modular unit at around a megawatt of duty implies on the order of a hundred units plus redundancy for a hundred megawatt hall, and the hydraulic design problem becomes balancing flow across that population rather than moving one enormous stream.
Three hydraulic consequences follow that a component-level view misses.
- Distribution imbalance. With many parallel branches on shared headers, the hydraulically nearest units see more flow than the furthest unless the design deals with it — through reverse return arrangement, balancing valves, or pressure-independent control valves. On a liquid cooled hall the penalty for getting this wrong lands on specific racks, not on an average.
- Velocity limits at both ends. Too high and you get erosion, noise and excessive pressure drop; too low and air entrainment and sediment become problems. The window narrows with glycol.
- Air and fill management. Filling, venting and maintaining a system of this volume is a design task with dedicated equipment, not a commissioning afterthought. Trapped air in a cold plate circuit is a rack-level failure.
8. Pump Control and the Limits of the Affinity Laws
Variable speed pumping is correctly presented as the main efficiency mechanism, and the affinity relationships behind it are worth stating precisely: flow varies with speed, head with the square of speed, and shaft power with the cube.
The cube law is also routinely over-promised, and the reason is the control strategy. Those relationships describe movement along a system curve that passes through the origin — pure friction, no static component. A real plant controls to a differential pressure setpoint at a remote sensor, which means the pump follows a control curve that does not pass through the origin. At reduced flow the pump still produces the setpoint pressure, so power falls considerably less steeply than the cube.
The practical consequences are worth designing for.
- Sensor location matters more than the setpoint value. A differential pressure sensor at the pump discharge produces almost no energy saving; one at the hydraulically most remote load produces most of the available saving.
- Setpoint reset is where the remaining energy sits. Resetting the differential pressure target based on control valve positions — lowering it until the most open valve approaches full open — recovers much of the gap between the control curve and the true system curve.
- Minimum flow protection is a real constraint. Pumps and chiller evaporators have minimum flow requirements, and a variable flow design has to prove it can satisfy them at the lowest credible load without short-cycling or bypassing more than necessary.
9. Heat Rejection Modes and What Selects Them
| Mode | How it works | When it is available | What it costs |
|---|---|---|---|
| Dry cooling | Fluid rejects heat to ambient air across a finned coil. No compressor, no water | When ambient dry bulb sits far enough below the required supply temperature to cover the whole approach chain | Fan energy and coil area. Largest capital footprint per unit of duty, lowest operating cost |
| Adiabatic assistance | Inlet air pre-cooled by evaporation before crossing the coil, moving the effective approach toward wet bulb | Extends dry cooling into warmer conditions, typically the hottest hours of the year | Water consumption and treatment. Trades water efficiency against power efficiency |
| Open cooling tower | Evaporative rejection with the process fluid or a condenser loop | Wet bulb driven, so effective in most climates | Significant water use, treatment, drift and legionella management |
| Mechanical refrigeration | Chiller lifts heat from the loop to a higher temperature for rejection | Whenever ambient cannot support the required supply temperature | Compressor energy, and the fifteen to twenty-five percent additional condenser heat from Section 2 |
| Hybrid or partial economisation | Free cooling removes part of the load, mechanical cooling the remainder | The shoulder conditions, which in many climates are most of the year | Control complexity. This is where most of the annual energy is actually decided |
Two points about mode selection. First, the hybrid mode is where the energy is, not the extremes — a plant that switches cleanly between full free cooling and full mechanical cooling but handles the shoulder badly will underperform its design estimate. Second, water efficiency and power efficiency trade directly against each other in the adiabatic and evaporative modes, so the plant needs an objective function that includes both, and increasingly a water constraint that is set by the site rather than by engineering preference.
10. Thermal Storage: How Many Seconds Does It Buy?
Thermal storage is described as a buffer for transients and for ride-through. It is worth quantifying, because the numbers are smaller than most people expect.
The stored capacity of a volume of water is its mass multiplied by specific heat multiplied by the temperature rise you are willing to accept before the racks are at risk. Divide by the heat load and you get the ride-through time.
| Buffer volume | Allowable rise 3 K | Allowable rise 5 K |
|---|---|---|
| 200 m³ | about 25 seconds | about 42 seconds |
| 500 m³ | about 63 seconds | about 105 seconds |
| 1,000 m³ | about 126 seconds | about 209 seconds |
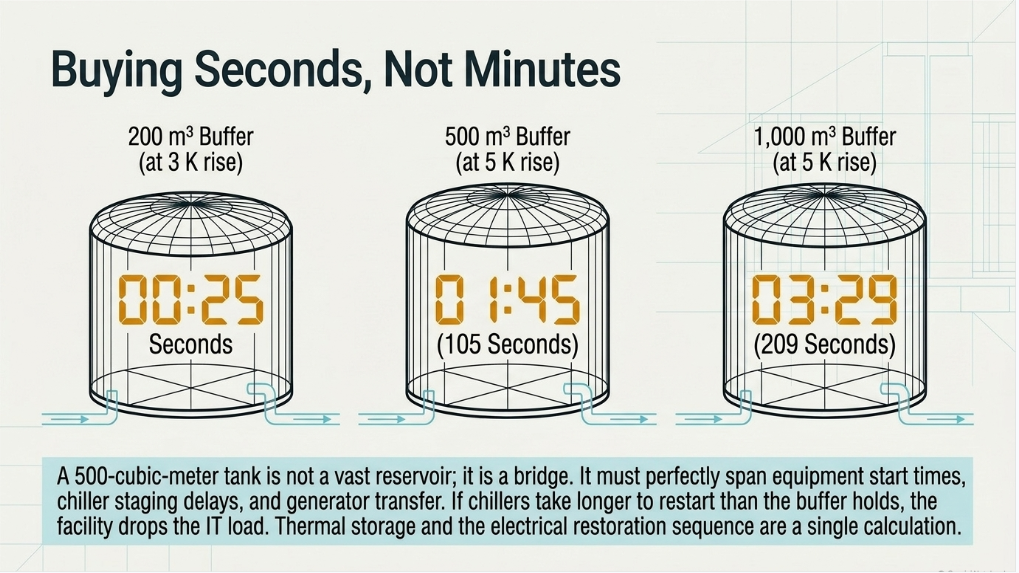
Those figures are at the full hundred megawatts. A five hundred cubic metre buffer — already a substantial tank — holds the load for under two minutes at five kelvin of rise. A thousand cubic metres, with a footprint and structural load to match, gets to about three and a half minutes.
That reframes what thermal storage is for. It is not a backup cooling system. It is a bridge across equipment start times, chiller staging delays and generator transfer, and it must be sized against those specific durations. The question to ask the design is not how much storage there is, but which event it is sized to cover and what the sequence is that has to complete before the buffer is exhausted.
It also means the buffer and the electrical restoration sequence are one calculation. If chillers take longer to restart and reload than the buffer holds, the storage volume is wrong or the restart sequence is.
11. The Cooling Plant Is a 20 MW Electrical Load
This is the section a mechanical treatment of the subject does not contain, and it is where a substantial share of the real failures live.
At a hundred megawatts of information technology load and a power usage effectiveness in the region of 1.15 to 1.25, the mechanical and electrical infrastructure draws roughly fifteen to twenty-five megawatts. Most of that is the cooling plant, and almost all of it is rotating machinery on variable frequency drives — chiller compressors, primary and secondary pumps, coolant distribution unit pumps, condenser and dry cooler fans.
That has consequences the thermal design does not address.
- Harmonic distortion. A large population of drives is a large population of harmonic current sources. Compliance is assessed as total demand distortion at the point of common coupling, and the aggregate of hundreds of drives plus the information technology rectifier load is a study, not an assumption. Mitigation — line reactors, passive filters, active front ends, transformer phase shifting — is a design decision with cost and footprint consequences that has to be made before the equipment is ordered.
- Motor starting and step loading. Sequential restart of a cooling plant onto generators is a step loading problem for the generator plant and a voltage dip problem for everything else on the bus. The restart sequence is an electrical study as much as a controls sequence.
- Drive ride-through. This is the important one and it has its own section below.
- Distribution architecture. The chillers, pumps and fans have to be distributed across electrical sources so that a single switchboard, feeder or transfer device cannot remove a whole redundancy group. This is the common mode question of Section 13, and it is answered on the single line diagram rather than in the mechanical schedule.
- Controls power. Plant controllers, coolant distribution unit controllers, valve actuators, sensors and the network between them are a small load with an outsized consequence. They belong on uninterruptible supply with the same rigour applied to the information technology load, and their network needs the same redundancy treatment.
12. Ride-Through: The Failure Mode Nobody Models
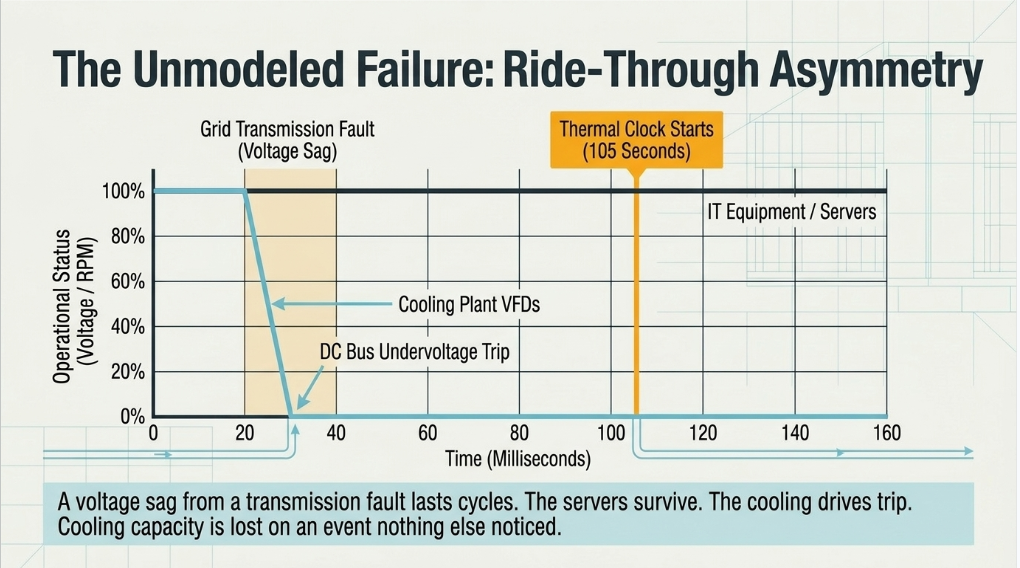
Modern information technology equipment rides through short voltage disturbances comfortably. The cooling plant that serves it frequently does not, and that asymmetry has already produced significant events on large campuses.
A voltage sag from a fault elsewhere on the transmission or distribution system lasts a few cycles and is cleared normally. The servers continue. But variable frequency drives serving pumps, fans and compressors have direct current bus undervoltage protection, and a sag deep enough or long enough will trip them. If a meaningful share of the cooling plant trips on a disturbance the information technology equipment did not notice, the thermal clock starts — and Section 10 says that clock runs for tens of seconds, not minutes.
The engineering response has several parts and all of them are decided at design.
- Specify drive ride-through capability. Drives can be specified with defined voltage sag ride-through, kinetic buffering that recovers energy from the rotating load during a dip, or controlled restart behaviour. This is a purchase specification item and it is frequently left to the vendor default.
- Coordinate protection so it does not defeat the ride-through. Undervoltage settings, contactor drop-out and control power arrangements can trip a load that the drive itself would have survived. Electromechanical control relays and contactors are often the weakest element in the chain.
- Design the restart. After a disturbance, whether drives restart automatically, in what order, and with what delay determines how quickly cooling capacity returns and whether the restart itself causes a second disturbance. Automatic restart is not the default on every drive.
- Study the site. The expected disturbance environment at the point of interconnection — fault levels, clearing times, expected sag depth and duration — is knowable from a power system study, and it is what the ride-through specification should be written against.
The test that is almost never performed
Integrated commissioning routinely tests loss of utility with transfer to generators. It much less often tests a voltage sag — a disturbance the site rides through electrically — and observes what the cooling plant does.
That is the event most likely to occur, and on a liquid cooled AI hall it is the event with the shortest time to consequence.
13. Redundancy Versus Common Mode
The observation that five redundant chillers on one switchboard are not redundant is correct and worth generalising, because the same pattern appears at every level of these plants.
| Apparent redundancy | The hidden dependency | Where it is found |
|---|---|---|
| N+1 chillers | A shared electrical switchboard, a shared condenser water loop, or a common controls network | The single line diagram and the network architecture, not the mechanical schedule |
| N+1 pumps | A common suction header with no isolation, or a shared variable frequency drive lineup | The piping and instrumentation diagram, checking valve arrangement for maintenance isolation |
| N+1 coolant distribution units | A shared secondary loop header where a single failure drains or depressurises the group | Hydraulic analysis of the failure case, not just unit count |
| Redundant heat rejection | A shared makeup water supply, a common water treatment system, or one fan power feeder | Utility and support systems, which are usually drawn last |
| Redundant controls | One network, one time source, or one supervisory server without which sequences do not run | The controls architecture drawing and the failure mode analysis |
| Redundant everything | A single physical route where all of it passes through one shaft, trench or room | Physical routing review, which is frequently never done |
The instrument that finds these is a system-level failure mode and effects analysis performed across disciplines, with the mechanical, electrical and controls designs on the table at the same time. Performed within one discipline it will confirm that discipline’s redundancy and miss every dependency that crosses a boundary — which is where they all are.
14. Controls Hierarchy and Workload-Aware Cooling
The layered control architecture — rack, coolant distribution unit, zone, plant, building management, and the information technology workload manager above it — is the right structure, and two points about it deserve emphasis.
14.1 Predictive Beats Reactive, With a Condition
Conventional cooling reacts to temperature, which means the plant only learns about a load step after the coolant has already warmed. Where the workload scheduler knows a large job is starting, pre-ramping pumps and staging capacity before the load arrives removes the temperature excursion entirely. That is a genuine advantage of the integration and it is being built.
The condition is that a predictive control loop is only as good as the prediction, and the failure mode of a plant that pre-ramps on a signal that does not arrive is wasted energy, while the failure mode of one that does not pre-ramp on a signal that does arrive is a thermal excursion. The control design needs to degrade gracefully to reactive operation when the workload signal is absent or wrong, and that fallback needs testing.
14.2 Compute as a Thermal Actuator
The reverse direction is the more powerful idea. When cooling capacity is lost, reducing or migrating workload reduces heat generation directly, which makes the information technology scheduler a control element in the thermal system.
It is also a commercial and organisational decision rather than purely a technical one. Someone has to own the policy that says compute is curtailed when cooling degrades, and the authority to execute it has to be pre-agreed rather than negotiated during an event. The engineering is straightforward; the governance is where these schemes stall
15. Fluid Chemistry and Filtration
Liquid cooling puts fluid inside the server, and the cleanliness and chemistry of that fluid become part of the reliability architecture rather than a maintenance topic.
Cold plate passages are small. Particulate that would be harmless in a chilled water system will block them, and once fouled, a cold plate is a component replacement inside a live rack. The controls that prevent it are loop separation at the coolant distribution unit, filtration sized and located to protect the secondary loop, and a cleanliness regime that starts at construction.
- Chemistry. Acidity, conductivity, glycol concentration, corrosion inhibitor levels, chlorides, hardness and biological growth all have limits, and the limits are set by the most sensitive material in the loop — frequently the cold plate itself. Mixed metallurgy across the loop is a corrosion problem waiting for an electrolyte, and the fluid is the electrolyte.
- Filtration. Differential pressure across filters is an early warning instrument, not just a maintenance indicator. A rising filter differential is telling you something is generating particulate.
- Commissioning sequence. Flush, filter, sample, verify, then operate, with trending from the first day. Fluid quality that is only measured when there is a problem has no baseline to compare against.
- Leak detection and response. Liquid in a live data hall is the defining risk of this architecture. Detection at rack, unit and zone level, with a defined isolation response and valving that makes isolation possible without dropping a wider group, is a design requirement rather than an accessory.
16. Commissioning the Whole Thermal Chain
Commissioning progresses from component through subsystem to integrated operation, and on a plant of this type the integrated stage is where the value is. Every failure discussed in this paper is a system-level failure that a component test will pass.
The failure scenarios worth executing deliberately:
- Coolant distribution unit trip at full load, with the surviving units picking up the zone and the rack temperatures held.
- Secondary and primary pump trips, measuring not whether the standby starts but how long capacity stayed below requirement.
- Chiller trip with capacity recalculation and staging of standby capacity.
- Heat rejection unit and fan failure, and mode transition from free cooling to hybrid to mechanical under load.
- Control valve and sensor failure, including the failed-sensor behaviour of every control loop that depends on it.
- Controls network loss and supervisory system loss, verifying what the plant does when it stops being coordinated.
- Utility loss with transfer to generators, timed against the buffer capacity from Section 10.
- A voltage sag rather than a full outage — the scenario from Section 12, which is the most likely and least tested.
- A rapid workload step, both up and down, with the plant response and any predictive pre-ramp exercised.
And trend everything through all of it. Power, flows, temperatures, differential pressures, pump and fan speeds, chiller loading and efficiency, valve positions, outdoor conditions and storage state, on a common time base. A plant that is not instrumented to be understood as one system cannot be optimised as one.
17. Reading the Source Material Correctly
The flow arithmetic is right
Roughly 2,390 kilograms per second, 2,400 litres per second, 38,000 gallons per minute for a hundred megawatts across ten kelvin. That checks out, and stating it is more useful than most treatments manage.
But the rejection duty is not 100 MW
In mechanical cooling the condenser rejects the load plus the compressor work — fifteen to twenty-five percent more depending on coefficient of performance. Sizing heat rejection to the information technology load understates it by several equipment modules.
The flow figure is a campus total, not a pipe
Thirty-eight thousand gallons per minute in one header is a forty-inch pipe. The number describes an aggregate that the architecture then distributes across loops, zones and a large coolant distribution unit population, and the balancing of that distribution is a real design problem.
The affinity cube is optimistic as stated
Power varies with the cube of speed along a system curve through the origin. Differential pressure control means the pump follows a control curve that does not, so savings are real but less than cubic. Sensor placement and setpoint reset are where the difference is recovered.
Thermal storage should be quoted in seconds
Buffer volume is a bridge across restart and staging times, not a backup cooling system. Quoting it as a volume invites the wrong mental model; quoting it as ride-through seconds at full load against a named event makes it designable.
The temperature chain is the missing analysis
Free cooling hours are not a climate property. They are the arithmetic result of every approach temperature between ambient air and the processor junction, and the acceptable cold plate inlet temperature is the parameter with the most leverage over annual energy.
The electrical design is where it fails
The observation about five chillers on one switchboard is exactly right and it generalises. The cooling plant is a large drive-dominated electrical load whose ride-through behaviour, restart sequence, harmonic contribution and distribution architecture determine whether the thermal design ever gets to perform.
18. Keentel Data Center Engineering Services
Keentel Engineering is an electrical power systems engineering firm. On liquid cooled AI campuses our work sits where the thermal design meets the electrical and control systems that make it survivable — and, upstream of that, on getting the campus connected in the first place.
18.1 Interconnection and Power Delivery
- Large load interconnection engineering and application support, study-phase technical packages, and coordination with the utility, transmission provider and system operator.
- Point-of-interconnection and substation design, on-site generation and storage integration, and campus medium-voltage distribution architecture.
- Load flow, short-circuit, protective coordination, arc-flash, motor starting and reactive capability studies across the campus and the mechanical plant.
18.2 The Cooling Plant as an Electrical System
- Electrical distribution design for the mechanical plant, arranged so that redundancy groups do not share switchboards, feeders, transfer devices or routes.
- Harmonic studies covering the aggregate drive population and the information technology rectifier load, with compliance assessed as total demand distortion at the correct point and mitigation specified before procurement.
- Voltage sag ride-through specification for drives, protection and control power, written against a studied site disturbance environment rather than a vendor default.
- Restart and step-loading analysis for generator transfer and post-disturbance recovery, timed against the thermal buffer capacity.
- Controls power and network resilience design for plant, zone and unit controllers, actuators and instrumentation.
18.3 System-Level Analysis and Assurance
- Cross-discipline failure mode and effects analysis covering mechanical, electrical and controls together, which is the only way common-mode dependencies are found.
- Thermal ride-through analysis linking buffer volume, allowable temperature rise, equipment restart times and the electrical restoration sequence into one calculation.
- Review of cooling plant sizing basis including heat rejection duty at mechanical cooling conditions, delta-T selection and its hydraulic consequences, and the approach temperature chain that sets free cooling hours.
- Design review of mechanical, electrical and controls packages, and QA/QC of third-party studies and models.
18.4 Commissioning and Operations Support
- Integrated commissioning specification and test procedure development across the full thermal and electrical chain, including the voltage sag and workload step scenarios most programmes omit.
- Witness and verification support, trending architecture design, and acceptance criteria written so that results are measurable rather than observed.
- Owner’s engineer services through design, procurement, construction and handover.
- Performance investigation where a plant is not achieving its design energy, is tripping on disturbances, or has experienced a thermal event.
Keentel Engineering holds a Florida Certificate of Authorization and maintains offices in Tampa, Austin, Sacramento, and Baltimore, supporting projects across the interconnections.
19.References and Further Reading
The following are referenced by subject in the body of this document. The current published edition of each standard or guideline governs its own content, and equipment manufacturers’ published data governs any application decision for specific equipment.
Liquid Cooling and Data Center Thermal Design
- ASHRAE Technical Committee 9.9 publications on liquid cooling guidelines for datacom equipment, including the facility water supply temperature classes used to define liquid cooling operating windows — ASHRAE
https://www.ashrae.org/technical-resources/bookstore/datacom-series - ASHRAE Thermal Guidelines for Data Processing Environments, and the associated guidance on water quality requirements for liquid cooled information technology equipment — ASHRAE
https://www.ashrae.org/ - Open Compute Project and equipment manufacturer specifications for coolant distribution units, cold plates, manifolds and quick disconnects, including fluid quality and filtration requirements — Open Compute Project and equipment manufacturers
https://www.opencompute.org/ - ASHRAE Standard 90.4, Energy Standard for Data Centers, and ASHRAE Standard 90.1 for the associated mechanical and electrical efficiency requirements — ASHRAE
https://www.ashrae.org/
Design, Commissioning, and Reliability
- Uptime Institute Tier Standard: Topology and Tier Standard: Operational Sustainability, and the associated fault tolerance and concurrent maintainability concepts — Uptime Institute
https://uptimeinstitute.com/ - ANSI/TIA-942, Telecommunications Infrastructure Standard for
Data Centers, and ASHRAE Guideline 0 and ASHRAE Guideline 1.1 for the commissioning process — TIA and ASHRAE
https://www.ashrae.org/ - IEC 60812, Failure modes and effects analysis, for the cross-discipline analysis described in Section 13 — International Electrotechnical Commission
https://webstore.iec.ch/
Electrical Systems and Power Quality
- IEEE Std 519, Standard for Harmonic Control in Electric Power Systems, and IEEE Std 3002.8 for harmonic studies — IEEE Standards Association
https://standards.ieee.org/ieee/519/10677/ - IEEE Std 1159, Recommended Practice for Monitoring Electric Power Quality, and IEEE Std 1668 for voltage sag immunity of equipment, together with the SEMI F47 voltage sag immunity specification — IEEE Standards Association and SEMI
https://standards.ieee.org/ - IEEE Std 3002.3 for short-circuit studies, IEEE Std 3002.7 for motor starting and voltage drop studies, IEEE Std 1584 for arc-flash calculation, and IEEE Std 3006 series for power system reliability analysis — IEEE Standards Association
https://standards.ieee.org/ - NFPA 70, National Electrical Code, and NFPA 70E, Standard for Electrical Safety in the Workplace — National Fire Protection Association
https://www.nfpa.org/
20. Frequently Asked Questions
Q1. Does a 100 MW IT load really produce 100 MW of heat?
Essentially yes — almost all electrical energy delivered to the servers ends up as heat. But the heat rejection equipment does not size to that number, because pump and fan work adds to the loop and, in mechanical cooling, the compressor work appears at the condenser on top of the evaporator load.
Q2. So what does the heat rejection equipment size to?
Evaporator load multiplied by one plus the reciprocal of the coefficient of performance. At a COP of five that is 120 MW; at four it is 125 MW. Sizing towers, dry coolers or condensers to 100 MW understates the duty by fifteen to twenty-five percent, which on a plant this size is several modules.
Q3. Is the 2,390 kg/s flow figure correct?
Yes. A hundred megawatts divided by specific heat of about 4.19 kilojoules per kilogram-kelvin times ten kelvin gives 2,389 kilograms per second, close to 2,400 litres per second or about 38,000 gallons per minute at near-unity density.
Q4. Can that flow go through one pipe?
Not practically. At eight to twelve feet per second it needs a header of thirty-six to forty-four inches. The architecture distributes it instead — multiple loops, zone headers, and a large population of coolant distribution units each handling a manageable fraction.
Q5. Why is delta-T described as the most powerful lever?
Because flow is inversely proportional to it, and pump power varies with roughly the cube of flow on a given piping system. Doubling delta-T from ten to twenty kelvin halves flow and cuts pump power by close to a factor of eight, on the same pipework.
Q6. Is there a second benefit?
Yes. At a fixed supply temperature, a larger delta-T means a higher return temperature, and warmer return water is easier to reject to ambient air. The same decision that shrinks the pumps also widens the free cooling window.
Q7. What limits how far delta-T can be pushed?
The silicon. Higher delta-T at fixed supply means the coolant leaves the cold plate hotter, and eventually the last processor in the flow path runs too close to its temperature limit. Delta-T is optimised against the full temperature budget, not chosen freely.
Q8. Does using glycol change the calculation?
Yes. Glycol has lower specific heat — around 3.9 kilojoules per kilogram-kelvin at twenty-five percent propylene glycol — so roughly seven percent more mass flow is needed for the same duty, and about fifteen percent more at forty percent concentration.
Q9. Is that the main penalty?
No, the larger effects are hydraulic and thermal. Glycol raises viscosity substantially at low temperature, increasing friction losses beyond the flow increase alone, and reduces the convective heat transfer coefficient, degrading every heat exchanger and cold plate in the path. Use the lowest concentration that protects the exposed portion of the system.
Q10. What determines whether a site can free cool?
The sum of every approach temperature between ambient air and the processor junction: the heat rejection coil approach, piping and mixing, the plate heat exchanger approach at the coolant distribution unit, distribution losses, and the cold plate approach plus coolant rise. Add them from the processor limit backwards and the result is the highest ambient temperature that supports compressorless operation.
Q11. Why does warm-water cooling change the economics so much?
Because it moves the whole temperature budget upward. Traditional chilled water delivers coolant well below ambient for most of the year, so compressors run most of the time. Direct liquid cooling to silicon tolerates far warmer supply, and every kelvin the equipment will accept converts directly into free cooling hours.
Q12. Does an extra heat exchanger for fluid separation cost anything?
Yes — approach temperature, every hour of the year, plus pressure drop and pump work. Separation is often still worth it, particularly to confine glycol to the exposed circuit or to protect the secondary loop, but it is a trade rather than a free safety measure.
Q13. Do variable speed pumps really save power with the cube of speed?
Not quite. The cube relationship holds along a system curve through the origin — pure friction. Real plants control to a differential pressure setpoint, so the pump follows a control curve that does not pass through the origin and power falls less steeply. The savings are real but smaller than the affinity laws alone suggest.
Q14. How do you recover the difference?
Sensor placement and setpoint reset. A differential pressure sensor at the pump discharge yields almost nothing; one at the hydraulically most remote load yields most of the available saving. Resetting the setpoint downward until the most open control valve approaches full open recovers much of the rest.
Q15. Which cooling mode matters most for annual energy?
The hybrid or partial economisation mode, because in most climates the shoulder conditions dominate the hours. A plant that switches cleanly between full free cooling and full mechanical cooling but handles the shoulder badly will miss its design energy estimate.
Q16. How much ride-through does thermal storage actually provide?
Less than most people assume. At a hundred megawatts, a five hundred cubic metre buffer with five kelvin of allowable rise holds the load for about 105 seconds. Two hundred cubic metres at three kelvin is about 25 seconds. A thousand cubic metres at five kelvin reaches roughly three and a half minutes.
Q17. So what is thermal storage for?
Bridging specific durations — equipment start times, chiller staging delays, generator transfer and reload. It is not a backup cooling system. The right question is not how much storage there is, but which event it covers and what sequence has to complete before it is exhausted.
Q18. How large an electrical load is the cooling plant?
At a hundred megawatts of IT load and a power usage effectiveness around 1.15 to 1.25, mechanical and electrical infrastructure draws roughly fifteen to twenty-five megawatts, most of it cooling, and almost all of it rotating machinery on variable frequency drives.
Q19. Why does that matter beyond the energy bill?
Because a large drive population is a large harmonic current source requiring a study and probably mitigation, a step-loading problem on generator restart, and — most importantly — a population of devices with undervoltage protection that can trip on disturbances the servers ride through.
Q20. What is the voltage sag failure mode?
A fault elsewhere on the network causes a sag lasting a few cycles, cleared normally. The IT equipment continues. But drive DC bus undervoltage protection may trip pumps, fans and compressors. Cooling capacity is lost on an event nothing else noticed — and the thermal clock from Question 16 runs in tens of seconds.
Q21. How is that addressed?
Specify drive ride-through capability, including kinetic buffering where appropriate, rather than accepting vendor defaults. Coordinate undervoltage protection, contactors and control power so they do not trip a load the drive would have survived. Design the automatic restart order and delay. And write all of it against a studied site disturbance environment.
Q22. What is usually missing from integrated commissioning?
The voltage sag test. Programmes routinely test loss of utility with generator transfer, and much less often test a disturbance the site rides through electrically to see what the cooling plant does. That is the most likely event and, on a liquid cooled hall, the one with the shortest time to consequence.
Q23. How do you find common-mode failures?
A cross-discipline failure mode and effects analysis with mechanical, electrical and controls designs on the table together. Performed within one discipline it confirms that discipline’s redundancy and misses every dependency that crosses a boundary — which is where they all are. Physical routing review belongs in it too.
Q24. Is workload-aware cooling worth building?
The predictive direction is genuinely valuable — pre-ramping before a known load step removes the temperature excursion entirely. It needs a graceful fallback to reactive control when the workload signal is absent or wrong, and that fallback needs testing. The reverse direction, curtailing compute when cooling degrades, is technically straightforward and stalls on governance rather than engineering.
Q25. What is the single most consequential design decision?
The acceptable cold plate inlet temperature, negotiated with the equipment vendor. It sets the whole temperature budget, which sets the free cooling hours, which sets annual energy and determines whether chillers are a backstop or the primary cooling mode. It is treated as a specification detail and it is an energy decision.
Notice and Disclaimer
This document is original technical content prepared by Keentel Engineering LLC for general professional information. It is not project-specific engineering advice and does not constitute a design, a study, an equipment selection, or a capacity determination for any facility. Cooling plant and electrical system design must be developed from project-specific analysis using verified load, climate, equipment and site data.
Worked figures in this document are calculated for a stated illustrative case — a hundred megawatt load with water-based coolant at the temperature differences, buffer volumes and coefficients of performance named in the text — for the purpose of demonstrating method and order of magnitude. They are not design values for any facility. Fluid properties, approach temperatures, efficiency figures and ride-through durations vary with equipment selection, fluid composition, ambient conditions and operating point, and must be established from manufacturer data and project-specific calculation.
Mechanical, thermal and process descriptions in this paper are provided as engineering context. Keentel Engineering LLC provides electrical power systems engineering services; mechanical and process design should be undertaken by appropriately licensed professionals in those disciplines.
Keentel Engineering LLC is an independent engineering consultancy. Reference to any standard, code, industry organisation, regulator, or equipment category in this document does not imply affiliation with, endorsement by, or sponsorship from any such organisation or manufacturer.

About the Author:
Sandip "Sonny" R. Patel, P.E.
IEEE Senior Member · Founder & CEO, Keentel Engineering
In 1995, Sonny Patel earned his Electrical Engineering degree from the University of Illinois. But degrees don't build legacies — action does.
For three decades, he has worked the power industry from every side of the table: 16 years as a utility engineer at Exelon/Commonwealth Edison; generation leadership across hydroelectric, industrial steam turbine, and a 9 GW renewable fleet; NERC Regional Entity Senior Compliance Engineer and Audit Team Lead, auditing some of the nation's largest utilities; and testing and commissioning lead on equipment up to 765 kV — the very top of the North American grid.Utility. Generator. Regulator. Consultant. Few engineers have seen all four seats. Fewer still have sat in them.
His experience spans nuclear, hydro, conventional generation, renewables, oil and gas, mining — and today's data centers, where he is authoring a three-book series on data center design. He is a Licensed Professional Engineer in six states and a Licensed Electrical Contractor in Florida (Unlimited EC) — he doesn't just design the work; he's qualified to stand behind its execution.Today, as Founder and CEO of Keentel Engineering, Sonny leads a nationwide team of engineers delivering substation design, power system studies, NERC compliance, and commissioning — done right, coast to coast.Three decades. Every side of the table. One standard: accountable engineering.
Services

Let's Discuss Your Project
Let's book a call to discuss your electrical engineering project that we can help you with.
About the Author:
Sandip "Sonny" R. Patel, P.E.
IEEE Senior Member · Founder & CEO, Keentel Engineering
In 1995, Sonny Patel earned his Electrical Engineering degree from the University of Illinois. But degrees don't build legacies — action does.
For three decades, he has worked the power industry from every side of the table: 16 years as a utility engineer at Exelon/Commonwealth Edison; generation leadership across hydroelectric, industrial steam turbine, and a 9 GW renewable fleet; NERC Regional Entity Senior Compliance Engineer and Audit Team Lead, auditing some of the nation's largest utilities; and testing and commissioning lead on equipment up to 765 kV — the very top of the North American grid.
Utility. Generator. Regulator. Consultant. Few engineers have seen all four seats. Fewer still have sat in them.
His experience spans nuclear, hydro, conventional generation, renewables, oil and gas, mining — and today's data centers, where he is authoring a three-book series on data center design. He is a Licensed Professional Engineer in six states and a Licensed Electrical Contractor in Florida (Unlimited EC) — he doesn't just design the work; he's qualified to stand behind its execution.
Today, as Founder and CEO of Keentel Engineering, Sonny leads a nationwide team of engineers delivering substation design, power system studies, NERC compliance, and commissioning — done right, coast to coast.Three decades. Every side of the table. One standard: accountable engineering.
Leave a Comment
Thank you for contacting us.
We will get back to you as soon as possible.
We will get back to you as soon as possible.
Oops, there was an error sending your message.
Please try again later.
Please try again later.
Related Posts
By SANDIP R PATEL
•
October 20, 2026
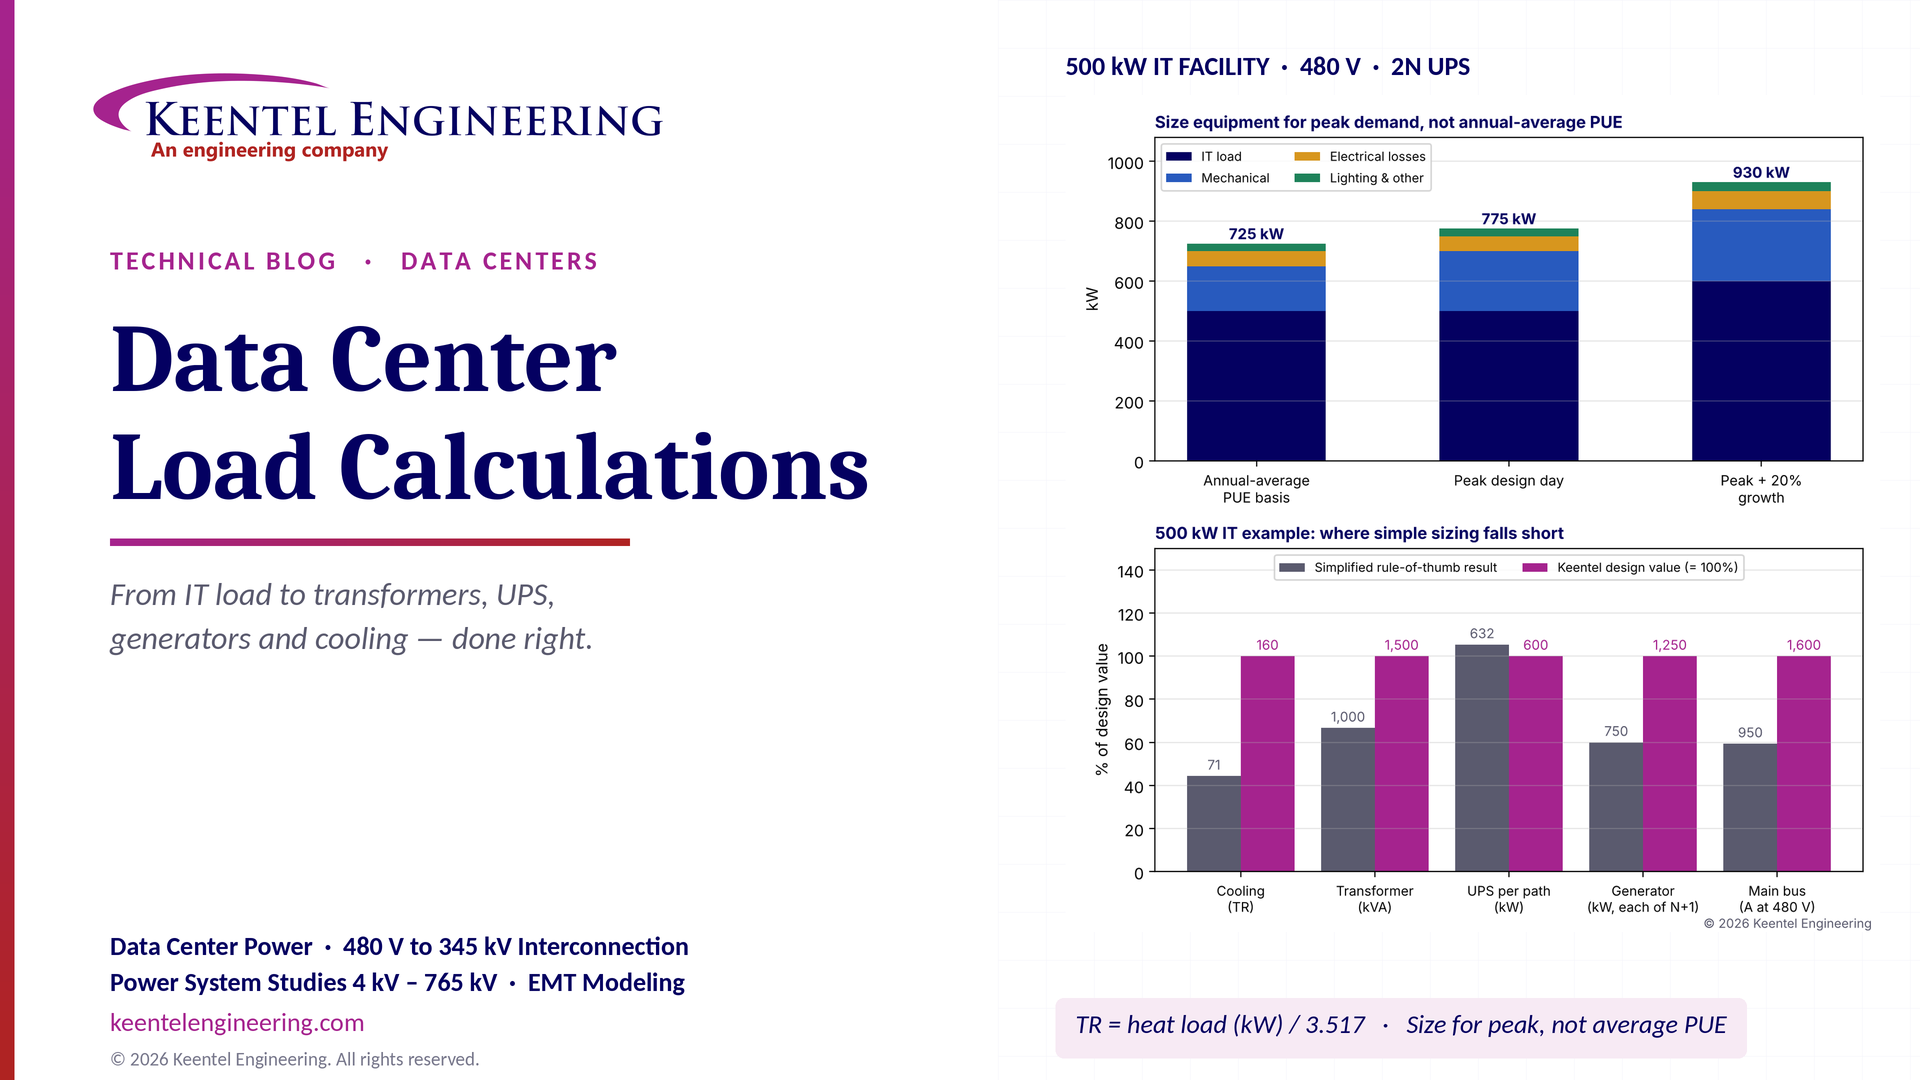
Learn data center electrical load calculations, including IT demand, PUE, UPS and generator sizing, cooling loads, redundancy, and worked US examples.
By SANDIP R PATEL
•
October 20, 2026
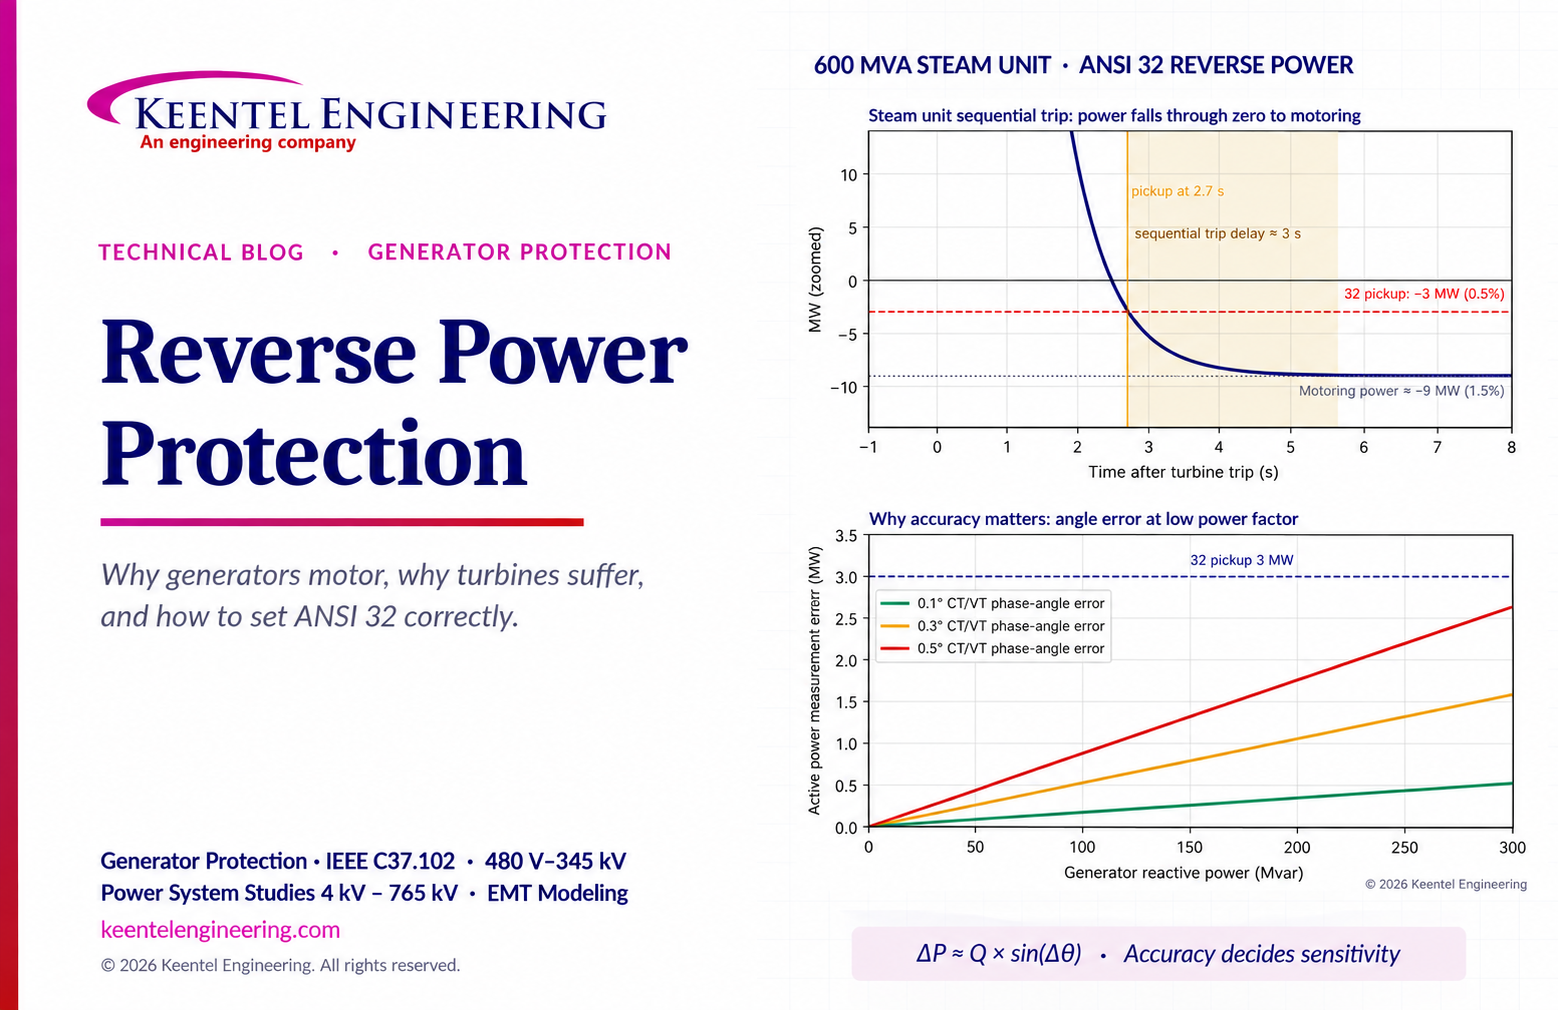
Learn reverse power protection (ANSI 32), generator motoring, relay pickup settings, time delays, sequential tripping and testing for US power plants.
Copy
By Team 2 Dexora
•
October 20, 2026
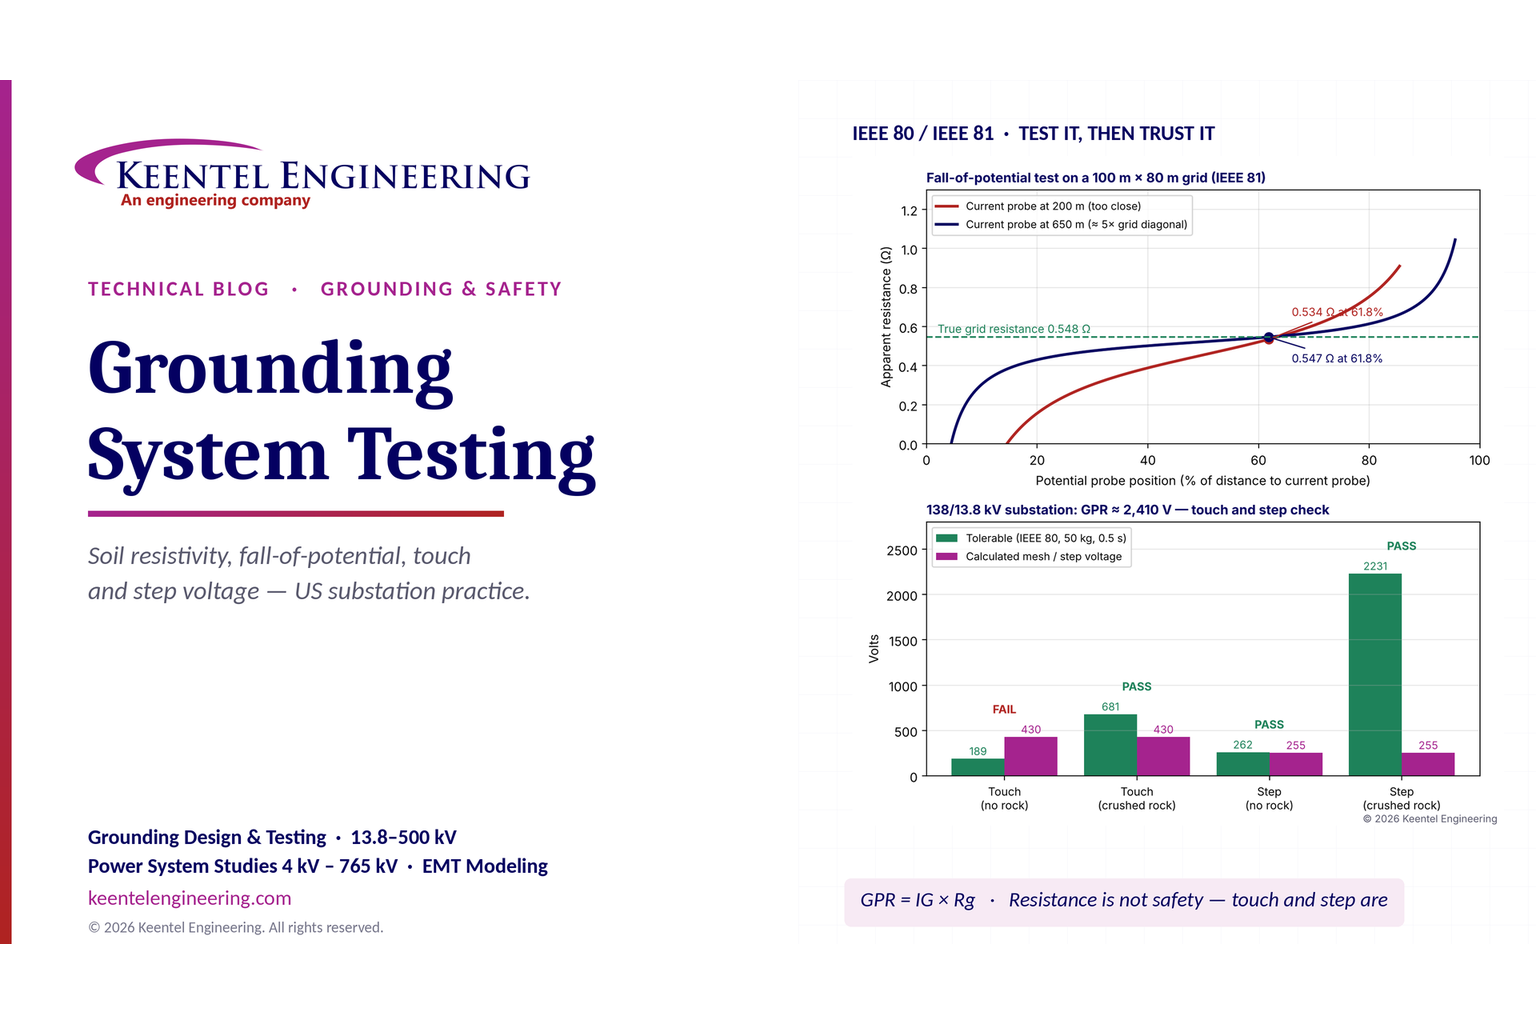
Explore grounding system testing with Keentel Engineering. Learn IEEE 80/81 methods, soil resistivity, ground resistance, and touch and step voltage safety.
By SANDIP R PATEL
•
October 13, 2026
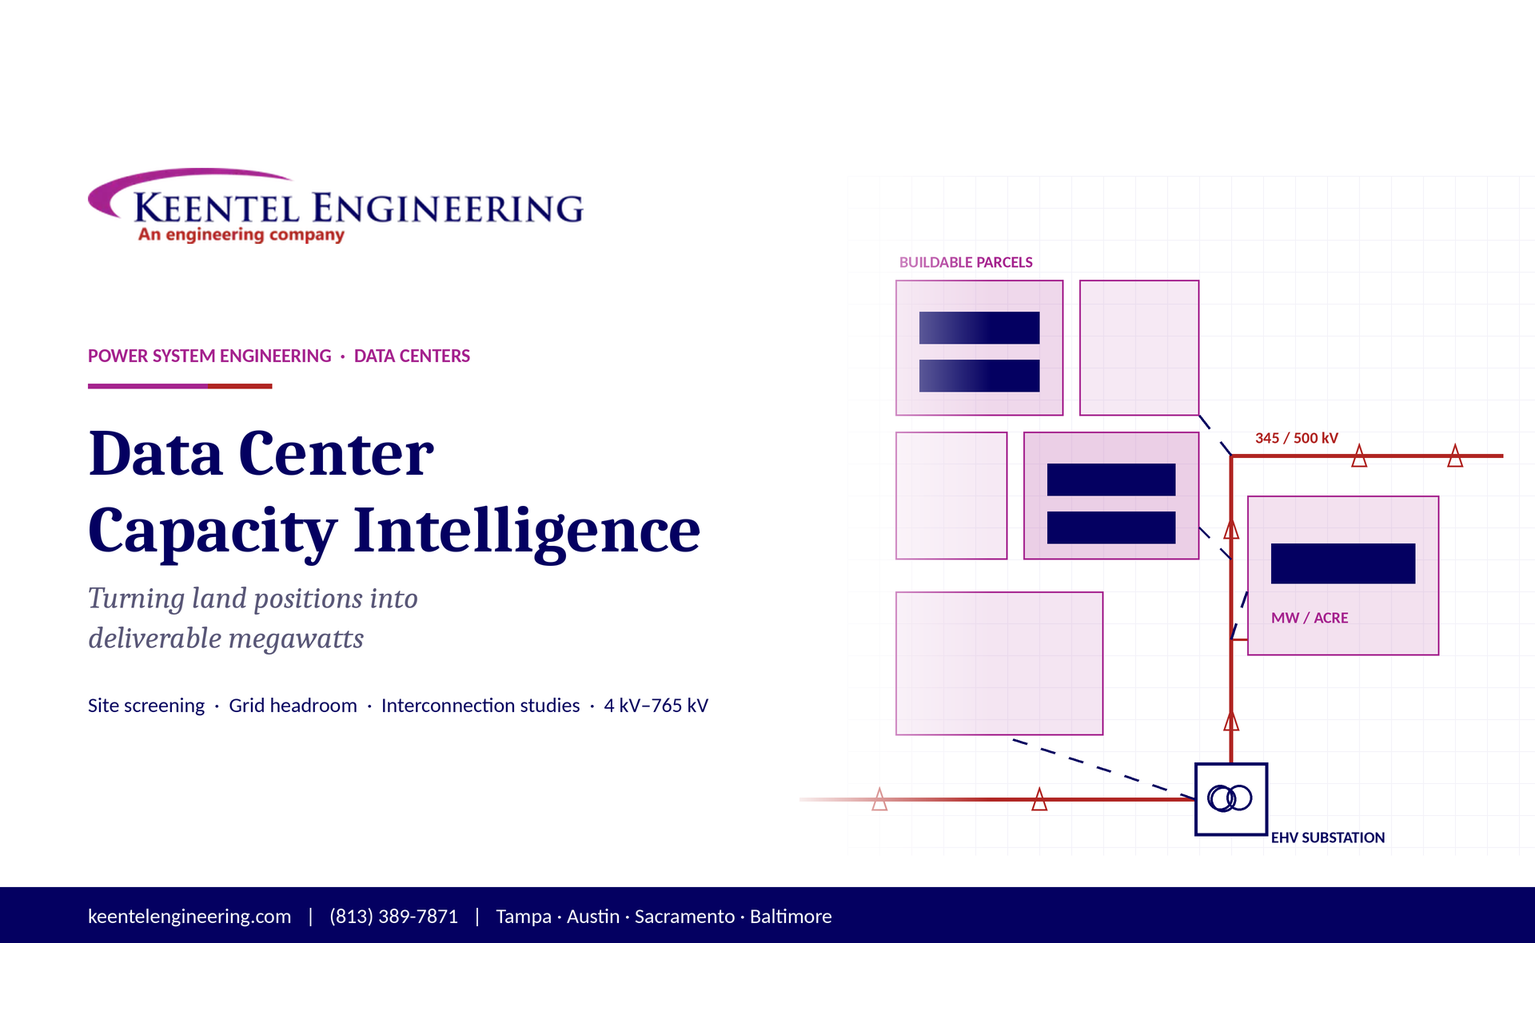
Plan data center capacity with land screening, MW-per-acre estimates, grid power availability and interconnection feasibility studies from Keentel Engineering.
By SANDIP R PATEL
•
October 11, 2026
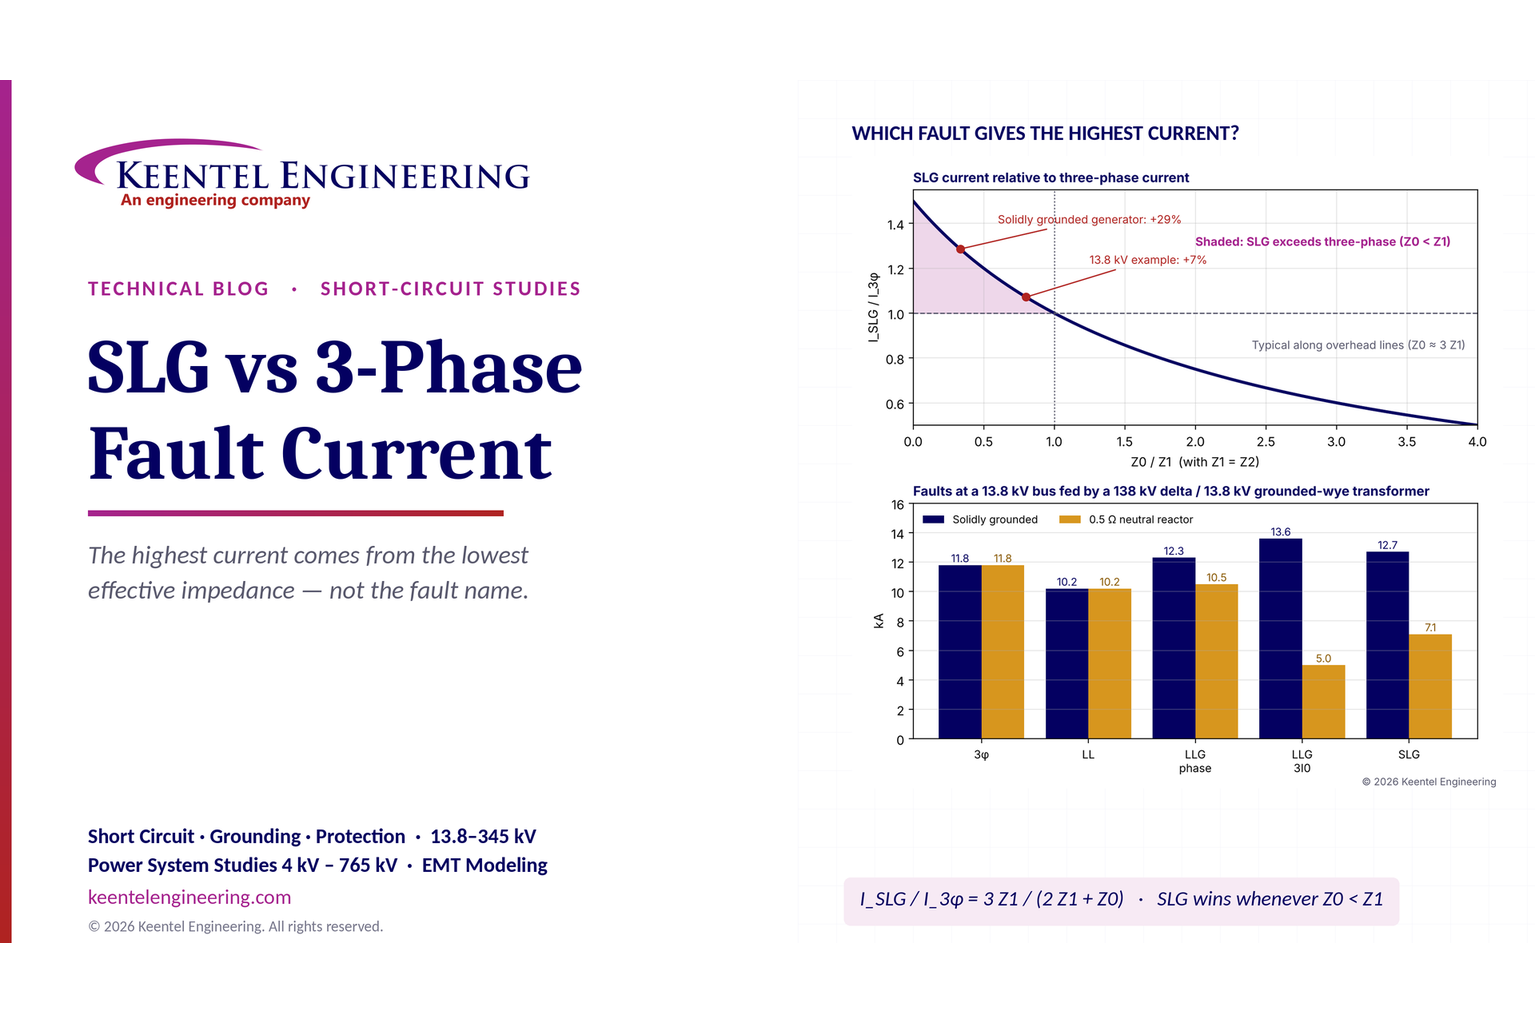
Learn which fault produces the highest current at a bus, why SLG faults can exceed three-phase faults, and how symmetrical components determine fault duty.
By SANDIP R PATEL
•
October 11, 2026
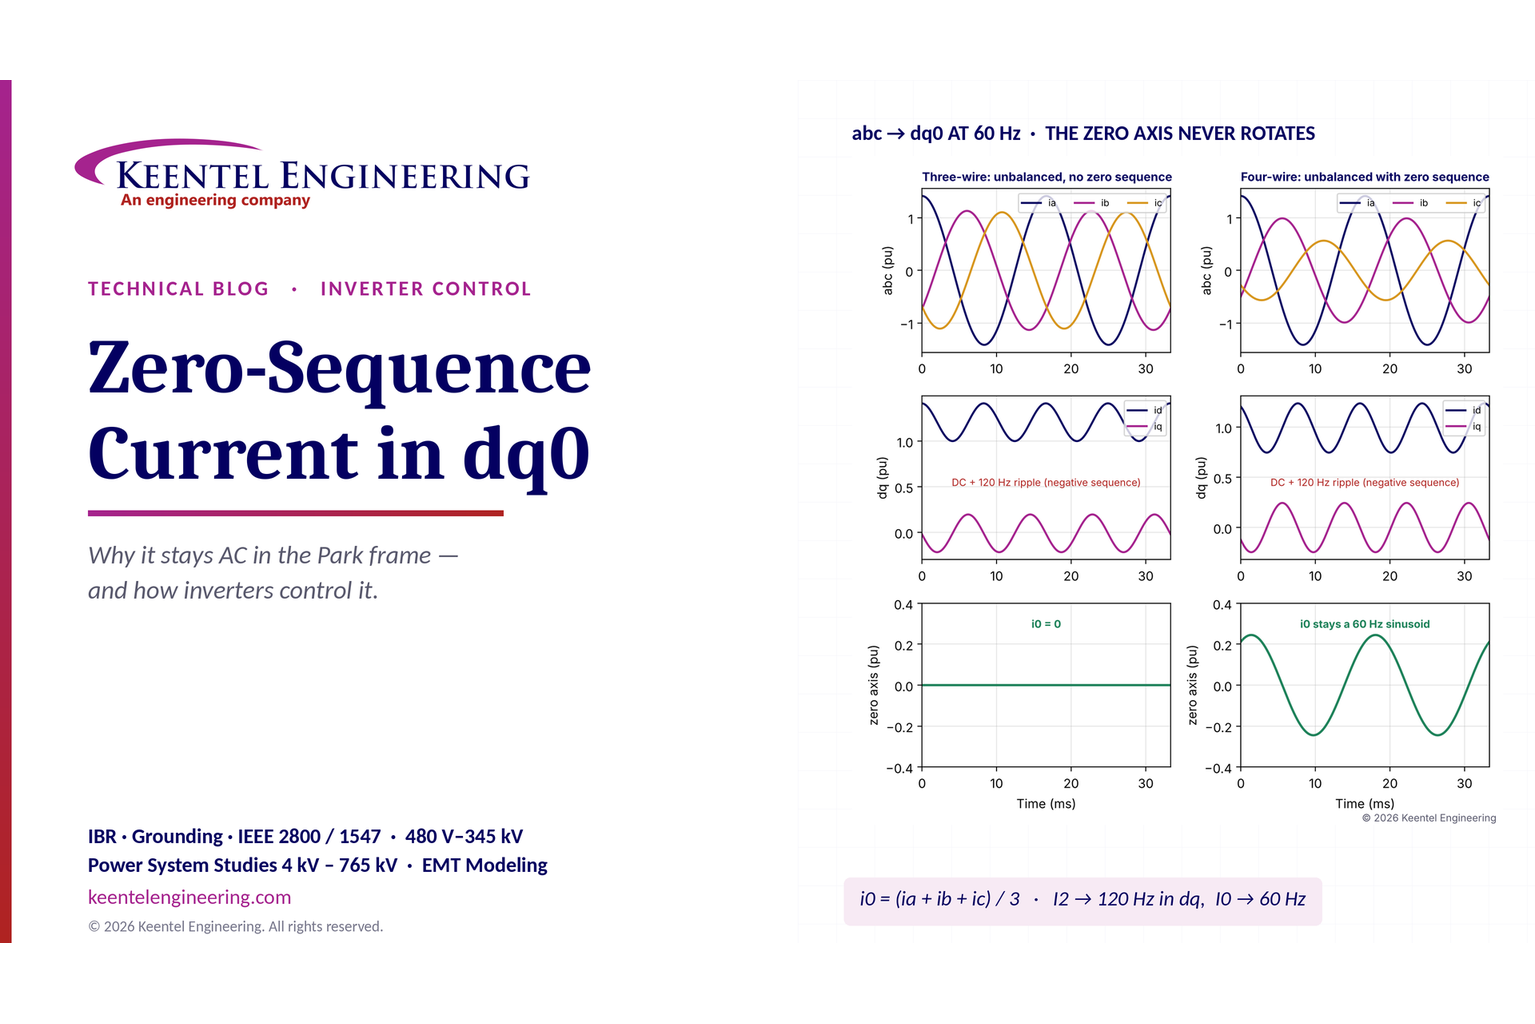
Learn why zero-sequence current pulsates in the dq0 frame, how Park's transformation works, and how inverter controls handle unbalance and ground faults.
By SANDIP R PATEL
•
October 11, 2026
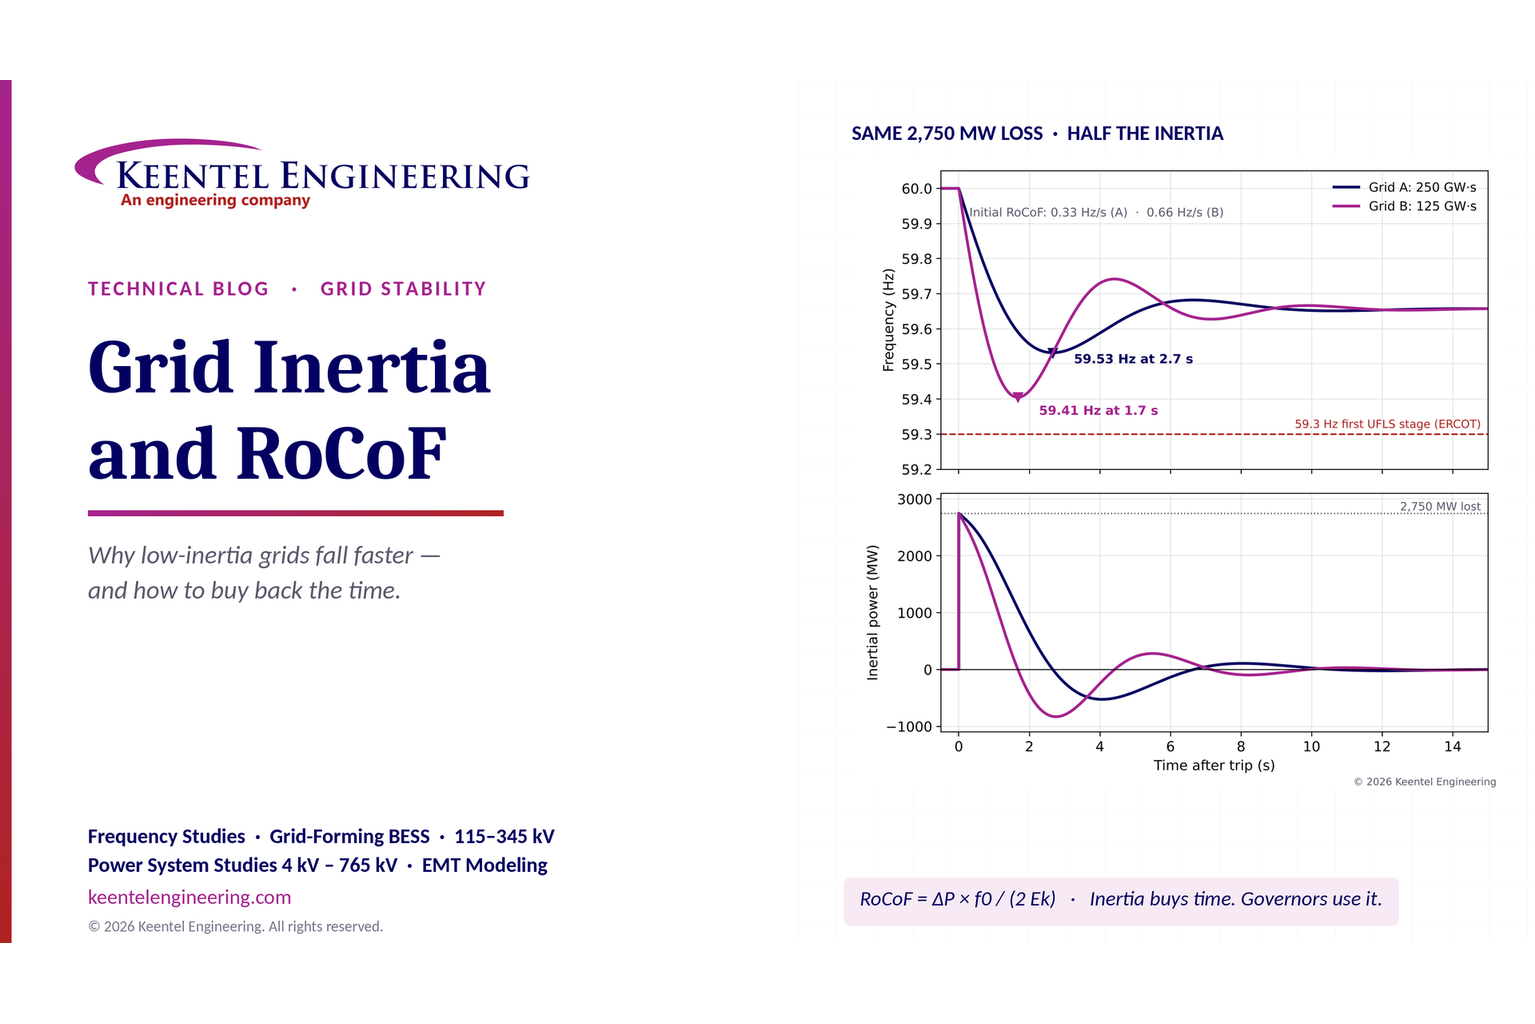
Explore grid inertia, RoCoF and frequency response, with swing equation calculations, frequency nadir analysis and US power system simulation examples.
By SANDIP R PATEL
•
October 11, 2026
Learn transient stability analysis, swing equation, equal-area criterion and critical clearing time with a 345 kV worked example and NERC TPL-001 guidance.
By SANDIP R PATEL
•
October 11, 2026
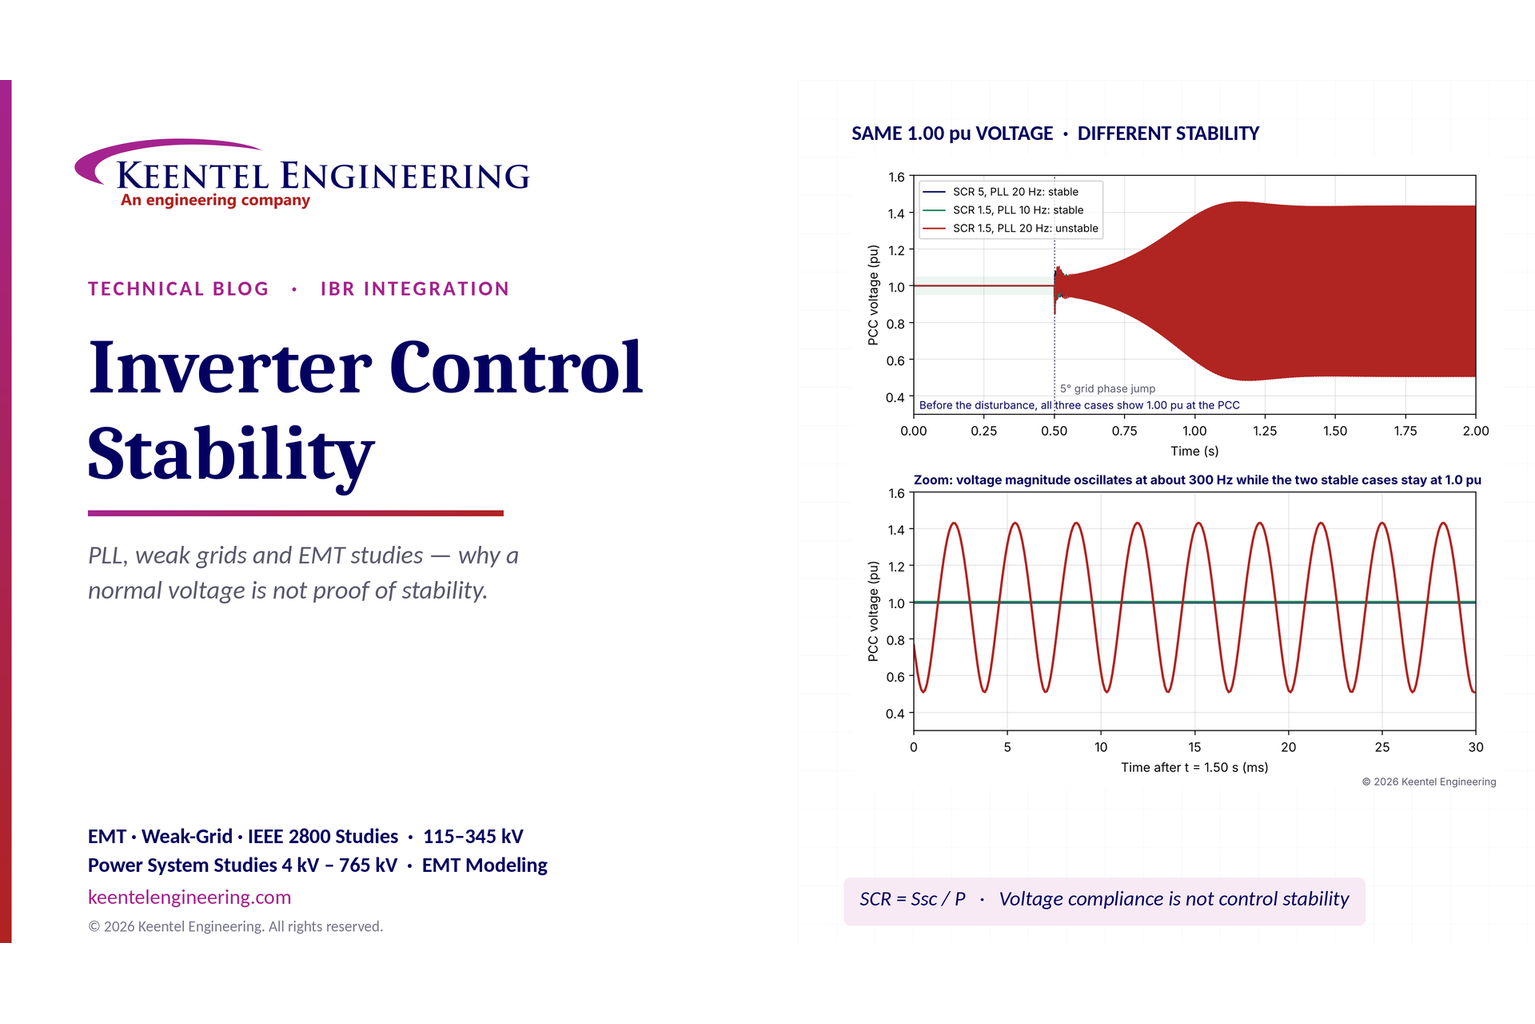
Learn why inverter controls become unstable in weak grids, how PLL bandwidth and SCR affect stability, and how PSCAD EMT studies identify and mitigate oscillations.





