A Coordinated Electric System Interconnection Review—the utility’s deep-dive on technical and cost impacts of your project.
Challenge: Frequent false tripping using conventional electromechanical relays
Solution: SEL-487E integration with multi-terminal differential protection and dynamic inrush restraint
Result: 90% reduction in false trips, saving over $250,000 in downtime
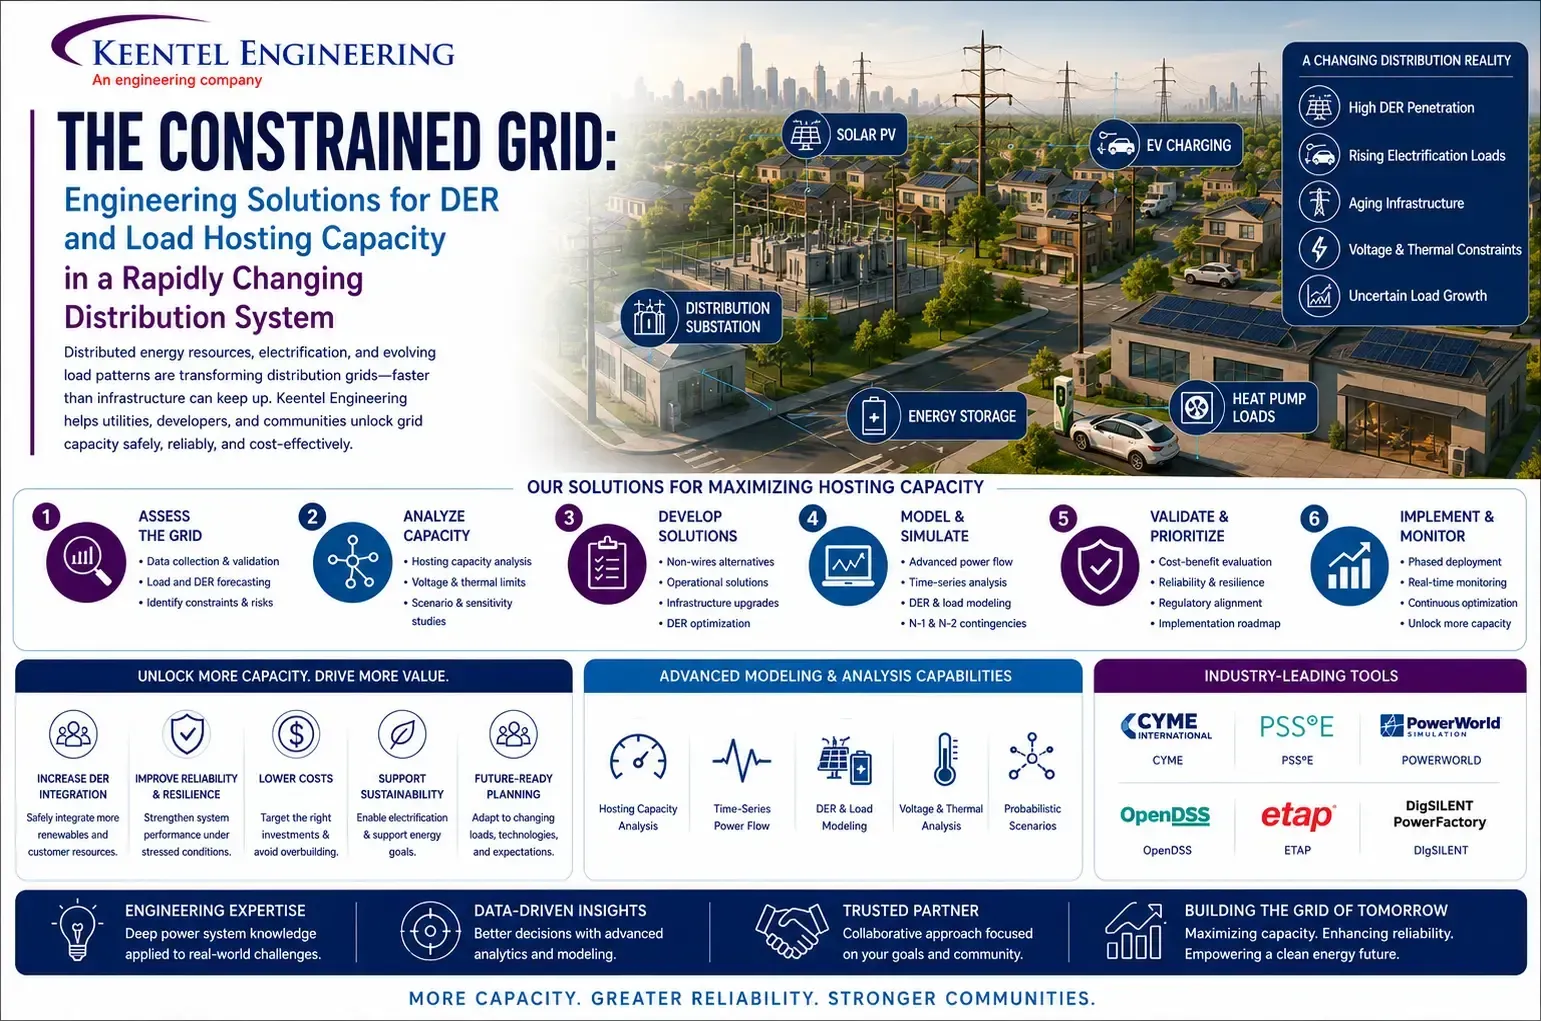
The Constrained Grid: Engineering Solutions for DER and Load Hosting Capacity in a Rapidly Changing Distribution System
May 17, 2026 | Blog
Introduction: A Distribution Grid Under Unprecedented Pressure
The distribution grid was designed for a world that no longer exists. Built to move power in one direction — from substation to customer — it now faces a fundamentally different operating environment. Rooftop solar generates in the middle of the day, reversing power flow on circuits designed for unidirectional current. Electric vehicle chargers add concentrated, unpredictable loads to residential feeders that were sized for modest household demand. Community solar installations cluster at substations where land is available, not where the grid has capacity. And behind the meter energy storage adds yet another layer of variable, bidirectional power exchange.
The consequence is congestion — not the visible congestion of traffic, but the invisible congestion of thermal overloads, voltage violations, and hosting capacity limits that are forcing utilities to tell developers and customers: the grid cannot accommodate more, not here, not yet, without significant infrastructure investment.
At Keentel Engineering, we help utilities, developers, and regulators navigate this challenge with engineering rigor and practical clarity. This brief synthesizes the current state of distribution hosting capacity, the two primary technical strategies for increasing it — flexible interconnection and power flow control — and the modeling and planning methodology that makes both work in practice.
Understanding Hosting Capacity: What It Measures and Why It Matters
The Definition and Its Limits
Hosting capacity is defined as the maximum amount of distributed energy resource (DER) or additional load that can be connected to a specific point on the distribution system — without causing voltage or thermal violations under the current network configuration and without requiring infrastructure upgrades. It is typically expressed in kW or MVA for each feeder segment, and it is published by many utilities as a map that DER developers and large load customers use to identify favorable interconnection locations.
The hosting capacity figure is not a guarantee of interconnection. It is a screening tool — a pre-qualification that tells a developer whether a given location is worth pursuing before investing in a formal interconnection application. It is updated at minimum annually and reflects the utility's best current model of the feeder, including committed but not yet energized DER projects in the interconnection queue.
Three Types of Hosting Capacity Maps
Leading utilities publish three distinct hoDER hosting capacity (how much additional generation can be accommodated without upgrades), electrification hosting capacity (how much additional electrical load — from EVs, heat pumps, and other electrification — can be accommodated), and energy storage hosting capacity (how much storage can interconnect without causing violations). Each reflects different operating constraints and different risk profiles. Engineering analysis of these maps reveals important asymmetries: in many distribution territories, DER hosting capacity averages around 2 MVA per circuit while electrification hosting capacity averages around 3.3 MVA — reflecting the fact that load growth tends to coincide with the utility's highest-demand periods when the grid is most thermally constrained, while solar generation peaks at times when the grid is less loaded.
The Troubling State of Available Capacity
Analysis of hosting capacity data across representative distribution territories reveals a concerning picture. Approximately 20% of distribution circuits currently have zero available DER hosting capacity — meaning any DER addition, regardless of size, would require a grid upgrade before connection could be approved. The average available hosting capacity across circuits is around 2 MVA for DER and 3.3 MVA for load — figures that are falling as DER penetration increases and load growth accelerates.
The cost of grid reinforcement when hosting capacity is exhausted is substantial. Depending on the nature of the constraint and the required upgrade, project-specific grid reinforcement costs routinely reach several million dollars. These costs fall primarily on the interconnecting developer under current policy frameworks, creating significant economic barriers to DER deployment in already-constrained areas — the very areas where grid benefits from local generation may be greatest.
Key Engineering Consideration
A critical engineering nuance: hosting capacity is time-dependent. The available capacity on a feeder at 2pm on a sunny summer day when existing rooftop solar is generating at full output is fundamentally different from the available capacity at 7am on a winter morning. Conventional hosting capacity analysis typically identifies the worst-case scenario across the full operating envelope and uses that as the limit. This is conservative by design — but it also means that a feeder that appears fully constrained on a worst-case basis may have substantial available capacity for the vast majority of operating hours. Flexible interconnection is designed to exploit this gap.
Flexible Interconnection: Engineering the Fourth Option
The Traditional Three Outcomes and Why They Fall Short
Under conventional distribution interconnection practice, a DER project review yields one of three outcomes. First, the project can connect without modification — there is available hosting capacity and no violations result. Second, the project can connect, but only at a reduced capacity below the nameplate rating — the hosting capacity headroom is partially but not fully available. Third, the project can connect at full nameplate, but only after the utility completes specified infrastructure upgrades — and the developer typically bears all or part of that cost.
These three outcomes apply a deterministic, worst-case methodology: the interconnection analysis evaluates the single worst-case operating scenario — maximum generation, minimum load, or maximum load, minimum generation, depending on the violation type — and requires that no violation occur even under that extreme condition. This approach is inherently conservative: it protects the grid under the most adverse conditions but ignores the fact that those conditions may represent a tiny fraction of total operating hours.
Flexible interconnection creates a fourth option: the project connects at a nameplate capacity that would cause violations during certain operating conditions, under an agreement that the DER output will be curtailed below those thresholds when those conditions occur. The developer gains access to the grid at a higher capacity than conventional hosting would allow. The utility maintains reliability by ensuring that violations only occur on paper — in the worst-case analysis — not in practice, because the DER is actively managed to stay within limits.
Static vs. Dynamic Flexible Interconnection
Flexible interconnection is not a single technology or approach. It exists on a spectrum from simple static arrangements to sophisticated real-time dynamic control, and the appropriate choice depends on the nature of the constraint, the complexity of the feeder, the availability of communications infrastructure, and the developer's tolerance for curtailment uncertainty.
Static flexible interconnection uses pre-calculated schedules derived from engineering analysis. The utility performs a comprehensive study of the feeder — typically an 8760 hourly simulation — and identifies the hours or time blocks during which curtailment of the DER is required to prevent violations. This schedule is provided to the developer as a fixed operating constraint. The developer is responsible for curtailing output during scheduled periods, and the utility may or may not have real-time visibility into compliance, depending on the terms of the interconnection agreement. Static arrangements are simpler to implement and require no advanced communications infrastructure, but they are inherently over-conservative: since the schedule is based on worst-case assumptions for each time block, the actual curtailment required in practice will typically be less than scheduled.
Dynamic flexible interconnection uses real-time or near-real-time monitoring of actual grid conditions to determine when curtailment is needed and by how much. Rather than a fixed schedule, the utility or DER management system observes the actual loading of constrained elements and signals curtailment only when actual conditions approach a threshold. This allows the DER to operate at full output in periods when the fixed schedule would have curtailed it, reducing the total annual energy curtailment. The trade-off is complexity: dynamic arrangements require reliable communications infrastructure between the monitoring points and the DER control system, advanced control logic, cybersecurity considerations, and — crucially — fail-safe modes that protect the grid if communications are lost.
Control Scheme Architecture: Three Levels of Complexity
Within the dynamic-static spectrum, three distinct control scheme architectures are used in practice.
Fixed constraint schemes provide a time-based or schedule-based limit on DER output. The constraint is static — it does not change based on actual grid conditions in real time. This is the simplest and most common starting point for flexible interconnection programs. Curtailment is typically higher than necessary, but implementation complexity is low.
Localized constraint schemes monitor a single point of interest — typically the transformer or conductor most likely to become the binding thermal or voltage constraint — and allow the DER to operate freely until a threshold is approached at that point. This creates a feedback loop between local conditions and DER output, reducing over-curtailment compared to a fixed schedule. The monitoring point is fixed; the DER reacts to conditions at that point regardless of what is happening elsewhere on the feeder.
Multiple constraint monitoring schemes track multiple points on the feeder simultaneously, typically through a centralized control system such as a Distributed Energy Resource Management System (DERMS) or Advanced Distribution Management System (ADMS). The DER's allowable output is determined by the binding constraint across all monitored points — whichever element is closest to its limit at any given moment dictates the curtailment signal. This is the most complex architecture and requires robust communications, but it provides the most accurate and least conservative curtailment signal, maximizing the DER's operating hours at full output.
The UK as a Reference Market
The United Kingdom has operated flexible interconnection programs for more than a decade and offers the most mature reference point for evaluating program structures. Distribution network operators offer tiered flexible connection options: timed connections (scheduled curtailment, lower cost, faster processing), export limitation schemes (localized constraint monitoring), and load-managed connections (real-time SCADA-based control of DER output). This tiered structure allows developers to choose the level of curtailment certainty and control sophistication appropriate for their project economics. The UK experience demonstrates that all three tiers are viable in practice and that the market for flexibility services on the distribution system can be liquid and durable when regulatory frameworks provide consistent funding and clear contractual structures.
Flexible Interconnection for Large Loads
Flexible interconnection is not exclusively a generation-side solution. The same engineering framework applies in reverse to large loads seeking distribution system connection. A large load — an EV charging hub, a commercial electrification project, a hydrogen production facility — may face available load hosting capacity limits just as a DER project faces generation hosting capacity limits. Under a flexible load interconnection arrangement, the load customer agrees to operate within capacity limits that vary by season, time of day, or real-time grid conditions, in exchange for connection at a higher demand level than conventional practice would permit.
From a utility perspective, flexible load interconnection offers an additional benefit beyond simply enabling the connection: it creates a controllable asset that can be dispatched to support grid reliability during stress events. An EV charging hub that can be curtailed during peak demand periods becomes a demand response resource. A commercial facility with flexible load management becomes a tool for congestion relief. The combination of flexible interconnection on both the generation and load sides creates a portfolio of controllable assets that can be coordinated to maximize distribution system utilization.
Load flexibility has an important practical distinction from generation flexibility: while solar curtailment is economically costly to a developer (lost revenue from foregone generation), load curtailment for large commercial and industrial customers can often be structured around operational flexibility that has relatively low cost — pre-cooling before a curtailment period, shifting EV charging from peak to off-peak hours, or running electrolysis processes at reduced power during grid-constrained periods. This makes load-side flexible interconnection a particularly attractive component of a comprehensive distribution congestion management strategy.
Common Violations Addressed by Flexible Interconnection
The two categories of distribution violations most commonly addressed by flexible interconnection are thermal overloads and voltage regulation issues.
Thermal overloads occur when the combined current flow through a conductor, transformer, or other current-carrying element exceeds its thermal rating. Under high DER generation with low local load — a sunny midday period in a residential circuit with significant rooftop solar — power flows from customers back toward the substation. If this reverse flow exceeds the thermal capacity of feeder elements, equipment damage and protection trips can result. Conventional resolution requires conductor replacement or transformer upgrades. Flexible interconnection resolution involves curtailing DER output before the thermal limit is reached.
Voltage regulation violations occur when the voltage at any point on the feeder exceeds the allowable range — typically 114V to 126V on a 120V base at the customer meter. Under high DER generation, voltage on the feeder rises as the local generation reduces the current drawn from the substation — and in cases of significant reverse power flow, voltage may rise above the upper limit. Under high load conditions, voltage may fall below the lower limit. Both conditions can be addressed through flexible interconnection: curtailing generation reduces the voltage rise, and curtailing load (in a load flexible interconnection arrangement) reduces the voltage depression.
8760 Hourly Simulation Methodology: The Engineering Foundation of Flexible Interconnection
Why Hour-by-Hour Analysis Is Essential
The shift from worst-case deterministic analysis to 8760 hourly simulation is the single most important methodological change in distribution hosting capacity assessment. Worst-case analysis asks: what is the maximum DER output that would never cause a violation under any conceivable operating condition? It answers this by identifying the single most adverse hour and sizing the hosting capacity to that moment. The result is that a project may be curtailed — or refused interconnection altogether — based on conditions that occur for only a few hours per year.
An 8760 hourly simulation asks a fundamentally different question: for each hour of the year, what is the actual loading of every element of the feeder, given the actual load at that hour, the actual solar irradiance at that location, and the actual output of all existing DER on the circuit? This produces a complete picture of feeder utilization over time, revealing not just when violations occur but how often, for how long, and by how much. This information is what makes flexible interconnection economically and contractually viable: it allows the utility to quantify expected annual curtailment hours and energy, which the developer needs to assess project economics.
Data Requirements and Sources
An 8760 simulation for flexible interconnection studies requires several data inputs, each with specific quality considerations:
- Feeder load data: Hourly load profiles for all loads on the feeder, ideally from Advanced Metering Infrastructure (AMI) smart meter data. Where AMI data is available, it provides a highly accurate representation of actual customer load behavior, including the variability and temporal patterns that worst-case analysis cannot capture. Where individual meter data is unavailable, load allocation methods are applied to distribute the measured feeder-head load among individual customers using class-load shape templates.
- Existing DER generation profiles: Hourly generation profiles for all existing solar PV and other DER on the feeder. For operating systems with revenue metering, measured generation data is preferred. For systems without high-resolution generation measurement, PV generation modeling tools using satellite-derived solar irradiance data can produce accurate hourly profiles that account for panel orientation, tilt, local shading, and temperature effects.
- Future committed DER profiles: Projects that have signed interconnection agreements but are not yet energized must be modeled as present, since they will be on the system before the new project seeking interconnection. These projects do not have measured data, so modeled profiles must be used.
- Flexible interconnection project profile: The project under study requires an hourly generation or load profile reflecting its expected operational characteristics. For solar PV, this is generated using the same irradiance-based modeling tools as existing PV. The profile is then modified by the curtailment analysis to produce the net output after flexible interconnection constraints are applied.
- Other feeder feeders on the same substation bus: Where the feeder of interest shares a substation transformer with other feeders, those feeders' aggregate load and DER must be included in the model as an equivalent load at the transformer terminals, since the transformer thermal limit is shared across all feeders on the bus.
Load Allocation: Making Imperfect Data Workable
Even with AMI data, load allocation is typically required to distribute feeder-head measurements to individual load points in the network model. The feeder-head measurement reflects the aggregate net load of all customers and all existing DER — but the power flow model needs individual load values at each customer node to compute voltages and currents throughout the feeder.
Load allocation proceeds by reverse-engineering the individual customer loads from the feeder-head measurement. The measured feeder-head load at each hour is corrected for the contribution of existing PV (which reduces apparent feeder-head load during generation periods) to obtain the true underlying load. This corrected load is then distributed among customer nodes in proportion to their billing demand or customer class load shapes, scaled so that the aggregate of all allocated loads equals the corrected feeder-head measurement. The resulting load curves are verified against any available substation or mid-feeder measurements as quality checks before use in simulation.
Data quality issues are common in real datasets and must be addressed systematically. Missing measurement intervals must be filled using nearest-neighbor interpolation or class average substitution. Erroneous readings — values that exceed physically plausible bounds, typically indicating meter faults — must be identified and replaced. The data cleaning and allocation process, while not glamorous, is as important as the simulation itself: garbage data produces garbage curtailment estimates, and developers will commit capital based on those estimates.
Curtailment Strategy Development and Case Structure
The output of the 8760 simulation is not a single curtailment recommendation. It is a family of results under different curtailment strategy assumptions, which together define the trade-off space between curtailment complexity and curtailment volume that the developer and utility must navigate together.
The case structure for a flexible interconnection 8760 study typically includes a reference case with no flexible interconnection project (establishing the baseline feeder condition), an uncurtailed case with the project at full output (quantifying the violations the project would cause without any control), and a family of curtailment strategy cases ranging from hourly-optimal curtailment (the theoretical minimum curtailment achievable if the utility could adjust the limit every hour) to monthly or seasonal limit profiles (more practical to implement but resulting in higher over-curtailment compared to the hourly-optimal).
The gap between hourly-optimal and seasonal curtailment represents the implementation complexity premium: by using simpler, less frequently updated limits, the developer accepts additional curtailment in exchange for a simpler, lower-cost control arrangement. Quantifying this trade-off explicitly — both in total annual energy curtailed and in terms of which hours and seasons are most affected — gives developers the information they need to make an informed economic decision about which curtailment strategy is optimal for their project.
Volt-VAR Control Integration
A critically important finding from comprehensive 8760 flexible interconnection studies is that reactive power control — specifically volt-VAR control mode settings for the DER inverter — interacts strongly with thermal curtailment strategies, and this interaction is almost always beneficial. When a DER inverter operates in volt-VAR mode (injecting or absorbing reactive power in response to local voltage), it contributes to voltage regulation throughout the feeder. This voltage regulation reduces the probability of voltage violations, which in turn reduces the curtailment required to keep voltages within limits.
The practical result is that combining volt-VAR control with curtailment produces better outcomes than either alone. Volt-VAR control reduces the curtailment needed to address voltage violations; the residual thermal violations are then addressed by the curtailment schedule. The two control strategies are complementary, not conflicting — a finding that directly addresses one of the most common developer concerns about flexible interconnection: the fear that curtailment control will interfere with the voltage support function they are providing to the grid.
Conservative volt-VAR mode settings — following standard reactive power capability curves from IEEE 1547 — are typically the right balance between voltage support effectiveness and the risk of excessive reactive power consumption that could itself cause thermal overloads on feeder elements. Full active volt-watt curtailment mode, which reduces active power in response to high voltage, can eliminate nearly all voltage violations but may introduce thermal overloads on other elements if not carefully calibrated with the study results. The selection of the appropriate reactive power control mode is a study output, not a study input — it must be determined through simulation, not assumed.
Planning-to-Operations Gap: A Persistent Challenge
A critical limitation of planning-based 8760 studies must be acknowledged: the operating conditions captured in an annual simulation do not fully represent all conditions that will actually occur during the operating life of a flexible interconnection arrangement. Planning models capture the expected distribution of operating conditions based on historical load and irradiance data, committed DER projects, and current network topology. They do not capture all conditions that will arise in practice.
Three categories of operational conditions are systematically underrepresented in planning studies.
First, fail-safe mode curtailment: when communications between the centralized controller and the DER are lost, the system must revert to a pre-defined safe operating state — typically either full curtailment or a conservative fixed limit. These communication outage periods, while individually brief, accumulate over the operating life of the project. Field experience from operating flexible interconnection programs shows that fail-safe curtailment can represent a meaningful addition to the curtailment hours predicted by planning studies. Second, controller threshold configuration: the specific thermal rating used to define the curtailment trigger matters enormously. Using summer thermal ratings (which are lower than winter ratings) means more conservative curtailment is applied year-round, even during winter hours when equipment could safely carry more current. Seasonal dynamic ratings, where available, can reduce unnecessary curtailment. Third, grid changes over the operating period: additional DER projects, load growth, topology changes, and other modifications over the 20+ year life of the flexible interconnection arrangement will change the feeder conditions that were the basis for the original study. The curtailment schedule or thresholds must be periodically re-evaluated as the feeder evolves.
Power Flow Controllers: A Non-Invasive Path to Increased Hosting Capacity
The Phase Imbalance Problem
Distribution feeders are three-phase systems, but the loads connected to them are not uniformly distributed across all three phases. Single-phase residential loads connect to one of three phases. Single-phase laterals serve neighborhoods that may be predominantly on one phase. EV chargers and rooftop solar installations connect to whatever phase serves the customer's meter. The result is phase imbalance — a condition in which the three phases carry significantly different current levels and experience different voltage drops along the feeder.
Phase imbalance creates a hosting capacity problem that is distinct from the thermal and voltage problems that flexible interconnection addresses. When one phase carries substantially more current than the others — due to load imbalance, DER imbalance, or both — the thermal limit of that phase is reached before the overall three-phase system is thermally constrained. The hosting capacity limit for the feeder is set by the most loaded phase, not by the average loading across all three phases. This means a feeder may have significant available thermal headroom on two of its three phases while being fully constrained on the third — and that single-phase constraint limits the total hosting capacity of the entire feeder.
The conventional solution is re-phasing: moving customers from the overloaded phase to less-loaded phases, either by physical reconnection of service transformers or by changing connection assignments at the distribution transformer. Re-phasing is effective but expensive, labor-intensive, and requires planned outages. It is also reactive — re-phasing restores balance based on the current load pattern, but that pattern changes as DER penetration and load electrification continue to evolve, potentially creating new imbalances within years of the re-phasing work.
How Power Flow Controllers Work
Power flow controllers address phase imbalance dynamically and continuously, without physical re-phasing of customers. The technology operates as a three-phase, shunt-connected power electronics device installed at a point on the distribution feeder where imbalance is significant. Its control objective is to eliminate the zero-sequence current at its installation point — the component of current that flows in the neutral conductor and represents the imbalance between phases.
The device operates by measuring the phase currents at its installation point, computing the zero-sequence component (equivalent to one-third of the neutral current), and injecting an equal and opposite zero-sequence current into the system through its shunt connection to each phase. This injection shifts the phase current phasors, redistributing current from overloaded phases to underloaded phases — effectively transferring active power between phases in real time.
The result, observed upstream of the device, is that the system appears more balanced: the previously overloaded phase carries less current, the previously underloaded phase carries more, and the neutral current is substantially reduced. Downstream of the device, the loads remain connected to the same phases as before, and the imbalance from those individual loads continues to exist. But because the upstream system is balanced, the feeder-head measurement, substation transformer loading, and voltage profiles across the upstream portion of the feeder all improve.
Phase Current Redistribution — The Physical Mechanism
The zero-sequence current injection mechanism can be understood intuitively as active power transfer between phases. If Phase C is overloaded and Phase B is lightly loaded, the device draws additional current from Phase B and Phase A (lightly loaded phases) and injects that power into Phase C's upstream circuit, effectively reducing the net Phase C loading seen from the upstream direction. This is a genuine active power transfer — real kilowatts are moved from one phase to another within the device — accomplished through the power electronic switching of the shunt-connected converter. The device is rated by its current injection capability (typically expressed in amps per phase) and can balance up to that rating continuously in real time at update rates in the seconds range.
System Benefits and Hosting Capacity Implications
The benefits of power flow control extend beyond simply reducing neutral current. Because phase imbalance causes voltage profiles on the three phases to diverge — the overloaded phase experiences excessive voltage drop while the underloaded phase may experience voltage rise — balancing the phase currents also pulls the voltage profiles on all three phases closer together. This 'voltage profile compression' reduces the maximum voltage imbalance on the feeder and, critically, prevents the most heavily loaded phase from experiencing the lowest voltage while the most lightly loaded phase experiences the highest voltage.
The hosting capacity implication is significant. When DER hosting capacity is limited by high-voltage conditions on a lightly loaded phase, adding the power flow controller reduces the voltage on that phase by pulling current toward it from other phases. This relieves the high-voltage constraint, allowing additional DER to connect on that phase. Similarly, when hosting capacity on a heavily loaded phase is limited by thermal constraints, the power flow controller moves current away from that phase, creating thermal headroom for additional load or generation. Field demonstrations have shown single-phase hosting capacity increases of 30–100% on specific phases, depending on the pre-existing imbalance and the rating of the device relative to the imbalance magnitude.
Circuit Selection and Device Placement
Not every distribution circuit is a suitable candidate for power flow controller installation. The device provides maximum value on circuits with high phase imbalance, long feeder lengths (where imbalance has maximum impact on voltage divergence), and single-phase laterals where residential DER adoption is uneven across phases. Urban circuits with short feeders, large conductors, and balanced three-phase commercial loads typically exhibit less imbalance and derive less benefit.
Circuit screening uses feeder-head neutral current as the primary metric — a high neutral current indicates significant imbalance and is easily obtained from SCADA or AMI data for all circuits simultaneously. Circuits above a threshold neutral current level are candidates for further analysis. Site selection within candidate circuits involves creating spatial heat maps of neutral current and voltage imbalance along the feeder length, identifying the location where the combination of high imbalance magnitude and maximum upstream feeder length can be exploited. The optimal placement is typically at the point where imbalance first becomes significant after a balanced substation zone — far enough out on the feeder to maximize the balanced upstream length, but not so far that the device rating is insufficient to correct the accumulated imbalance.
Technology Characteristics and Practical Considerations
Power flow controllers are pad-mounted devices with significant physical footprint — approximately 4 feet wide, 11 feet long, and 5 feet tall, weighing approximately 9,000 pounds. Installation requires an appropriate pad, underground cable risers from the distribution line, and commissioning work totaling approximately one full working day once the site is prepared. The device connects in shunt to the distribution system, so failure of the device does not cause an outage — it simply returns the feeder to its pre-device imbalanced condition, which was acceptable before the device was installed.
The device operates dynamically, updating its injection in the seconds range — faster than voltage regulators and tap-changing transformers, but slower than transient fault events that clear in cycles. This operating timescale means the device tracks load and DER variability effectively but does not interact with protective relay operations. Following a fault and reclosure, the device waits for stable voltage conditions to be restored — similar to the behavior of a grid-connected inverter — before re-engaging its balancing function.
Power losses associated with the device are minimal. Field measurements confirm that by eliminating phase imbalance, the device reduces the copper losses associated with the neutral current flow, essentially compensating for its own power consumption. The net system power loss impact is approximately neutral or slightly positive.
Benefit-Cost Framework
Economic evaluation of power flow controller installations considers multiple benefit categories. Capacity upgrade deferral is typically the largest: if the device enables a line extension to be deferred or avoided, the capital cost savings can be substantial and the payback period can be zero (the device cost is less than the upgrade cost it replaces). Reduced seasonal recapping costs are another benefit in systems where utilities currently manage imbalance by manually moving customer connections seasonally. Power quality improvement, neutral current reduction, and reduced risk of neutral conductor overload provide additional value. DER and load hosting capacity increase, the primary focus of this brief, creates value for both the utility (avoided future upgrade costs for accommodating DER interconnection) and for developers (enabling projects that would otherwise face expensive upgrade requirements).
Cost-benefit analyses conducted for representative pilot installations have demonstrated payback periods under six years across all evaluated scenarios, compared to a device service life of 20 years. The strongest cases — where the device replaces a physical line extension — show payback at installation. The weakest cases still show payback within six years when all benefit categories are captured. Retail cost for the device is approximately $275,000, with installation costs of approximately $50,000 and modest maintenance costs around year eleven.
Choosing the Right Tool: Flexible Interconnection vs. Power Flow Control
Flexible interconnection and power flow control address overlapping but distinct problems, and the appropriate choice — or combination — depends on the nature of the hosting capacity constraint.
Power flow control is the right tool when the binding constraint is phase imbalance on a circuit with significant neutral current. It requires no curtailment of DER or load, no developer agreement on operating limits, and no communication infrastructure. It is purely a utility-side intervention. The hosting capacity gain is bounded by the device's rating relative to the existing imbalance.
Flexible interconnection is the right tool when the binding constraint is the aggregate thermal or voltage capacity of the circuit — the total current or total reactive power the circuit can accommodate, rather than its distribution across phases. It requires developer agreement on operating limits, study methodology to quantify expected curtailment, and — for dynamic schemes — communications and control infrastructure. The hosting capacity gain can be substantially larger than what power flow control can provide, limited mainly by how much curtailment the developer is willing to accept.
The most powerful strategy combines both. Power flow control normalizes the phase imbalance, creating uniform thermal headroom across all three phases. Flexible interconnection then allows DER to connect above the remaining thermal limit with acceptable curtailment. Together, they can increase hosting capacity by materially larger amounts than either tool alone could achieve.
Looking Forward: Load Growth, Behind-the-Meter Solar, and Technology Longevity
Both flexible interconnection arrangements and power flow controller installations have service lives measured in decades, but the distribution grid they are designed for will continue to change throughout that period. Understanding how continued load growth and increasing behind-the-meter DER penetration will affect the performance of these technologies is essential for long-term planning confidence.
For power flow controllers, load growth generally improves hosting capacity outcomes: more load on the feeder means DER output is more likely to be absorbed locally rather than flowing back toward the substation, which reduces voltage rise concerns and thermal reverse-flow issues. However, if load growth is concentrated on already-overloaded phases, it can worsen imbalance and potentially exceed the device's balancing capability. The key variable is the single-phase vs. three-phase nature of the new load growth.
For flexible interconnection, load growth typically reduces curtailment: additional load on the feeder during midday solar generation hours means more local consumption of the DER output, reducing the reverse power flow that causes thermal overloads and voltage violations. However, the timing of load growth relative to DER generation matters — EV charging concentrated in morning and evening hours does not reduce midday solar curtailment, while heat pump operation on cold days when solar output is low does not reduce summer peak thermal constraints. The load shape, not just the magnitude, determines the impact on curtailment.
Behind-the-meter solar growth adds complexity for both technologies. Additional rooftop solar on feeders that already have flexible interconnection arrangements increases the aggregate reverse power flow during solar peak hours, potentially pushing the system toward constraints that the flexible interconnection was designed to address — and potentially triggering additional curtailment of the flexible interconnection project that was not captured in the original study. This argues strongly for forward-looking hosting capacity forecasting that projects DER growth over the study period, not just the current committed queue.
CASE STUDY
Distribution Hosting Capacity Engineering: Three Keentel Engineering Engagements
The following case studies are presented in fully anonymized form. All project identifiers, locations, utility names, and developer names are confidential. Results reflect actual engineering work.
8760 Flexible Interconnection Study for a Community Solar Portfolio on a Constrained Rural Substation
Developing static and dynamic curtailment strategies for multiple community solar projects sharing a single overloaded substation transformer, and quantifying curtailment trade-offs across implementation complexity levels
Engagement Background
A regulated electric utility retained Keentel Engineering to develop a flexible interconnection study framework for a rural substation that had become the preferred interconnection point for a cluster of community solar projects. The substation transformer served four distribution feeders with a combined summer thermal rating of 12 MVA. At the time of engagement, the substation had 7.8 MW of committed community solar projects in the interconnection queue — projects that had executed interconnection agreements but were not yet energized — and a 5 MW project seeking a new interconnection agreement. Combined, the committed and proposed projects would exceed the transformer's summer thermal rating by approximately 35% during coincident peak generation conditions.
Conventional interconnection practice would have required either rejection of the 5 MW project or a transformer upgrade estimated at $2.1 million, to be paid by the developer. The developer sought a flexible interconnection arrangement as an alternative.
Technical Scope and Approach
Feeder and Substation Modeling
Keentel Engineering built a detailed network model of all four feeders served by the substation, including all existing DER and committed projects. AMI load data for the prior calendar year was obtained for the substation transformer measurement point. Load allocation was performed using a two-step process: first, individual feeder loads were separated from the aggregate transformer measurement using feeder-head recloser measurements where available; second, customer loads within each feeder were allocated to individual nodes using class load shapes scaled to the measured feeder-head net load.
PV generation profiles for all existing and committed community solar projects were modeled using a satellite-irradiance-based generation tool calibrated to the geographic coordinates of each project site. Since all projects were within a 12 km radius, solar profiles were highly correlated — a key factor in the coincident generation analysis.
8760 Study and Case Development
The 8760 simulation covered the full prior calendar year at one-hour resolution. Five curtailment strategy cases were developed for the proposed 5 MW project, representing the range from maximum-curtailment static approaches to minimum-curtailment hourly-optimal approaches:
- Case 0: No flexible interconnection — transformer thermal rating as hard limit. Result: project cannot connect at 5 MW nameplate.
- Case 1: Fixed seasonal limits (four seasonal curtailment levels, constant within each season). Highest curtailment volume; simplest implementation.
- Case 2: Monthly limit curves (twelve monthly curtailment limits). Intermediate curtailment volume and implementation complexity.
- Case 3: Hourly localized constraint monitoring based on substation transformer current measurement. Lowest curtailment volume; requires real-time communications to substation SCADA.
- Case 4: Multi-constraint monitoring including transformer and three identified worst-case feeder conductor segments. Marginal improvement over Case 3 for this specific circuit; substantially higher implementation cost.
Volt-VAR Control Integration
All cases were evaluated both with the proposed project operating at fixed unity power factor and with the project operating in conservative volt-VAR mode per the standard reactive power capability curve. Volt-VAR control mode reduced the probability of voltage violations in all cases and, importantly, reduced the required thermal curtailment in Cases 1 and 2 by approximately 8% because the reactive power absorption during high-voltage periods slightly reduced feeder current magnitude.
Results and Developer Findings
| Transformer summer rating | 12 MVA |
|---|---|
| Committed queue at interconnection point | 7.8 MW community solar (not yet energized) |
| Proposed project capacity | 5 MW community solar |
| Combined without curtailment | 12.8 MW — exceeds 12 MVA transformer limit |
| Case 1 — seasonal limits annual curtailment | 14.2% of annual project generation |
| Case 2 — monthly limits annual curtailment | 9.8% of annual project generation |
| Case 3 — hourly localized monitoring curtailment | 5.3% of annual project generation |
| Case 4 — multi-constraint monitoring curtailment | PSCAD only |
| Volt-VAR mode impact | Reduced thermal curtailment by ~8% across all cases |
| Fail-safe setpoint recommendation | 2.5 MW (50% of nameplate) — below feeder capacity with all committed projects at full output |
The developer selected Case 2 (monthly limit curves) as the basis for the interconnection agreement, determining that the 9.8% annual curtailment was within the financial model's acceptable range and that the monthly schedule could be implemented using the project's existing inverter control capability without additional communications infrastructure investment.
Outcome
The flexible interconnection arrangement was executed, allowing the 5 MW project to connect without the $2.1 million transformer upgrade. The developer's interconnection cost was approximately $85,000 for study, agreement, and inverter reconfiguration — a cost reduction of over 95% compared to the conventional upgrade approach. The utility retained the ability to require re-evaluation of the curtailment schedule if future feeder conditions changed materially.
Power Flow Controller Deployment and Hosting Capacity Assessment for a High-Penetration DER Residential Feeder
Identifying, siting, and modeling a phase-balancing power flow controller on a residential feeder with severe single-phase DER concentration, and quantifying hosting capacity gains across all three phases
Engagement Background
A distribution utility engaged Keentel Engineering to evaluate power flow controller technology as a solution for a residential feeder experiencing significant DER hosting capacity constraints driven by phase imbalance. The feeder served approximately 1,400 residential customers through a mix of three-phase backbone and single-phase laterals. Over the prior three years, rooftop solar penetration on several long single-phase laterals on Phase B had reached approximately 65% of connected homes, creating a severe Phase B high-voltage condition during midday solar generation periods. Phase B hosting capacity had effectively reached zero: any additional single-phase rooftop solar on Phase B laterals would cause voltage violations.
Meanwhile, Phase A and Phase C laterals on the same feeder had substantial remaining hosting capacity — approximately 320 kW on Phase A and 410 kW on Phase C — creating the paradox of a feeder with available capacity on two phases but zero capacity on the third. The utility's standard resolution, re-phasing selected customers from Phase B to Phase A or Phase C, was estimated at $380,000 for the affected laterals — and would provide relief only for current conditions, not for future DER growth.
Circuit Screening and Site Selection
Keentel Engineering first performed a feeder-level screening assessment using twelve months of SCADA data at the feeder head. Phase B neutral current during midday solar generation periods routinely exceeded 110 amps, with feeder head current imbalance of 28–34% during high-solar periods. Maximum voltage imbalance at the end of the most affected Phase B lateral was measured at 3.1% — above the IEEE 2% threshold but below the worst cases in other candidate circuits in the utility's territory.
Site selection was performed by creating spatial heat maps of neutral current and voltage imbalance along the feeder backbone using the network model. The optimal installation point was identified at a location approximately 60% of the way down the feeder backbone — far enough from the substation to capture the majority of the feeder length in the balanced zone, and at a point where the Phase B lateral with highest DER penetration connected to the backbone, maximizing the neutral current available for the device to correct.
Simulation Results and Hosting Capacity Analysis
A power flow controller model was implemented using a Python-scripted simulation interface. The model was configured to inject the zero-sequence counter-current up to the device's maximum rating of 133 amps total (approximately 44 amps per phase). Results were computed for both current control mode and voltage control mode.
| Pre-device Phase B voltage imbalance (max) | 3.1% (end of most affected lateral) |
|---|---|
| Post-device Phase B voltage imbalance (max) | 1.7% — 45% reduction |
| Pre-device feeder head neutral current (peak solar) | 114 amps |
| Post-device feeder head neutral current (peak solar) | 18 amps — 84% reduction |
| Phase B DER hosting capacity — before device | 0 kW (fully constrained by high voltage) |
| Phase B DER hosting capacity — after device | 210 kW additional single-phase PV |
| Phase A DER hosting capacity — before device | 320 kW |
| Phase A DER hosting capacity — after device | 390 kW (thermal headroom improved by current redistribution) |
| Phase C DER hosting capacity — before device | 410 kW |
| Phase C DER hosting capacity — after device | 480 kW |
| Total feeder DER hosting capacity gain | 350 kW additional (from 730 kW to 1,080 kW total) |
| Control mode recommendation | Voltage control mode (marginally better voltage imbalance performance in simulation) |
Economic Comparison
The utility compared the power flow controller approach against the baseline re-phasing option. Re-phasing cost: $380,000 for current DER penetration, with additional re-phasing likely required within three to five years as DER adoption continued. Power flow controller installed cost: $275,000 device plus $52,000 installation, with the device capable of dynamically adapting to future DER growth without additional physical work. The power flow controller provided a $105,000 immediate cost saving, eliminated the need for projected future re-phasing work, and increased total feeder hosting capacity by 48% compared to the re-phasing baseline — because re-phasing restores balance at current conditions but does not improve the system's ability to accommodate future growth on the previously overloaded phase.
Outcome and Monitoring Framework
The power flow controller was installed and commissioned. Keentel Engineering developed a post-installation performance monitoring framework using the utility's existing SCADA system, tracking feeder head neutral current, phase current imbalance, and maximum phase voltage on a 15-minute basis. Performance in the first operating season confirmed simulation predictions within 8%, validating the modeling approach. The utility has since initiated screening of twelve additional residential feeders in areas with high single-phase DER penetration, using the circuit selection methodology developed for this engagement.
Flexible Load Interconnection Study and Control Framework for a Regional EV Fleet Charging Hub
Engineering a flexible load interconnection arrangement for a large EV fleet charging facility to avoid a substation upgrade, with dynamic curtailment control integrated with utility AMI and DERMS=
Engagement Background
A fleet operator sought to establish an EV charging hub serving a large commercial vehicle fleet, requiring a peak demand of 3.8 MW during the anticipated heaviest simultaneous charging periods. The proposed site was served by a distribution feeder whose substation transformer had a summer peak loading of 8.4 MVA against a 10 MVA summer rating — leaving 1.6 MVA of available load hosting capacity. The proposed 3.8 MW demand would exceed available hosting capacity by approximately 2.2 MW under the worst-case coincident loading scenario, triggering a transformer upgrade estimated at $1.9 million under the conventional interconnection process.
The fleet operator's operations team indicated that EV charging could be flexibly managed: the fleet's overnight charging cycle had a 10-hour window during which most of the fleet's daily energy needs could be met, even if charging was interrupted or reduced for periods totaling up to 2.5 hours per day. Keentel Engineering was retained to develop a flexible load interconnection study and design the control framework for a dynamic arrangement that would allow the full 3.8 MW interconnection without the transformer upgrade.
Load Profile Characterization
Keentel Engineering developed an hourly load profile for the EV charging hub based on the fleet operator's vehicle return schedule, charging session durations, battery capacity distribution across the fleet, and the operator's stated flexibility window. Three scenarios were modeled: a base load scenario representing typical daily operations, a peak load scenario representing days when a higher-than-usual fraction of the fleet returned to base with low state-of-charge (requiring maximum charging rate), and a managed load scenario representing the load profile achievable if charging were throttled during the identified constraint hours.
The existing substation feeder loads were characterized using 12 months of AMI transformer head measurements, with the seasonal and daily patterns decomposed to identify the hours during which the combination of existing feeder load plus EV charging hub load would exceed the transformer thermal rating.
Curtailment Analysis and Control Design
The 8760 analysis identified that transformer thermal violations would occur during 387 hours of the year if the EV charging hub operated without constraint — primarily during weekday late afternoon and early evening periods (3pm–8pm) when existing residential and commercial loads coincided with the fleet's return and initial charging rush. These 387 hours represented 4.4% of total annual hours.
Three control tiers were designed to manage hub demand within the transformer thermal limit during these periods:
- Tier 1 — Scheduled curtailment: During identified high-risk time windows (weekday 3pm–8pm, summer months), the hub automatically operates at 60% of maximum demand (2.28 MW) using a pre-programmed charging schedule. This eliminates violations during 94% of the 387 identified constraint hours without requiring real-time communication.
- Tier 2 — Localized dynamic control: The utility's DERMS receives real-time transformer loading from the SCADA system and issues a curtailment signal to the hub's charge management system when transformer loading exceeds 92% of the summer thermal rating. The hub responds by reducing charging rate across the fleet in aggregate within two minutes. This handles the residual 6% of constraint hours not addressed by Tier 1.
- Tier 3 — Fail-safe: If DERMS communications are unavailable, the hub reverts to 50% of maximum demand (1.9 MW) — below the remaining available capacity even at maximum existing feeder load — until communications are restored.
Fleet Operator Economic Assessment
Keentel Engineering prepared a curtailment impact analysis for the fleet operator's financial evaluation. Under the designed control framework, total annual energy curtailed from the EV charging hub was estimated at 42 MWh out of an annual charging load of approximately 3,800 MWh — a curtailment rate of 1.1%. The fleet operator's operations team confirmed that the Tier 1 scheduled curtailment could be accommodated by advancing the start time of charging sessions for vehicles returning before 3pm, effectively shifting demand from the constraint period to earlier hours without affecting fleet availability for next-day operations.
| Peak demand sought | 3.8 MW |
|---|---|
| Available load hosting capacity (conventional) | 1.6 MW — gap of 2.2 MW |
| Conventional upgrade cost avoided | $1.9 million substation transformer upgrade |
| Flexible interconnection implementation cost | $145,000 (study, DERMS integration, charge management system) |
| Annual constraint hours (without control) | 387 hours (4.4% of year) |
| Tier 1 coverage (scheduled) | 364 of 387 hours — 94% |
| Tier 2 DERMS dynamic control coverage | Residual 23 hours — 6% |
| Annual energy curtailed (all tiers) | 42 MWh of 3,800 MWh annual charging — 1.1% curtailment rate |
| Fleet availability impact | Zero — demand shifted to adjacent hours, not eliminated |
| Fail-safe setpoint | 1.9 MW (50% of nameplate) |
Outcome
The flexible load interconnection agreement was executed, allowing the EV charging hub to connect at its full 3.8 MW nameplate demand and begin operations without the transformer upgrade. The dynamic DERMS control integration was implemented using the utility's existing DERMS platform, requiring only a new DERMS endpoint configuration for the charging hub's charge management system — no utility-side infrastructure investment beyond the engineering study. The arrangement has operated for one full calendar year. Actual curtailment was 38 MWh — slightly below the 42 MWh study estimate, reflecting that actual coincident peak loading was marginally lower than the worst-case assumptions used in the study. The utility has used the control framework developed for this engagement as the basis for a standardized flexible load interconnection tariff offering for EV charging and other large commercial load customers.
Advanced Technical FAQ
DER and Load Hosting Capacity: Technical FAQ for Distribution Engineers and Planners
Keentel Engineering's distribution planning and DER integration engineering teams address the most technically demanding questions on hosting capacity assessment, flexible interconnection, power flow control, and 8760 simulation methodology.
Q1. What is the technical definition of hosting capacity and how does it differ from thermal capacity of a feeder?
Hosting capacity and feeder thermal capacity are related but distinct concepts. Thermal capacity is the maximum continuous current that a conductor, transformer, or other element can carry without exceeding its temperature rating — a physical property of the equipment determined by its materials, geometry, insulation class, and ambient temperature. Hosting capacity is a system-level measure that accounts for thermal capacity as one of potentially several binding constraints. A feeder's hosting capacity for DER is determined by whichever constraint becomes binding first as DER output increases: this could be thermal overload of a conductor during reverse power flow, voltage rise above the upper voltage limit (typically 1.05 per unit on a 120V base), voltage drop below the lower voltage limit during high-load conditions, excessive tap movement of voltage regulators, or protection coordination concerns if the DER contribution to fault current affects relay coordination. Hosting capacity is the DER capacity at which the first violation occurs. On many circuits, the voltage constraint is binding before the thermal constraint — meaning the feeder has available thermal headroom that cannot be used because voltage limits are reached first.
Q2. How should load allocation be performed when AMI data is available at the feeder head but not at individual customer meters, and what are the main sources of error?
Load allocation with feeder-head AMI data and no individual meter data proceeds in three steps. First, compute the true underlying load at the feeder head by adding back the output of all existing DER to the measured net import (or subtracting net export). This produces the gross load that would have been measured if no DER were present. Second, distribute this gross load to individual customer nodes in the network model using class load shapes: for each customer, scale the class load shape for that customer's tariff class (residential, commercial, industrial) so that the sum of all scaled customer loads equals the feeder-head gross load at each hour. Third, verify by comparing simulated feeder-head loading, mid-feeder meter readings (where available), and substation transformer loading against measured values. The primary sources of error are: load shape mismatch (the class average load shape may not represent the specific mix of customers on this feeder accurately); DER output estimation error (if existing DER output is estimated rather than measured, errors propagate into the load allocation); and data gaps or erroneous readings in the AMI data stream that were not identified and corrected during data cleaning. In practice, load allocation accuracy degrades as the fraction of feeder load served by individual large customers increases, because large customers deviate most from class average shapes.
Q3. The EPRI UDM for LEL modeling — will it be available in PSS/E v36?
As of the December 18, 2025 ERCOT presentation, the availability of a PSS/E v36 version of the EPRI UDM is still to be determined. The current EPRI UDM Version 4 is available in PSS/E v35 and is hosted on the NERC LMWG website. PTI is developing a new standard library model for v36 that would replace the interim UDM approach, but its release date remains unknown and is expected sometime in 2026. Entities planning stability studies that begin after June 2026 should contact ERCOT's Dynamic Studies Team for current guidance on the v36 LEL modeling approach.
Q4. In a multiple-constraint monitoring dynamic flexible interconnection scheme, how are the monitoring point thresholds determined, and what happens when the feeder topology changes?
Monitoring point thresholds are determined through the 8760 simulation study. For each candidate constraint point — conductor segment, transformer, voltage regulator — the simulation identifies the DER output level that would cause a violation at that point for each hour of the study year. The threshold is set below the violation limit with a margin that accounts for measurement uncertainty, forecast error, and control response latency. For thermal constraints, thresholds are typically set at 90–95% of the element's thermal rating. For voltage constraints, thresholds are typically set at 1.04 or 1.045 per unit for upper voltage (below the 1.05 per unit limit) to provide a control margin. When feeder topology changes — a new DER interconnects, a load changes significantly, a switching operation changes the feeder configuration — the relationship between the monitored threshold points and the actual binding constraints changes. If a new DER project connects on the same feeder, the new DER's output adds to the power flow seen at all constraint points, meaning the existing thresholds may no longer be conservative enough. The interconnection agreement for a dynamic flexible interconnection arrangement should include a requirement to re-evaluate monitoring point thresholds whenever a new DER project above a specified size (e.g., 10–20% of the flexible interconnection project's nameplate) connects on the same feeder or upstream substation bus. Failure to re-evaluate is a safety and reliability risk: the control system may believe the feeder is within limits when it is not, because the threshold was calibrated to a different feeder configuration.
Q5. What is the fail-safe operating mode requirement for a dynamic flexible interconnection scheme, and how should the fail-safe setpoint be determined?
Fail-safe mode is the operating state that a flexible interconnection arrangement must revert to when communications between the centralized controller and the DER site are lost. Its purpose is to ensure that the grid remains within its limits even if the DER cannot receive curtailment commands. The fail-safe setpoint must be low enough that the DER operating at the fail-safe level cannot cause a violation even during the worst-case operating conditions relevant to the circuit — the same worst-case conditions used in a deterministic hosting capacity analysis. In practice, this typically means the fail-safe setpoint is equal to or slightly below the hosting capacity of the circuit without any flexible interconnection arrangement, since that is the threshold below which violations do not occur deterministically. This makes the fail-safe setpoint conservative: the DER may be operating well below what the current conditions would allow. The fail-safe setpoint is the anchor that maintains reliability when the dynamic control system is unavailable — and since communication failures are not rare events in distribution operations, the fail-safe setpoint should be treated as the normal minimum operating point for reliability planning purposes, not as an exceptional state. Field experience from operating flexible interconnection programs shows that fail-safe mode curtailment is a meaningful contributor to total actual curtailment and must be disclosed to developers as part of the curtailment estimation in the interconnection agreement.
Q6. How is the phase current transfer in a shunt-connected power flow controller modeled in distribution power flow software, and what modeling limitations exist?
Power flow controllers are modeled by implementing a software-controlled current injection that mimics the device's physical operation. In practice, this is implemented through a custom Python script interface that wraps the distribution power flow solver: at each iteration or each time step, the script queries the phase voltages and currents at the device location, computes the zero-sequence current (one-third of the neutral current phasor), and injects a counter-phasor into each phase. The injected current is implemented in the power flow software as a controllable three-phase load element — typically a battery energy storage block, which accepts positive-and-negative P and Q assignments and provides a script hook for per-iteration control. In steady-state (snapshot) power flow, the model runs iteratively until the injected current converges with the current that would produce the zero-sequence cancellation. In 8760 hourly simulation, the model runs one steady-state snapshot per hour, applying the controller logic at each hour. Key modeling limitations include: the model does not capture the transient dynamics of the power electronics — it represents the steady-state equilibrium the device reaches after its control loop converges, not the sub-second settling behavior. For planning studies of hosting capacity, this is appropriate; for protection coordination studies involving the device's behavior during faults and reclosures, time-domain simulation would be needed. A second limitation is that the model assumes the device is never saturated; if the feeder imbalance exceeds the device rating, the model must be constrained to the maximum injection rating and the residual imbalance above the device's capability must be handled explicitly.
Q7. How should curtailment be allocated among multiple flexible interconnection projects on the same feeder or substation, and what are the fairness and efficiency trade-offs?
When multiple flexible interconnection projects share constraints on the same feeder or substation, curtailment allocation policy is both a technical and a contractual question with significant fairness implications. Two primary allocation approaches exist. Pro-rata curtailment allocates the curtailment burden proportionally to each project's nameplate capacity: if a 40% curtailment signal is issued, every project curtails by 40% of its current output. This is simple, transparent, and treats all projects identically regardless of when they connected. Last-in-first-off curtailment (priority-based) curtails projects in reverse order of interconnection date: when curtailment is required, the most recently connected project is curtailed first and most. This protects earlier projects' revenue certainty but creates increasing uncertainty for projects joining the flexible interconnection program later, potentially discouraging participation. The pro-rata approach provides better economic certainty for all projects and avoids the discrimination problem inherent in last-in-first-off, but it requires more sophisticated real-time coordination across multiple sites. The technical feasibility of pro-rata allocation depends on having a communications and control system capable of issuing different curtailment signals to each project based on its nameplate fraction of the total flexible capacity — a DERMS capability. A hybrid approach specifies individual project curtailment floors (below which a project is not curtailed regardless of system conditions) and ceilings (above which additional curtailment is shared pro-rata among projects that can still contribute). This provides each project with a minimum revenue guarantee while maintaining flexibility for the system operator.
Q8. What is the engineering significance of zero-sequence current in distribution systems, and how does phase imbalance create voltage divergence across the three phases?
Zero-sequence current is the component of current in a three-phase system that flows equally in all three phases in the same direction — as opposed to positive-sequence current (the normal balanced component, rotating forward) and negative-sequence current (the backward-rotating imbalance component). In a perfectly balanced three-phase distribution system, phase currents sum to zero at every node and no current flows in the neutral conductor. When loads are unequally distributed across phases, a zero-sequence component exists: the three phase currents no longer sum to zero, and the difference flows as neutral current. The neutral conductor carries a current proportional to the system imbalance. The voltage divergence phenomenon arises from the interaction of unequal phase currents with the series impedance of the feeder. Each phase experiences a voltage drop proportional to the current flowing in that phase. The most heavily loaded phase experiences the largest voltage drop from the source, resulting in the lowest voltage at the customer end. The most lightly loaded phase experiences the smallest voltage drop and therefore the highest voltage. As these phase currents flow through the feeder's distributed impedance, the voltage differences between phases grow with distance from the substation — the 'fanning' effect. At the end of a long rural feeder, voltage imbalance of 3–5% is common on circuits with significant load imbalance, well above the 2% maximum specified in IEEE standards for equipment compatibility. The power flow controller addresses this by equalizing the upstream phase currents, which equalizes the voltage drops per unit length across all three phases, pulling the downstream voltage profiles back together.
Q9. How should the performance of a power flow controller be characterized across a range of loading conditions, rather than just at a single operating point?
Single-point snapshot performance characterization is insufficient for a device that operates continuously across all loading conditions throughout the year. A comprehensive performance characterization requires a scatter plot approach using a minimum of six months of field data: for each measurement interval (typically 15 minutes), record the feeder loading (in amps at the feeder head), the neutral current with the device off, and the neutral current with the device on (in each available control mode). Plotting neutral current versus loading for each device state reveals the fundamental performance characteristic: without the device, neutral current scales approximately linearly with loading (reflecting that the same proportional imbalance persists regardless of load level). With the device operating, neutral current is suppressed to near the device's residual capability until loading reaches the point where the imbalance exceeds the device rating, at which point the neutral current resumes its linear scaling from the device's maximum injection point upward. This data-driven characterization allows the engineer to determine: the range of loading conditions over which the device provides full correction, the loading level at which device saturation begins, the average annual neutral current reduction (integrating the scatter plot over the load duration curve), and the comparative performance of different control modes. The same approach should be applied to feeder imbalance percentage, maximum phase voltage, and voltage imbalance metrics to fully characterize the device's system-wide impact.
Q10. What cybersecurity considerations apply to dynamic flexible interconnection systems, and how should they be addressed in system design?
Dynamic flexible interconnection systems introduce cybersecurity risks that are qualitatively different from those of conventional passive distribution infrastructure. The communications link between the utility control system and the DER site creates a potential attack surface: an adversary who can intercept or spoof curtailment signals could either prevent legitimate curtailment (causing grid violations) or inject false curtailment signals (reducing DER output when curtailment is not needed, causing economic harm to the developer). Three layers of security are required. Authentication and integrity: all communications between the utility control system and DER controllers must use authenticated protocols with message integrity verification, ensuring that commands originate from the legitimate utility system and have not been modified in transit. Common frameworks include IEEE 2030.5 (Smart Energy Profile) and IEC 61968/61970 with TLS encryption. Availability and redundancy: the communications path must have adequate redundancy and availability for the reliability tier of the application. For flexible interconnection curtailment, communication failures should trigger fail-safe mode (conservative curtailment), so availability requirements are lower than for applications where a communication failure would cause an outage. A 99.5% annual availability target is a reasonable minimum. Access control: the DER controller must accept curtailment commands only from authenticated utility systems, and only operators with appropriate credentials should be able to modify curtailment setpoints or fail-safe parameters. These are not optional design features — they are baseline requirements for any flexible interconnection scheme that places utility-issued curtailment commands on DER equipment in customer facilities.
Q11. How should DER hosting capacity on a feeder be projected forward over a 5–10 year horizon to inform infrastructure investment decisions?
Forward projection of DER hosting capacity requires a scenario-based approach that explicitly represents the two primary drivers of hosting capacity change: the interconnection of new DER projects on the feeder (reducing available hosting capacity) and potential infrastructure upgrades (increasing it). The projection framework should include three scenarios. The base case represents DER growth at the historical average rate of interconnection applications in the feeder's service area, using existing hosting capacity as the starting point and reducing it by the expected annual DER additions. A high-growth case uses the 90th percentile of historical growth rates and accounts for potential clustering effects if the feeder is adjacent to areas with favorable conditions for DER development. An upgrade-deferred case evaluates how flexible interconnection or power flow controller installation changes the trajectory — effectively increasing the available hosting capacity by the amount these technologies can unlock, extending the period before infrastructure upgrades are required. The comparison of these scenarios in present-value terms — the value of deferred infrastructure investment offset by the cost of flexible interconnection program administration and curtailment — provides the economic basis for the investment decision. A critical input to this framework is the accuracy of the DER queue forecast: if a utility has a large interconnection queue in a specific feeder area, that queue represents committed near-term hosting capacity consumption that should be modeled deterministically, not probabilistically.
Q12. What are the contractual and tariff elements that must be included in a flexible interconnection interconnection agreement, and what are the most common disputes that arise in practice?
A flexible interconnection interconnection agreement must specify, at minimum: the nameplate interconnection capacity (the capacity at which the project is permitted to interconnect), the applicable curtailment schedule or threshold framework (whether static, localized, or multi-constraint dynamic), the method by which curtailment signals are issued and the developer's obligation to respond, the fail-safe operating setpoint and the conditions that trigger fail-safe mode, the communications specification (protocol, update rate, availability requirement), the metering and monitoring requirements for compliance verification, the conditions under which the curtailment schedule or thresholds may be revised (and who bears the cost of re-study), the process for adding additional flexible interconnection projects to the same feeder (and how curtailment allocation among projects is handled), and the developer's right to terminate the flexible interconnection arrangement and replace it with a conventional interconnection (at what cost and under what conditions). The most common disputes in practice involve: curtailment amounts in excess of study predictions — typically attributable to fail-safe mode curtailment not disclosed in the study, or changes in feeder conditions since the study; allocation disputes when a second project connects on the same feeder and curtailment burden shifts; and disagreements about who bears the cost of re-study when feeder conditions change materially. Clear and specific language addressing all these scenarios is essential for a durable agreement.
About Keentel Engineering
Keentel Engineering provides distribution planning, DER integration engineering, hosting capacity assessment, flexible interconnection study, and grid modernization services to utilities, developers, fleet operators, and regulatory stakeholders. All client project information is treated as strictly confidential.

About the Author:
Sonny Patel P.E. EC
IEEE Senior Member
In 1995, Sandip (Sonny) R. Patel earned his Electrical Engineering degree from the University of Illinois, specializing in Electrical Engineering . But degrees don’t build legacies—action does. For three decades, he’s been shaping the future of engineering, not just as a licensed Professional Engineer across multiple states (Florida, California, New York, West Virginia, and Minnesota), but as a doer. A builder. A leader. Not just an engineer. A Licensed Electrical Contractor in Florida with an Unlimited EC license. Not just an executive. The founder and CEO of KEENTEL LLC—where expertise meets execution. Three decades. Multiple states. Endless impact.
Services

Let's Discuss Your Project
Let's book a call to discuss your electrical engineering project that we can help you with.
About the Author:
Sonny Patel P.E. EC
IEEE Senior Member
In 1995, Sandip (Sonny) R. Patel earned his Electrical Engineering degree from the University of Illinois, specializing in Electrical Engineering . But degrees don’t build legacies—action does. For three decades, he’s been shaping the future of engineering, not just as a licensed Professional Engineer across multiple states (Florida, California, New York, West Virginia, and Minnesota), but as a doer. A builder. A leader. Not just an engineer. A Licensed Electrical Contractor in Florida with an Unlimited EC license. Not just an executive. The founder and CEO of KEENTEL LLC—where expertise meets execution. Three decades. Multiple states. Endless impact.
Leave a Comment
We will get back to you as soon as possible.
Please try again later.
Related Posts