A Coordinated Electric System Interconnection Review—the utility’s deep-dive on technical and cost impacts of your project.
Challenge: Frequent false tripping using conventional electromechanical relays
Solution: SEL-487E integration with multi-terminal differential protection and dynamic inrush restraint
Result: 90% reduction in false trips, saving over $250,000 in downtime
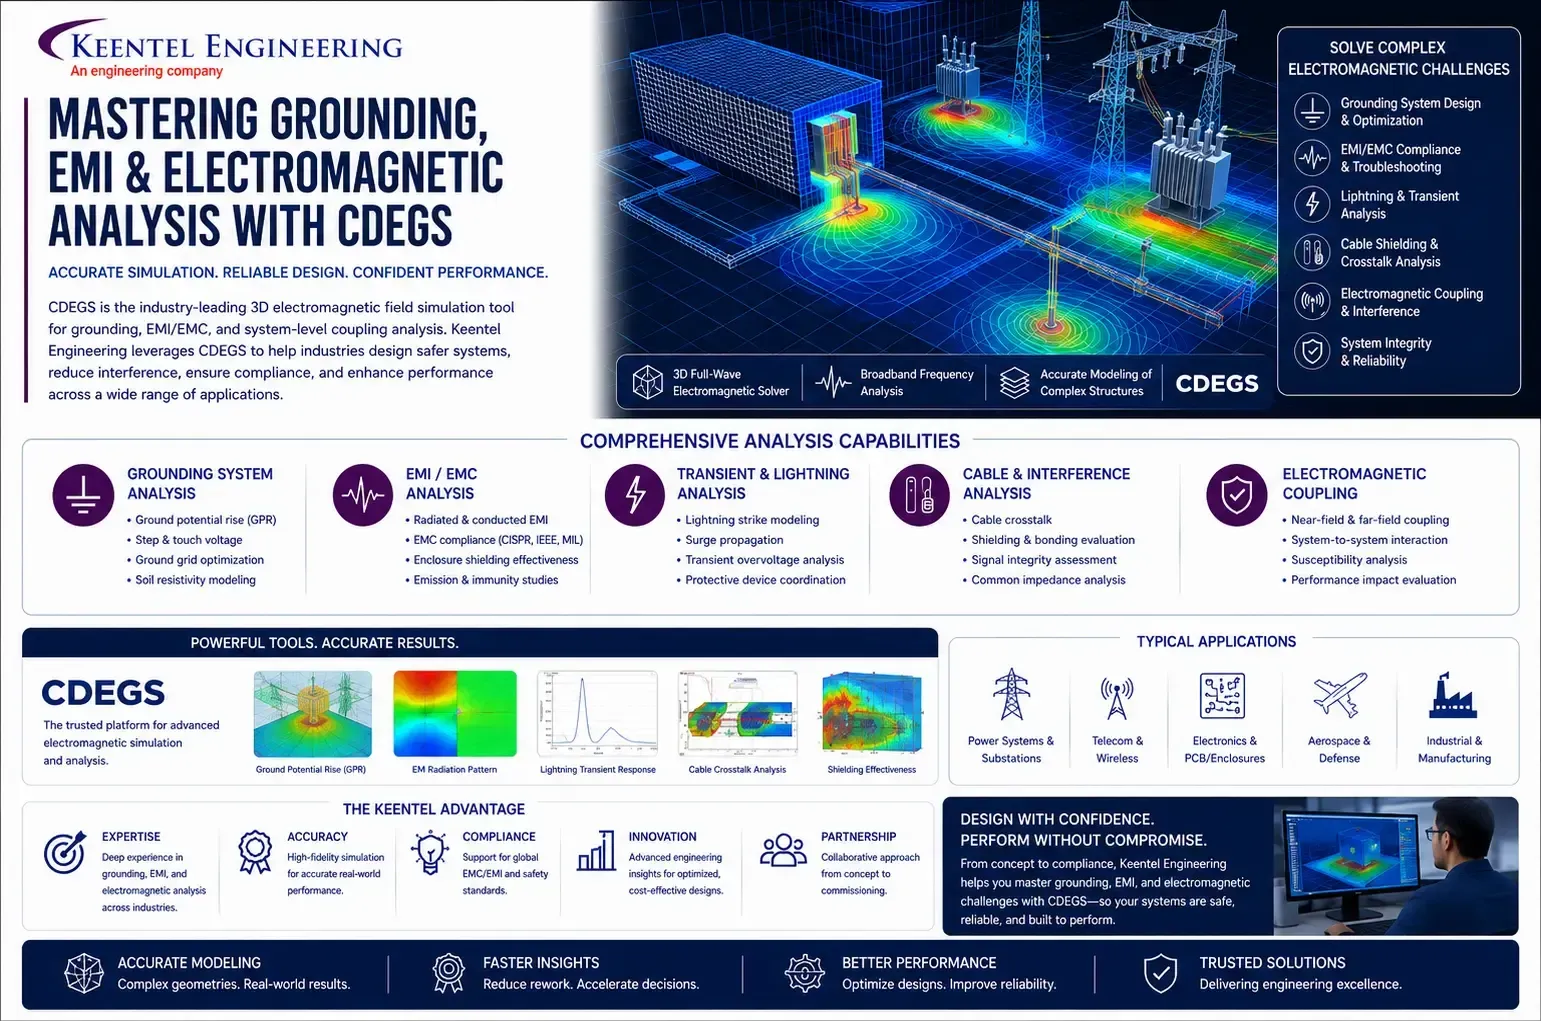
Inside CDEGS The Industry Standard for Grounding and Electromagnetic Analysis
May 17, 2026 | Blog
When a power system engineer is asked to certify that a substation is safe to walk on during a fault, that an underground pipeline running parallel to a transmission corridor will not corrode prematurely due to AC interference, or that a buried fibre optic cable will survive a nearby lightning strike, only a handful of software platforms in the world can answer those questions credibly. CDEGS — developed by Safe Engineering Services & Technologies Ltd. (SES) — is widely regarded as the most powerful and accurate commercial suite available for grounding, earthing, and electromagnetic analysis. At Keentel Engineering, CDEGS is the analytical backbone behind a significant portion of our power system studies practice.
This article is the first in a Keentel Engineering series that unpacks what CDEGS actually does, why it matters for utilities, EPC contractors, and asset owners, and how our engineers apply it to deliver defensible, standards-aligned engineering outcomes.
What CDEGS Is — and Why It Exists
CDEGS stands for Current Distribution, Electromagnetic Fields, Grounding and Soil Structure Analysis. It is an integrated suite of computation modules and specialized software packages that solve a class of physical problems that simpler tools cannot: problems where soil heterogeneity, complex three-dimensional conductor networks, frequency-dependent behaviour, and electromagnetic coupling all interact simultaneously.
Traditional design hand-calculations — and even general-purpose finite-element packages — struggle in this domain because the physics couples low-frequency
power flow, high-frequency transients, soil resistivity layering, and inductive/capacitive/conductive coupling between conductors that may be kilometres apart. CDEGS was purpose-built for it.
Why this matters for asset owners
Inaccurate grounding and EMI analysis carries real consequences: dangerous touch and step voltages, regulatory non-compliance, accelerated pipeline corrosion, telecommunications damage, and exposure to litigation following an incident. A rigorous CDEGS-based study is, in practical terms, a risk-mitigation investment.
The Architecture: Computation Modules and Specialized Packages
| Module | Primary Function |
|---|---|
| RESAP | Soil resistivity analysis — interprets field measurements and derives uniform, two-layer, or multilayer soil models. |
| FCDIST | Fault current distribution — calculates how much of a fault current returns through the grounding system versus shield wires, neutrals, and earth. |
| MALT | Low-frequency grounding analysis — computes earth potential rise (EPR), touch voltages, step voltages, and grid resistance using a uniform or two-layer soil model. |
| MALZ | Frequency-dependent grounding analysis in multilayer soil — extends MALT to handle frequency variation and arbitrarily layered soils. |
| TRALIN | Transmission line parameters — calculates self and mutual impedances, capacitances, and electromagnetic parameters of overhead lines and underground cables. |
| SPLITS | Current split / circuit analysis — distributes currents through complex multi-conductor networks including shield wires, counterpoise, and pipelines. |
| HIFREQ | High-frequency electromagnetic field analysis — full-wave electromagnetic field solver capable of modelling grounding and conductor networks across a very wide frequency range, including transient and lightning studies. |
| FFTSES | Fourier transform processor — converts frequency-domain HIFREQ results into time-domain responses for transient, lightning, and switching surge analysis. |
CDEGS is not a single program — it is a suite. Understanding its structure is essential to understanding what the software can and cannot do. The suite is organized into two layers: a set of core computation engines (the modules), and a set of integrated workflows and specialized packages that wrap those engines for specific engineering tasks.
The Integrated and Specialized Packages
Layered on top of the computation modules are application-focused packages. These exist because the modules, while extraordinarily capable, are also extraordinarily configurable — and most real-world engineering tasks fall into a few recurring categories. The specialized packages encapsulate workflows, defaults, and post-processing for those categories.
- AutoGrid Pro — End-to-end grounding grid design workflow combining RESAP, FCDIST, and MALT in either two-layer or multilayer soil configurations.
- AutoGroundDesign — Automated grounding grid design and optimization tool that iterates conductor layouts to meet safety targets economically.
- Right-of-Way Pro — Comprehensive AC interference and electromagnetic compatibility studies along shared transmission/pipeline/railway corridors.
- SESTLC Pro — Simplified transmission line and cable inductive coupling calculator for screening-level interference assessments.
- SESEnviroPlus — Environmental electromagnetic field assessments (audible noise, radio interference, magnetic and electric field exposure).
- CorrCAD / CorrCAD Plus — AC corrosion analysis and cathodic protection modelling for buried pipelines and metallic structures.
- SESShield-2D and SESShield-3D — Lightning shielding design for substations and transmission lines using rolling sphere and electrogeometric methods.
The Tiered Licensing Model
CDEGS is licensed in tiered configurations to match practitioner needs. The hierarchy is important for clients to understand because it determines which physical phenomena can actually be analyzed. From most basic to most comprehensive:
- AutoGround — Basic grounding design with RESAP, FCDIST, MALT, AutoGrid Pro, and AutoGroundDesign.
- MultiGround / MultiGround Lite / MultiGround+ — Progressively expanded grounding-focused packages, with MultiGround+ adding TRALIN, SPLITS, and Right-of-Way Pro for inductive coupling studies.
- MultiGroundZ family — Adds MALZ for frequency-dependent grounding analysis in arbitrary multilayer soils.
- MultiLines — TRALIN and SPLITS only, focused on transmission line parameter and current-distribution studies.
- MultiFields family — Adds HIFREQ and FFTSES for full electromagnetic field and transient analysis.
- CDEGS (full suite) — All eight computation modules and all specialized packages; the complete capability set.
Keentel Engineering operates with the configurations required to deliver the studies our clients commission — meaning grounding, EMI, AC interference, lightning, and transient analyses can all be performed in-house without subcontracting to third parties.
The Phenomena CDEGS Can Analyze
To understand why the suite is so widely adopted across utilities, oil and gas operators, railway authorities, and renewable energy developers, it helps to enumerate the engineering questions it answers:
- What is the actual soil structure beneath my site, and what soil model should be used for design?
- During a worst-case fault, what is the earth potential rise at my substation, and are touch and step voltages within IEEE Std 80 / IEC 61936 / EN 50522 limits?
- How much fault current actually returns through the local grid versus shield wires, neutrals, or remote sources?
- Are induced voltages on a nearby pipeline, railway, or telecommunications cable within safe limits under steady-state operation and fault conditions?
- Will my pipeline experience AC corrosion at unacceptable rates, and what mitigation is required?
- Is my substation properly shielded against direct lightning strikes?
- What are the transient overvoltages on grounding conductors and equipment cases during a lightning strike or switching event?
- Are public and worker electromagnetic field exposures within regulatory thresholds (ICNIRP, IEEE C95.6)?
Why Keentel Engineering Uses CDEGS
Keentel Engineering has standardized on CDEGS for three reasons: technical fidelity, regulatory acceptance, and breadth of analysis. Technically, CDEGS handles physics that simpler tools approximate or ignore — multilayer soils, frequency-dependent conductor behaviour, full electromagnetic coupling, and transient time-domain conversion. Regulatorily, results from CDEGS are widely accepted by utility engineering departments, regulators, and independent reviewers worldwide; this matters when our studies are submitted as part of grid connection applications, environmental assessments, or post-incident investigations. And in terms of breadth, a single platform handles grounding design, AC interference, corrosion, lightning, and EMF — meaning our clients receive coherent, internally consistent analysis across all these domains.
The remaining articles in this series take each domain in turn: soil modelling, substation grounding, transmission line EMI on pipelines, AC corrosion, lightning shielding, and transient analysis. Together they form a practical guide to how Keentel Engineering applies CDEGS to deliver power system studies that stand up to scrutiny.
Substation Grounding Design with CDEGS From Soil Test to Safe Substation
Grounding design is one of those quietly critical disciplines: invisible when it works, catastrophic when it does not. A substation grounding grid is the last line of defence between a fault current and the people, animals, and equipment within and around the facility. Done well, it limits earth potential rise, keeps touch and step voltages within safe thresholds, and provides a low-impedance return path for fault and lightning currents. Done poorly — or designed using oversimplified soil assumptions — it can leave the asset owner exposed to safety, regulatory, and litigation risk for the operational lifetime of the substation.
This blog walks through how Keentel Engineering uses the CDEGS suite to take a substation grounding design from raw field data to a fully certified, IEEE Std 80–compliant deliverable.
Step 1 — Soil Resistivity Modelling with RESAP
Every credible grounding design begins with a soil resistivity survey. The Wenner four-pin method is the most common technique, producing apparent resistivity values as a function of electrode spacing. The trap many designers fall into is treating the average of these readings as a single soil resistivity and proceeding with uniform-soil hand calculations. This almost always produces incorrect grid resistance and dangerously misleading touch and step voltage predictions.
RESAP, the soil analysis module, takes raw Wenner data and inverts it into a layered soil model. For most sites, a two-layer model is adequate; for geologically complex sites — alluvial floodplains, weathered bedrock zones, mining-impacted areas — a multilayer model is essential. RESAP performs the curve-fitting automatically and provides goodness-of-fit metrics so the engineer can judge whether additional measurement spacings are needed.
Engineering insight
A two-layer soil model with a 10 Ω·m surface layer over 1000 Ω·m bedrock will produce vastly different touch voltages than a uniform 200 Ω·m assumption — even though both might match the same average apparent resistivity reading. Soil modelling is not a formality; it is the foundation on which every subsequent calculation depends.
Step 2 — Fault Current Distribution with FCDIST
Not all of a substation's fault current returns to its source through the local grounding grid. A significant portion typically returns via overhead shield wires, transmission line neutrals, distribution feeders, and adjacent infrastructure. The fraction that does flow into the grid — known as the grid current or the split factor — is what actually drives earth potential rise and touch/step voltages.
FCDIST calculates this split factor by modelling the complete fault current return circuit: the local grid, the connected transmission lines and their shield wires, remote terminal grounding impedances, and any auxiliary return paths. The result is a defensible value for grid current to use in the grounding analysis — typically far lower than the total fault current, and based on physics rather than rule-of-thumb estimates.
Step 3 — Grounding Grid Analysis with MALT
With the soil model and grid current established, the actual grounding analysis begins. MALT computes:
- Grid resistance to remote earth.
- Earth potential rise (EPR) — the voltage of the entire grid relative to remote earth during the fault.
- Touch voltages — the voltage between any reachable metallic object and the soil at a person's feet.
- Step voltages — the voltage between a person's two feet standing on the ground above or near the grid.
- Surface potential profiles — colour-contoured maps showing voltage gradients across and beyond the grid.
These outputs are then compared against safety limits derived per IEEE Std 80, which depend on fault clearing time, body weight assumption, surface insulating layer (typically crushed rock), and fibrillation current criteria. The CDEGS Output Toolbox computes these limits automatically using the same series-expansion approach that IEEE Std 80 prescribes, including the asymmetry decrement factor that adjusts for the DC offset in fault current waveforms.
How Safety Limits Are Computed
CDEGS calculates the maximum allowable touch voltage as the product of the fibrillation current and the total resistance to current flow through the human body. The fibrillation current follows the well-known relationship I_f = 0.116 / √T_f for a 50 kg body, where T_f is the fault clearing time in seconds. The total resistance combines a 1000 Ω body resistance with foot resistance calculated by series expansion to account for any insulating surface layer.
For a 0.25-second fault clearing time, a 100 Ω·m top-layer soil, and no insulating surface, the calculation yields a touch voltage limit of approximately 267 V. The presence of a 100 mm crushed rock layer with 3000 Ω·m resistivity raises this limit substantially. CDEGS handles all of this automatically through the Output Toolbox, with full transparency into which parameters drove which result.
Step 4 — Iterative Optimization with AutoGroundDesign
A first-pass grid design rarely meets safety targets economically. The engineer must iterate: add more conductors, deepen the burial, add ground rods, extend the perimeter, increase mesh density in high-voltage-gradient areas. Done manually, this is laborious. AutoGroundDesign automates the iteration loop, systematically modifying grid geometry to meet user-specified safety targets at minimum cost. The output is not just a compliant design, but a defensibly optimal one.
Common Modelling Considerations
Reinforced Concrete Foundations
A frequent question is whether concrete-encased rebar in foundations needs to be modelled explicitly. The practical answer is no — concrete in the ground assumes approximately the same resistivity as the surrounding soil, since both materials are dominated by moisture content. As long as the concrete covers approximately the same area as the embedded rebar, the foundation's contribution to grounding can be modelled by treating the concrete volume as soil with the surrounding soil's properties. When the rebar is bonded to the grounding grid, the foundation forms an effective equipotential surface and touch voltages above it are not a concern. This guidance aligns with IEEE Std 80, Section 14.6.
Conductive Backfill (Bentonite, GEM)
Where low-resistivity backfill is used around ground rods or grid conductors, two modelling approaches work well. For small grids analyzed in MALT, the conductor diameter can be increased to match the backfill volume — a 3/8 inch rod in a 12 inch backfilled hole is modelled as a 12 inch diameter conductor. For more rigorous analysis in MALZ or HIFREQ, the backfill can be represented as a thick coating with its actual thickness and resistivity. Both approaches are valid; the choice depends on the module being used and the level of fidelity required.
Handling Short Conductors and Subdivision Warnings
When complex grid geometries are modelled, the conductor subdivision process sometimes generates short segments that violate the thin-wire assumption used by the integral-equation solver. CDEGS provides two paths to resolve this: relax the thin-wire approximation ratio in the System / Advanced screen when a small number of short segments exist, or export the subdivided geometry (the .F07 or .F17 file) back into SESCAD, clean up the short conductors, and re-import. Both approaches are part of the standard Keentel workflow on geometrically complex sites.
Deliverables Clients Receive
A Keentel Engineering substation grounding study includes: the validated soil model with measurement curve-fit, the fault current distribution analysis with documented assumptions for remote terminals, the as-designed grid geometry with conductor and rod schedule, MALT computational results including EPR and worst-case touch/step voltages with safety-limit comparisons, surface potential contour maps, sensitivity analysis around uncertain input parameters, and a written report aligned with IEEE Std 80, IEC 61936-1, EN 50522, or other applicable jurisdictional standards as required.
Inductive EMF and AC Interference Protecting Pipelines, Railways, and Telecoms
When a high-voltage transmission line shares a corridor with a buried steel pipeline, a railway, or a telecommunications cable, an invisible interaction takes place. The transmission line's magnetic field induces voltages on the nearby parallel conductor. Under steady-state load this induced voltage is usually modest; during a single-line-to-ground fault on the transmission line, it can rise to thousands of volts in milliseconds. The consequences range from accelerated AC corrosion of pipelines, to dangerous touch voltages at pipeline appurtenances, to equipment damage on telecommunications systems, to safety hazards for personnel performing maintenance.
This blog explains how Keentel Engineering uses CDEGS — specifically the Right-of-Way Pro package combined with TRALIN, SPLITS, MALZ, and HIFREQ — to quantify these effects and design effective mitigation.
The Physics in Brief
Three coupling mechanisms transfer energy from the transmission line to the parallel structure:
- Inductive coupling — the time-varying magnetic field of the transmission line induces longitudinal EMFs on the parallel conductor. This is the dominant mechanism during fault conditions and on long parallels.
- Conductive coupling — when a fault occurs, the resulting earth potential rise propagates outward through the soil and raises the local earth potential at the parallel structure relative to remote earth. Pipelines and other buried metallic structures pick this up through their coating resistance and grounding connections.
- Capacitive coupling — the electric field of the transmission line induces voltages on insulated above-ground structures. This matters mostly for ungrounded equipment or aerial structures, not buried pipelines.
All three are present simultaneously in a real corridor. A defensible interference study must quantify all three and combine them appropriately.
The CDEGS Workflow for Right-of-Way Studies
TRALIN — Transmission Line Parameters
TRALIN computes the per-unit-length series impedance and shunt admittance matrices of the transmission line system, accounting for conductor geometry, bundle configuration, shield wires, soil resistivity, and frequency. These parameters drive everything downstream. TRALIN handles arbitrarily complex line configurations: multi-circuit lines, transpositions, shield wire arrangements, and underground cable systems.
SPLITS — Multi-Conductor Network Analysis
SPLITS solves the coupled circuit equations for a long parallel corridor, dividing it into sections where the geometry is approximately constant. Within each section, TRALIN-derived parameters describe the electromagnetic coupling between every pair of conductors — line phases, shield wires, pipeline, neutrals, counterpoise. SPLITS then assembles these section models with the appropriate terminal conditions (grids, source impedances, pipeline insulating joints, mitigation wires) and solves for currents and voltages everywhere along the corridor.
The strength of this approach is that it captures the full longitudinal distribution: where on the pipeline the induced voltage peaks, where mitigation wires are most effective, and how changes in terrain or proximity propagate along the corridor.
MALZ and HIFREQ — When More Resolution Is Needed
For point-of-interest analysis — at a pipeline test post, an above-ground appurtenance, or a substation–pipeline crossing — MALZ provides frequency-dependent grounding analysis in multilayer soil, and HIFREQ provides full-wave electromagnetic field analysis. These are used when the corridor study identifies hot spots that warrant detailed three-dimensional modelling, or when high-frequency transients from lightning or switching surges must be analyzed.
Modelling Conductor Bundles in HIFREQ
Transmission lines often use bundled conductors — two, three, or four sub-conductors per phase held in formation by spacers. Modelling each sub-conductor explicitly is wasteful of memory and computation time. CDEGS provides two pragmatic approaches:
- For computation points more than a few bundle diameters away from the line, the entire bundle can be represented as a single equivalent conductor. The local field structure near the bundle is lost, but far-field effects — which are what interference studies care about — are preserved.
- Where bundle impedance matters, a hollow conductor approximation works well. The outer radius is set equal to the bundle's outer dimension to reproduce inductance and capacitance; the inner radius is set so the cross-sectional metal area matches the total area of all sub-conductors, reproducing the DC resistance. The composite impedance is accurate to tens of kilohertz.
What Studies Typically Conclude
A Keentel Engineering AC interference study delivers, for each operating scenario (steady-state, single-phase-to-ground fault at multiple fault locations, sometimes lightning):
- Longitudinal voltage profile along the pipeline relative to remote earth and relative to local soil.
- Coating stress voltage profile — the voltage across the pipeline coating, which drives AC corrosion and coating breakdown.
- Touch voltage at test posts, valves, cathodic protection rectifier sites, and any above-ground appurtenance.
- Induced current magnitudes and frequencies for assessing AC corrosion risk per ISO 18086 / NACE SP21424.
- Recommended mitigation — typically some combination of mitigation wires (gradient control wires installed alongside the pipeline), grounding mats at exposed appurtenances, polarization cells or solid-state decouplers, and modifications to cathodic protection.
Standards Framework
Keentel Engineering AC interference studies are aligned with the relevant jurisdictional and industry standards, which may include CIGRE Technical Brochure 95, EN 50443, IEEE Std 367, NACE SP0177, ISO 18086, CSA C22.3 No. 6, and AS/NZS 4853 depending on the asset and jurisdiction. The choice of standard affects acceptance criteria for steady-state induced voltage (typically 15 V for safety, sometimes 4 V for AC corrosion control), fault-condition limits (typically 1000 V for coating stress, lower for touch voltage), and mitigation design philosophy.
High-Frequency, Lightning, and Transient Analysis Where HIFREQ and FFTSES Shine
Power frequency analysis assumes sinusoidal steady state at 50 or 60 Hz. Most real engineering problems are not that tidy. Lightning is a fast transient with significant energy from DC to several megahertz. Switching surges contain frequencies from hundreds of hertz to tens of kilohertz. Faults are accompanied by DC offsets and harmonic content. Ground impedance behaves very differently at 1 MHz than at 50 Hz. To analyze any of these phenomena properly, the analysis platform must handle frequency-dependent soil and conductor behaviour, full electromagnetic coupling, and the conversion between frequency and time domains.
HIFREQ and FFTSES are the CDEGS modules that handle this regime. Together they enable Keentel Engineering to deliver lightning protection studies, transient ground potential rise analysis, switching surge studies, and high-frequency EMC investigations.
HIFREQ — The Full-Wave Solver
HIFREQ is a method-of-moments-based electromagnetic field solver. It models conductor networks as collections of segments, each with its own electrical properties and electromagnetic interactions with every other segment. Unlike MALT or MALZ, HIFREQ does not assume that current distribution along a conductor is uniform or that displacement currents are negligible. It solves the full Maxwell equations in a frequency-domain sense accounting for propagation effects, radiation, and frequency-dependent soil response.
This makes HIFREQ the right tool for problems where conductor lengths are comparable to or larger than the electromagnetic wavelength — which, at 1 MHz, is 300 metres in free space and even shorter in soil. Substation grounding at lightning frequencies, large industrial grounding systems under fast transients, and any analysis involving radiation or propagation along extended conductors all fall into this regime.
Modelling Coaxial Cables and Complex Conductors
HIFREQ supports direct modelling of coaxial cables, hollow conductors (used for bundle equivalents as discussed in the previous blog), and conductors with insulating coatings or conductive backfill. The coaxial cable model is particularly valuable for studying shielded power and instrumentation cables under transient conditions — where the difference between core and shield response can determine equipment damage.
Adjusting Internal Impedance
For specialized applications, the internal impedance of a HIFREQ conductor can be adjusted indirectly by modifying its resistivity and radius until a target internal impedance is reached. The verification approach is to run a single-conductor test case and inspect the output file for the 'Internal Impedance' string. External self-impedance, by contrast, is geometry-determined and cannot be modified directly. These are the kinds of low-level controls that distinguish CDEGS from screening-level tools — they exist for the specialists who need them.
FFTSES From Frequency Domain to Time Domain
HIFREQ solves the problem at one frequency at a time. To analyze a transient — a lightning strike, a switching surge, a fault inception — the response must be computed across a band of frequencies and then transformed into the time domain. FFTSES performs this transformation using the fast Fourier transform, taking a user-defined excitation waveform (typically a lightning current or switching voltage), decomposing it into its frequency spectrum, instructing HIFREQ to solve at the relevant frequencies, and reassembling the time-domain response of voltages and currents anywhere in the modelled system.
Extracting Time-Domain Results
The default FFTSES output provides 'snapshots' of fields at selected times or extreme values over time. For detailed time evolution at specific points — the voltage waveform at a transformer neutral during a lightning strike, the current waveform in a down-conductor — the Animation feature is used. Activated from the Inverse Transform computation screen, it produces a file (FT_JobID.F85) listing field values at every requested time step. While the file is not directly spreadsheet-compatible, the FileView utility with Filter and Copy in tab-separated format produces output that imports cleanly into Excel or any spreadsheet platform for further post-processing and reporting.
Practical Applications
Lightning Protection of Substations
Lightning is statistically the dominant cause of unplanned outages in many transmission and distribution networks. Effective protection requires two things: keeping the strike off vulnerable equipment (shielding analysis, handled by SESShield-3D), and managing the energy when it does strike (grounding and bonding analysis, handled by HIFREQ and FFTSES). The latter analysis quantifies the transient earth potential rise, the voltages appearing on equipment cases relative to remote ground, the current-sharing among down-conductors, and the stress on insulation systems. Without this analysis, lightning protection design becomes a matter of compliance with prescriptive standards rather than engineering certainty.
Transient GPR and Equipment Stress
During a lightning strike or fast switching event, the apparent ground impedance is much higher than the 50/60 Hz value because of the soil's frequency-dependent properties and the inductive impedance of the grid conductors themselves. A grid with 0.5 Ω resistance at power frequency may exhibit 10 Ω or more impedance at lightning frequencies, leading to transient GPR an order of magnitude higher than would be predicted from a power-frequency-only analysis. HIFREQ and FFTSES quantify this directly, allowing equipment insulation coordination to be performed against realistic stresses.
Memory and Performance Considerations
Method-of-moments solvers like HIFREQ scale roughly as the cube of the number of conductor segments. Large models — substation grids with detailed equipment connections, or long transmission corridors discretized for high-frequency analysis — can consume substantial memory and runtime. CDEGS provides several optimization levers: reducing mesh density where electromagnetic gradients are mild, minimizing per-conductor subdivision numbers consistent with accuracy, and consolidating collinear segments into single conductors. Keentel Engineering's standard approach is to develop a coarse model first to identify regions of interest, then locally refine only where necessary.
Frequently Asked Questions — Keentel Engineering on CDEGS
This FAQ consolidates the questions our clients, project managers, and reviewing engineers most often raise about CDEGS-based studies. It is organized by topic for ease of reference, and answers are intentionally practical: what we do, why we do it, and what it means for the deliverable.
General Capability
Q1. What kinds of studies can CDEGS perform?
CDEGS performs soil resistivity analysis, substation and industrial grounding design, fault current distribution analysis, AC interference and EMI studies on pipelines and other parallel infrastructure, AC corrosion analysis, lightning shielding design, transient ground potential rise analysis, electromagnetic field exposure assessments, and transmission line parameter calculations. It is the most comprehensive commercial platform for these analyses available.
Q2. How does CDEGS compare to spreadsheet-based or screening tools?
Screening tools are useful for first-pass sanity checks and for sites where soil and geometry are uniform and well-understood. CDEGS becomes essential when soil is non-uniform, when grids are large or geometrically complex, when frequency-dependent or transient effects matter, or when the study results will be subject to regulatory or third-party review. In our experience, the majority of real-world projects fall into the latter category.
Q3. Is CDEGS accepted by utilities and regulators?
Yes. CDEGS is widely accepted by transmission and distribution utilities, regulatory bodies, and independent reviewing engineers worldwide. Its physics-based approach and long track record make it the de facto standard for grounding and electromagnetic studies. Studies produced using CDEGS are routinely submitted in support of grid connection applications, environmental assessments, and post-incident investigations.
Soil Modelling
Q4. How many soil resistivity measurements do you need?
A typical Wenner soil resistivity survey uses electrode spacings from 0.5 m to at least the maximum grid dimension — often 1, 2, 5, 10, 20, 50, and 100 m, sometimes more. Multiple traverses (typically two perpendicular to each other, plus a diagonal) are taken to verify that the soil is reasonably homogeneous laterally. Twelve to twenty data points per traverse is typical.
Q5. When is a multilayer soil model needed instead of two-layer?
Whenever the RESAP curve fit to a two-layer model is poor — typically indicated by visible misfit at certain electrode spacings or a high RMS error. Sites with weathered bedrock, alluvial layering, frozen layers, or significant moisture stratification often require three or more layers for an accurate fit.
Modelling Practicalities
Q6. Do reinforced concrete foundations need to be modelled explicitly?
Generally no. Concrete in soil takes on approximately the same resistivity as the surrounding soil because both are moisture-dominated. As long as the rebar is bonded to the grounding grid, the foundation acts as a near-equipotential surface, and the concrete volume can be modelled as soil with the surrounding properties. IEEE Std 80 Section 14.6 provides further detail on this approach.
Q7. How do we model conductive backfill (Bentonite, GEM) around ground rods?
Two methods, depending on the module. For MALT, the conductor diameter is increased to match the backfill volume — a 3/8 inch rod in a 12 inch backfilled hole is modelled as a 12 inch diameter conductor. For MALZ or HIFREQ, the backfill is modelled as a coating on the conductor with the actual thickness and the actual backfill resistivity. Both methods are valid; the choice depends on the analysis being performed.
Q8. How are bundled transmission line conductors handled?
For most interference studies, the bundle is represented as a single equivalent conductor located at the bundle's geometric centre — accurate for computation points more than a few bundle diameters away. Where bundle impedance matters at higher frequencies, a hollow conductor is used: outer radius equal to the bundle radius (for correct inductance and capacitance), inner radius chosen so the metal cross-section area equals the total of all sub-conductors (for correct DC resistance). This approximation is accurate to tens of kilohertz.
Safety Limits and Standards
Q9. The model flags short conductors that violate the thin-wire assumption. What does that mean and how is it handled?
The thin-wire assumption underlies the integral-equation solver used by MALT, MALZ, and HIFREQ. It requires conductor lengths to be substantially greater than their radii. Very short segments — often produced by automatic subdivision at intersections — can violate this and produce numerical artifacts. The fix is either to relax the thin-wire approximation ratio in the System / Advanced screen (acceptable when only a few short segments exist), or to export the subdivided geometry to SESCAD, clean it up, and re-import. Both approaches are part of our standard workflow.
Q10. How does CDEGS compute touch and step voltage safety limits?
CDEGS computes safety limits per IEEE Std 80, using the fibrillation current relationship I_f = 0.116 / √T_f (for a 50 kg body — there is also a 70 kg option) and a series-expansion treatment of foot resistance to account for any insulating surface layer. The total resistance combines a 1000 Ω body resistance with the foot resistance, and an asymmetry decrement factor adjusts for fault-current DC offset. All parameters are user-configurable, so studies can be performed to any major standard — IEEE Std 80, IEC 61936-1, EN 50522, AS 2067, GB/T 50065, and others.
Q11. What if the calculated touch voltage exceeds the safety limit?
Several mitigations are available: increasing grid density, adding ground rods (particularly at fence corners and high-gradient regions), adding a high-resistivity surface layer (crushed rock is the standard choice), extending the grid beyond the substation fence, or — in interference studies — adding gradient control wires or grounding mats at touch-accessible locations. CDEGS allows each option to be evaluated quickly so that the most cost-effective combination is selected.
AC Interference and EMI
Q12. What is the typical acceptance criterion for steady-state induced voltage on a pipeline?
Most standards adopt 15 V for personnel safety under steady-state conditions, though some use 4 V where AC corrosion is the binding concern. Under fault conditions, the typical limit on coating stress voltage is 1000 V, with touch voltage limits at exposed appurtenances driven by the fault clearing time per the standard's safety curves. The exact criteria depend on jurisdiction and the standards adopted by the project — CIGRE TB 95, EN 50443, NACE SP0177, ISO 18086, IEEE Std 367, and others have differing limits and analytical conventions.
Q13. What mitigation options does CDEGS help evaluate?
Gradient control / mitigation wires (typically bare conductors installed parallel to the pipeline), grounding mats at test posts and valve sites, polarization cells or solid-state decouplers at insulating joints, changes in cathodic protection coordination, modifications to the transmission line shield wire grounding, and physical re-routing of either asset. CDEGS allows each option to be modelled and the resulting voltages compared against acceptance criteria.
Practical Output Handling
Q14. Can FFTSES time-domain results be exported to Excel?
Yes. The Animation feature in FFTSES produces an F85 file with full time-evolution data. Using the FileView utility's Filter and Copy function in tab-separated format, the data imports directly into Excel or any spreadsheet. This is the standard pathway when transient waveforms need to be included in client reports or further post-processed.
Q15. Are there model size limits in CDEGS?
Historical limits — 4,000 conductors in Windows 95/98/Me, 5,000 in Windows NT — are essentially obsolete on modern operating systems. Practical limits today are driven by available RAM and acceptable runtime. For large models, the standard optimization strategies apply: reduce mesh density where gradients are mild, minimize per-conductor subdivision numbers, and consolidate collinear segments. Keentel Engineering routinely models grids with tens of thousands of segments using these techniques.
Engagement and Deliverables
Q16. What does Keentel Engineering typically deliver?
A complete study report covering: scope and basis of design, applicable standards, soil model with curve-fit validation, system data and assumptions, computational results with all relevant safety-limit comparisons, sensitivity analysis around uncertain inputs, conclusions and recommendations, and supporting CDEGS input files and figures. Where required, we also provide drawings, bills of materials for grounding and mitigation conductors, and verification procedures for post-installation testing.
Q17. How long does a typical study take?
A focused substation grounding study with available soil data typically completes within two to four weeks. A complex AC interference study along a long corridor with multiple operating scenarios may take six to ten weeks. Lightning and transient studies generally fall between these. Timelines depend heavily on data availability, scope definition, and review cycles — early engagement and good data shorten delivery significantly.
About the Author:
Sonny Patel P.E. EC
IEEE Senior Member
In 1995, Sandip (Sonny) R. Patel earned his Electrical Engineering degree from the University of Illinois, specializing in Electrical Engineering . But degrees don’t build legacies—action does. For three decades, he’s been shaping the future of engineering, not just as a licensed Professional Engineer across multiple states (Florida, California, New York, West Virginia, and Minnesota), but as a doer. A builder. A leader. Not just an engineer. A Licensed Electrical Contractor in Florida with an Unlimited EC license. Not just an executive. The founder and CEO of KEENTEL LLC—where expertise meets execution. Three decades. Multiple states. Endless impact.
Services

Let's Discuss Your Project
Let's book a call to discuss your electrical engineering project that we can help you with.
About the Author:
Sonny Patel P.E. EC
IEEE Senior Member
In 1995, Sandip (Sonny) R. Patel earned his Electrical Engineering degree from the University of Illinois, specializing in Electrical Engineering . But degrees don’t build legacies—action does. For three decades, he’s been shaping the future of engineering, not just as a licensed Professional Engineer across multiple states (Florida, California, New York, West Virginia, and Minnesota), but as a doer. A builder. A leader. Not just an engineer. A Licensed Electrical Contractor in Florida with an Unlimited EC license. Not just an executive. The founder and CEO of KEENTEL LLC—where expertise meets execution. Three decades. Multiple states. Endless impact.
Leave a Comment
We will get back to you as soon as possible.
Please try again later.
Related Posts