1. Executive Summary
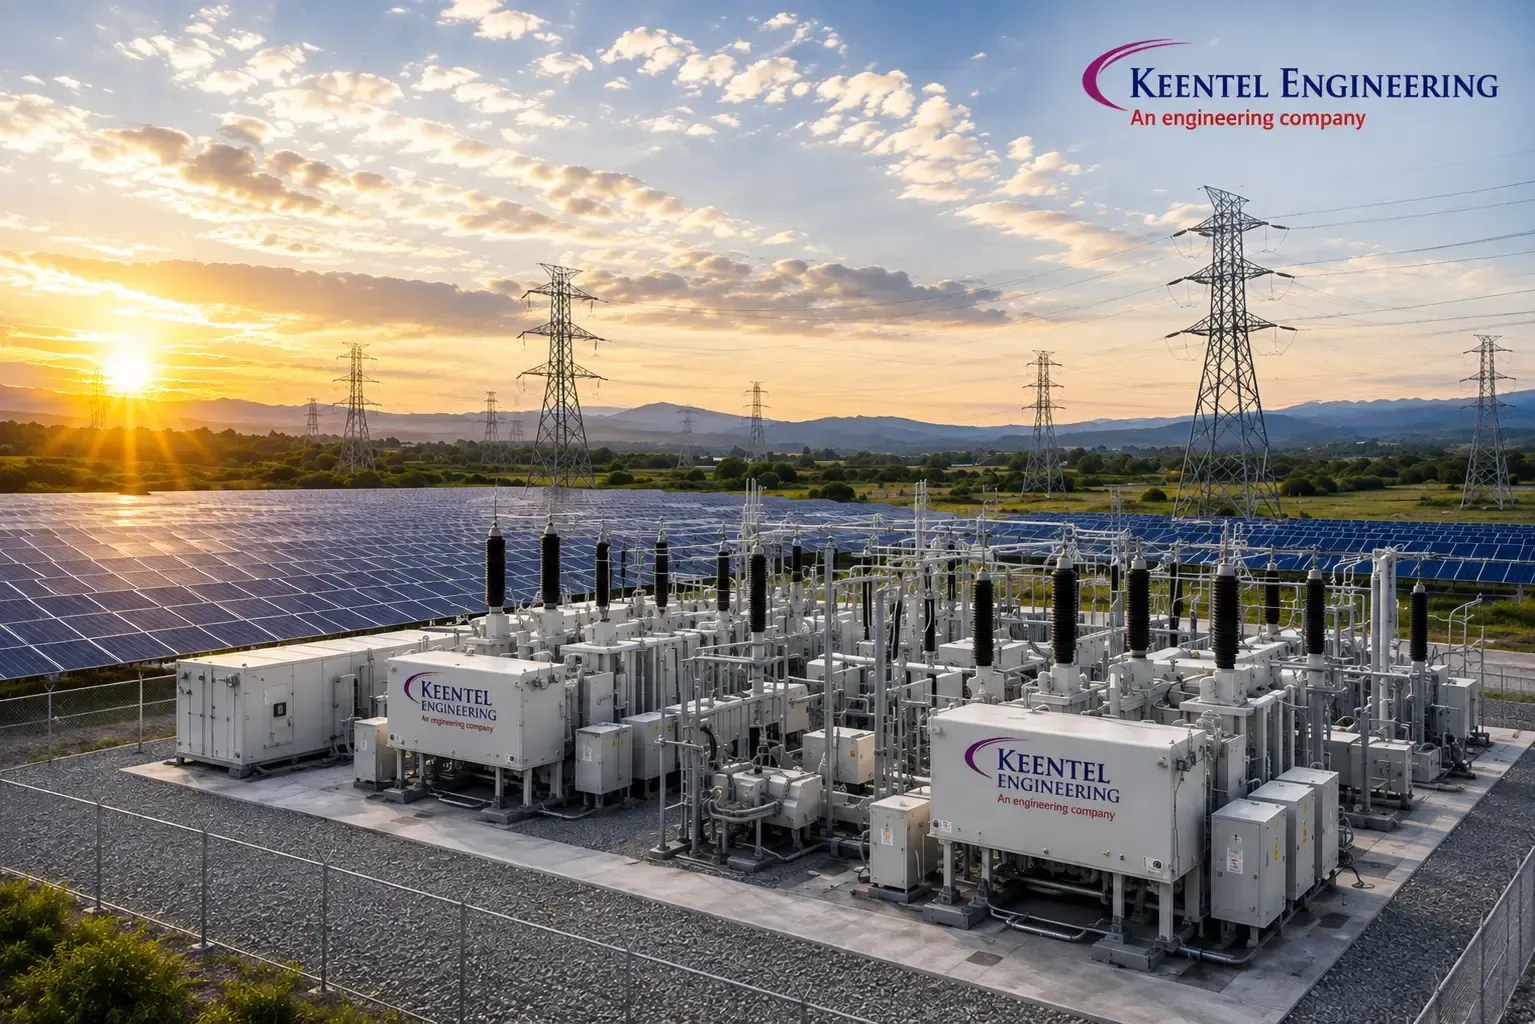
The Client, an independent power producer developing utility-scale renewable generation, required the electrical infrastructure to connect a single-axis-tracking photovoltaic plant of 450 MWac and 620 MWdc to the interconnecting bulk power system at 345 kV. The plant occupies roughly 1,000 hectares and delivers its output through a dedicated generation tie line to a remote switching station owned by the Transmission Provider. Keentel Engineering Solutions was engaged as owner's engineer and design authority for the collector and generator step-up substation, the 34.5 kV collector network, and the full study package supporting interconnection approval.
What distinguishes this commission is that the substation was the smaller half of the problem. A 450 MW solar plant carries approximately 190 kilometres of buried medium-voltage cable, 120 distributed inverter transformers and twenty collector feeders spread across ten square kilometres. That network determines the plant's losses, its reactive capability at the point of interconnection, its harmonic impedance, its ground-fault behaviour and much of its capital cost. Keentel's core contribution was re-engineering that collector system, taken over from a feasibility-stage layout sized on uniform conductor and rule-of-thumb feeder loading.
Figures presented are representative of the delivered design and have been generalized to protect client confidentiality.
Re-optimization of collector topology, feeder count and conductor tapering reduced modelled collector losses from 2.90 percent to 1.80 percent of annual generated energy — approximately 12,800 MWh per year — while reducing installed collector cable cost by about 8 percent. Electromagnetic transient study of the temporary overvoltage regime showed that the originally proposed generator step-up winding configuration would have produced a load-rejection overvoltage of 1.82 per unit and an arrester energy duty 27 percent above the class capability of the specified arresters; the configuration was changed before procurement. The plant achieved first-pass acceptance of its interconnection study package, and commissioned collector performance matched the model within 0.09 percentage points.
Project at a Glance
| Attribute | Detail |
|---|---|
| Asset type | Solar PV collector and generator step-up substation |
| Plant rating | 450 MWac / 620 MWdc, single-axis tracking, DC:AC 1.38 |
| Voltage levels | 345 kV transmission / 34.5 kV collector |
| Transformation | 1 x 300/400/500 MVA ONAN/ONAF/ODAF, 345/34.5–34.5 kV, YNd1d1 |
| Bus schemes | 345 kV breaker-and-a-half (one diameter); 34.5 kV double lineup, normally split |
| Collector network | 20 feeders, approx. 190 km of 35 kV cable, 120 inverter transformers |
| Headline outcome | Collector losses 2.90 to 1.80 percent; TOV-driven arrester failure risk eliminated |
2. Project Context and Business Drivers
The Client acquired the project at late-stage development with an executed interconnection agreement, a fixed commercial operation deadline, and a feasibility-grade electrical design prepared to support permitting rather than construction. The commercial model depended on two things that design had not seriously addressed: net energy after electrical losses, and the ability to satisfy the reactive and performance obligations of the interconnection agreement without post-energization retrofit.
The feasibility layout used sixteen collector feeders of uniform 1000 kcmil aluminium conductor, with paralleled trunk runs wherever a single circuit was thermally inadequate. This is a common and superficially conservative approach. It is also expensive and, counter-intuitively, lossy: uniform sizing places heavy conductor in laterals carrying a fraction of rated current while forcing paralleled runs on trunks, multiplying trenching quantity and worsening mutual heating between circuits sharing a trench. The financial model carried a flat 2.5 percent collector loss assumption with no time-series basis, which the lenders' technical advisor had flagged.
Three constraints framed the engineering. The interconnection agreement fixed a reactive obligation of 0.95 power factor leading and lagging at the point of interconnection — not at the inverter terminals, where the original specification had placed it. The generator step-up transformer had a 62-week lead time, requiring its specification to be frozen in Month 4, well before electromagnetic transient studies would normally close. And native soil measured a thermal resistivity of 90 °C·cm/W dry, poor enough that cable ampacity rather than conductor economics would govern parts of the design.
The engagement therefore had an unusual shape: rather than beginning with the substation and treating the collector as a downstream detail, Keentel began with an 8,760-hour model of the collector network and worked outward to the point of interconnection.
3. Design Basis and Technical Requirements
The design basis was issued in Month 2 as a controlled document referenced by every subsequent study, specification and drawing.
Site and Environmental Design Criteria
| Parameter | Design value |
|---|---|
| Maximum ambient air temperature | 42 °C (35 °C maximum daily average) |
| Minimum ambient air temperature | -22 °C |
| Soil temperature at cable depth | 25 °C design, 30 °C summer maximum |
| Native soil thermal resistivity | 90 °C·cm/W dry; 60 °C·cm/W at design moisture content |
| Soil electrical resistivity | 85 Ω·m upper layer to 3.2 m; 240 Ω·m lower layer |
| Design wind speed (3 s gust) | 47 m/s |
| Seismic design acceleration | 0.12 g horizontal |
| Pollution severity | Light to medium per IEC 60815, agricultural dust |
| Isokeraunic level | 34 thunderstorm days per year |
The thermal resistivity result was the most consequential site datum. Thermal property testing was carried out at eighteen locations at cable depth in both as-found and dried states, with the dry value adopted for any circuit not surrounded by engineered backfill. A native resistivity of 90 °C·cm/W is roughly 20 percent poorer than the 75 °C·cm/W commonly assumed in feasibility work, and the optimistic figure would have overstated feeder ampacity by 6 to 9 percent across the network.
Standards Register
| Standard | Application |
|---|---|
| IEEE Std 2800 | Interconnection and interoperability of inverter-based resources |
| IEEE Std 519 | Harmonic control in electric power systems |
| IEC 60287 series | Calculation of the continuous current rating of cables |
| IEEE Std 835 | Power cable ampacity tables (Neher-McGrath basis) |
| ICEA S-94-649 / AEIC CS8 | 5–46 kV shielded power cable, construction and testing |
| IEEE Std 400.2 | Field testing of shielded power cable using very low frequency |
| IEEE Std 80 | Safety in AC substation grounding |
| IEEE Std C57.12.00 / C57.12.34 | Power transformers; pad-mounted compartmental transformers |
| IEEE Std C57.110 | Transformer capability with non-sinusoidal load current |
| IEEE Std C62.11 / C62.22 | Metal-oxide surge arresters; application guide |
| IEEE Std C37.20.2 | Metal-clad switchgear |
| IEEE Std C37.91 / C37.230 | Transformer protection; distribution line protection |
| IEEE Std C57.13 | Instrument transformers, accuracy classes |
| IEEE Std 1584 | Arc-flash hazard calculation |
| NERC PRC-024, PRC-019, MOD-026/027 | Ride-through settings, voltage control coordination, model validation |
| IEC 60071-1 / -2 | Insulation coordination |
The Owner's functional requirements added: reactive capability of 0.95 leading and lagging at the point of interconnection across 10 to 100 percent of rated active power; plant-level control with a settling time under 5 seconds; collector loss guaranteed within 0.25 percentage points of the modelled value; provision for a second generator step-up bay and a future battery storage addition without a station outage; and a protection scheme maintainable by a small operations team.
4. Substation Configuration and Single-Line Architecture
4.1 345 kV bus scheme selection
The 345 kV switchyard is a single breaker-and-a-half diameter of three circuit breakers, with the generation tie line in one position and the generator step-up transformer in the other, and space for a second diameter.
| Criterion | Two-breaker inline | Ring bus | Breaker-and-a-half |
|---|---|---|---|
| Breakers for two elements | 2 | 2 (degenerate ring) | 3 |
| Relative switchyard cost | Baseline | +4 percent | +26 percent |
| Breaker maintenance without plant outage | No | No | Yes |
| Bus fault consequence | Total plant outage | Total plant outage | One element only |
| Expansion to four elements | Requires rebuild | Ring extension, staged outages | Add one diameter, no outage |
For a plant with a single generation tie and a single step-up transformer a ring bus is degenerate: with two elements it collapses to two breakers in series and offers none of the redundancy that makes ring buses attractive at four or six elements. Breaker-and-a-half was selected because it permits maintenance of any breaker at full output — a solar plant's maintenance windows and its production hours are the same daylight hours — because it aligns with the Transmission Provider's standard, and because the Owner's pipeline includes a co-located storage addition for which adding a diameter is a bay extension whereas extending a ring bus requires the ring to be opened. The third breaker was recovered, on the Owner's own availability assumptions, within two maintenance cycles.
4.2 Generator step-up transformer and the single-unit decision
The plant is served by one 300/400/500 MVA ONAN/ONAF/ODAF unit, 345/34.5–34.5 kV, connected YNd1d1 with two independent 250 MVA secondaries, each feeding a separate 34.5 kV lineup. Impedance is 11.5 percent on a 300 MVA base between the high-voltage winding and each secondary, and 22 percent between the secondaries.
Two 250 MVA units were evaluated. They halve the consequence of a failure but require a second 345 kV position with its own bushings, arresters, foundations, firewalls and containment, and they roughly double the no-load loss carried for every one of 8,760 hours by a resource generating in about 2,500 equivalent full-load hours. The single-unit configuration was selected on an availability calculation: at a failure rate of 0.7 percent per unit-year, expected annual energy at risk with a single unit and no spare was approximately 0.62 percent of production, dominated by the 12-to-16-month replacement lead time rather than the failure probability.
That shows the spare strategy, not the unit count, to be the correct lever. The Owner holds one spare unit across a multi-plant portfolio, stored under nitrogen with a pre-engineered transport and installation package, reducing expected replacement from 14 months to about 16 weeks and expected energy at risk to 0.11 percent. A mobile transformer solution, sound at distribution and sub-transmission voltages, does not exist at 345 kV and 500 MVA; any proposal assuming one is a schedule risk rather than a mitigation.
No tertiary winding was provided: with a grounded-wye high-voltage winding the delta secondaries already provide the zero-sequence circulating path, so a tertiary would add cost, fault-duty exposure and unloaded bushings for no function. One would have been necessary only under the rejected YNyn0 alternative of Section 5.9.
4.3 34.5 kV collector architecture
Each secondary feeds a 38 kV metal-clad switchgear lineup rated 40 kA for 3 seconds, with ten feeder breakers, a main breaker, a grounding-bank and station-service position, and a normally open bus tie. The buses are operated split. Splitting halves the fault duty seen by a fault on either bus, halves the number of inverter transformers energized by any single close operation, and confines a bus fault to half the plant. The tie is closed only to permit maintenance of one secondary winding at reduced output.
5. System Studies and Analysis
5.1 Modelling basis and software
PSS®E carried positive-sequence steady-state and dynamic work: power flow, contingency screening, reactive capability at the point of interconnection, and transient stability against the Transmission Provider's regional case. PSCAD/EMTDC carried all electromagnetic transient work — temporary overvoltage, transformer energization, harmonic impedance scanning and control interaction — using the inverter supplier's validated black-box model. DIgSILENT PowerFactory carried protection coordination and unbalanced fault analysis on the resistance-grounded collector. ETAP carried AC and DC auxiliaries, cable sizing and arc flash. The collector was modelled at full detail for loss and protection work and as a frequency-matched reduced equivalent in EMT, the reduction validated by comparing driving-point impedance at the 34.5 kV bus from 50 Hz to 2.5 kHz, where it tracked within 4 percent in magnitude and 3 degrees in phase.
5.2 Collector topology and feeder count
| Criterion | Radial | Open loop (normally open tie) | Closed loop |
|---|---|---|---|
| Cable quantity relative to radial | Baseline | +14 to 19 percent | +14 to 19 percent |
| Energy unserved per feeder cable fault | Full feeder until repair | Partial, restorable by switching | None |
| Protection complexity | Non-directional overcurrent | Directional, sectionalizing logic | Differential or pilot required |
| Annual energy benefit, modelled | Baseline | +0.04 percent | +0.06 percent |
| Selected | Yes | Reserved on two feeders | No |
Solar collectors are almost universally radial, but the choice deserves an answer rather than an assumption. The economics turn on what a feeder outage actually costs: a feeder carries about 5 percent of plant output, buried cable faults occur at roughly 0.03 to 0.06 per kilometre-year, and repair takes two to five days. Expected unserved energy is well under 0.1 percent of annual production — less than the loss penalty of the extra cable a loop requires. Radial was adopted for eighteen feeders; two whose route crosses a drainage feature difficult to excavate when wet were given a normally open tie for back-feed.
Feeder count is likewise a genuine optimum: too few gives long, heavily loaded trunks and paralleled circuits, too many gives switchgear and terminations for diminishing loss returns. Counts of 14 through 24 were costed on a common routing model against cable, trenching, switchgear, protection and thirty years of loss energy.
| Feeders | Cable and trench PV | Switchgear and protection PV | Loss energy PV | Total PV |
|---|---|---|---|---|
| 14 | +6.1 percent | -4.2 percent | +11.8 percent | +5.9 percent |
| 16 | +3.4 percent | -2.8 percent | +5.1 percent | +2.7 percent |
| 20 | Baseline | Baseline | Baseline | Baseline |
| 22 | -0.9 percent | +2.6 percent | -1.1 percent | +0.4 percent |
| 24 | -1.4 percent | +5.3 percent | -1.8 percent | +1.6 percent |
The curve is shallow between 18 and 22 feeders, which is useful: the count can be shifted to suit block geometry without material penalty. Twenty feeders were adopted, ten per bus, with a design maximum feeder loading of 23.0 MW, or 385 A at the substation termination.
5.3 Conductor tapering and the economic-loading method
Uniform conductor sizing along a feeder is the largest avoidable inefficiency in collector design. Current falls in steps as each block taps off, so the last segment may carry a tenth of the trunk current, and sizing every segment for the trunk buys aluminium that never carries current.
The correct treatment is the economic-loading method, the modern form of Kelvin's law: upsize a segment when
3 × I²eq × (R1 − R2) × Hl × Ce × PVF > ΔCinst
where I²eq is the loss-equivalent current, R the AC resistance at operating temperature, Hl the annual loss-equivalent hours, Ce the value of energy, PVF the present value factor, and ΔCinst the incremental installed cost per unit length. Loss-equivalent hours were taken from the 8,760-hour production series rather than a load-factor formula, giving 1,870 hours. At 34.50 per MWh and a present value factor of 12.41 over thirty years, one kilowatt of loss at rated conditions carries a present value of approximately 800. That number drives every sizing decision on the network.
| Transition | AC resistance at 90 °C | Economic break-even current | Thermal limit of smaller size | Governing criterion |
|---|---|---|---|---|
| 4/0 AWG to 500 kcmil | 0.905 to 0.294 Ω/km | 114 A | 165 A | Economic |
| 500 to 750 kcmil | 0.294 to 0.204 Ω/km | 272 A | 285 A | Economic (marginal) |
| 750 to 1000 kcmil | 0.204 to 0.166 Ω/km | 480 A | 355 A | Thermal |
The pattern generalizes. At the low-current end the economic threshold sits well below the thermal rating, so loss economics govern and the thermally adequate conductor is the wrong answer. At the high end the economic threshold rises above the smaller conductor's thermal rating, so 1000 kcmil is used only where 750 kcmil is thermally inadequate. The feasibility design's uniform 1000 kcmil was therefore over-invested in every lateral while, because it forced paralleled trunk runs, no better at the trunk.
The DC:AC ratio moves the thresholds. Clipping at 1.38 rather than 1.20 raises loss-equivalent hours from 1,530 to 1,870 and the present value of a kilowatt of loss from about 655 to 800; break-even currents scale with the inverse square root of that value, so the 500-to-750 transition moves from 301 A down to 272 A. The empirical loss-factor formulas of distribution practice also understate the loss factor for a clipped solar profile badly — 1,270 hours predicted against 1,870 actual, a 32 percent error that propagates straight into undersized conductor.
5.4 Thermal environment, ampacity and installation quality
Ampacity was calculated to IEC 60287 and cross-checked against IEEE Std 835 and the underlying Neher-McGrath method, agreeing within 3 percent once assumptions were harmonized. The network is direct-buried at 1,067 mm cover, with duct bank only at road crossings, the substation entrance and where more than four circuits converge.
| Conductor | Single circuit, native soil ρ=90 | Three circuits in shared trench | Applied design rating |
|---|---|---|---|
| 1000 kcmil AL | 505 A | 419 A | 415 A |
| 750 kcmil AL | 435 A | 361 A | 355 A |
| 500 kcmil AL | 350 A | 291 A | 285 A |
| 4/0 AWG AL | 205 A | 170 A | 165 A |
Shared-trench derating is the figure most often mishandled. Three circuits at 600 mm lateral spacing lose 17 percent of ampacity to mutual heating; at 300 mm the loss reaches 26 percent. Routes converging on the substation accumulate circuits, so the highest-current segments sit in the worst thermal environment. A route-by-route trench occupancy schedule was mandated, and fluidized thermal backfill with verified dry resistivity not exceeding 75 °C·cm/W specified for every trench carrying three or more circuits and for the substation entrance corridor, where seven circuits converge. Backfill was deliberately not specified network-wide: at two or fewer circuits native soil supports the required rating and the backfill cost exceeds the ampacity recovered. Duct bank was restricted because it is thermally worse than direct burial — the cable-to-duct air gap and the concrete envelope both add thermal resistance, costing 11 to 14 percent of ampacity.
Installation quality was treated as an engineering deliverable. Early-life collector failures are overwhelmingly workmanship failures, clustered in a few mechanisms: pulling tension and sidewall bearing pressure exceeded on long pulls through bends; bending radius violations; semiconducting shield trimming defects at splices and terminations; moisture ingress at splices made in open trench; and rock in the bedding layer causing jacket damage that surfaces as a shield fault years later. Keentel specified calculated pulling tension recorded on every pull, a 12 times outside-diameter minimum bending radius, splice qualification for every crew member, and full very-low-frequency withstand testing with partial discharge monitoring per IEEE Std 400.2. Direct-current withstand testing was prohibited on extruded dielectric cable, as it can initiate space-charge damage in service-aged XLPE.
5.5 Loss study and energy yield interaction
The loss model is an hourly calculation over the production time series, not a full-load figure scaled by a load factor: every segment carries the current profile of the blocks downstream of it, and no-load loss applies for all 8,760 hours.
| Loss component | Feasibility design | Optimized design |
|---|---|---|
| Collector cable I²R | 2.05 | 1.00 |
| Inverter transformer no-load loss | 0.29 | 0.24 |
| Inverter transformer load loss | 0.51 | 0.51 |
| MV switchgear, auxiliaries, parasitic | 0.05 | 0.05 |
| Collector system total | 2.90 | 1.80 |
Two line items moved. Cable loss halved through feeder count, tapering and route rationalization. No-load loss fell because the inverter transformers were procured against a capitalized loss evaluation — approximately 6.10 per watt of no-load loss and 1.55 per watt of load loss at rated — rather than a first-cost comparison, which changed the winning design without changing the winning price.
At 1,162,000 MWh generated annually at the inverter terminals, 1.10 percentage points is approximately 12,800 MWh per year. Step-up transformer loss of 0.28 percent and generation tie loss of 0.21 percent are accounted separately, giving about 1,135,000 MWh delivered at the point of interconnection in year one, a net capacity factor of 28.8 percent. Replacing the flat 2.5 percent assumption with an hourly model also tightened the loss uncertainty band from about ±0.6 percentage points to ±0.15, narrowing the P50-to-P90 spread of the financing case — worth a comparable amount, in financing terms, to the loss reduction itself.
5.6 Cable charging and reactive power balance
A network of 190 km of 35 kV cable is a substantial capacitor: 29.5 MVAr of charging at nominal voltage, or 494 A per phase. It helps in one direction and hurts in the other, and it dominates plant reactive behaviour at both ends of the operating range.
| Condition | Requirement | Contribution | Result |
|---|---|---|---|
| Full output, maximum lagging | +148 MVAr at POI | Inverters +218, collector charging +29.5 | Shortfall 19 MVAr at 450 MW |
| Full output, maximum leading | -148 MVAr at POI | Charging opposes absorption | Met with 21 MVAr margin |
| Night, zero output | Net export ≤ 5 MVAr | Charging +29.5, GSU absorbs -3 | Requires inverter night mode |
| GSU reactive absorption at rated | Not applicable | -86 MVAr at 474 MVA throughput | Dominant single term |
The lagging corner was binding, and it exposed an inherited specification error. The agreement requires 0.95 power factor at the point of interconnection; the inverter specification had been written for 0.95 at the inverter terminals. Between those points the reactive path loses 86 MVAr in the step-up transformer, 24 MVAr across 120 inverter transformers and 8 MVAr in collector reactance, against a gain of 29.5 MVAr of charging, so inverters at 0.95 at their own terminals deliver about 0.975 at the point of interconnection.
Three remedies were evaluated. Raising step-up impedance was rejected — the opposite pressure exists, below. A 34.5 kV shunt capacitor bank was rejected because adding 24 MVAr to a network already holding 29.5 MVAr of charging would pull the collector parallel resonance from the seventh harmonic region towards the fifth, where inverter emission is strongest. Selected was an uprated inverter specification of 0.90 power factor at rated active power, giving 218 MVAr, with a plant-controller reactive-priority mode permitted to trim active power by up to 1.5 percent when the target cannot otherwise be met. At 443 MW the fleet delivers 232 MVAr against a 231 MVAr requirement, and the priority mode engages in under 0.3 percent of production hours — an annual energy cost of about 0.02 percent.
The night condition is equally important and frequently missed. At zero output the charging exports about 26.5 MVAr net, raising point-of-interconnection voltage and breaching the overnight reactive schedule, so inverters were specified for reactive operation at zero active power with station service sized accordingly.
The impedance decision closes the loop with the fault study. Raising step-up impedance from 11.5 to 18 percent on the 300 MVA base would have cut 34.5 kV fault duty from 36.3 kA to about 24 kA and allowed standard 25 kA switchgear, but would have raised reactive absorption at rated throughput from 86 to 135 MVAr — a 49 MVAr penalty no realistic inverter specification could cover. The impedance was held and 40 kA switchgear specified instead. This trade-off is invisible when fault and reactive studies run on separate desks.
5.7 Harmonic impedance scan and resonance
A frequency scan at the 34.5 kV bus using frequency-dependent cable models found a parallel resonance at 412 Hz — harmonic order 6.87 — with a driving-point impedance of 118 Ω against 4.6 Ω at fundamental frequency, an amplification factor of 25.6. It arises from collector cable capacitance in parallel with the step-up transformer inductance and the source behind it. A lumped estimate from short-circuit MVA and capacitive MVAr gives order 7.5; the distributed model gives 6.87, and the difference matters because it sits closer to the seventh harmonic.
The resonance cannot be designed away: its frequency is set by cable length, transformer impedance and source strength, all fixed by other requirements. Three measures were used instead — inverter emission limits written at the individual-order level with the seventh capped at 0.4 percent of rated current, split bus operation to raise the resonant frequency seen from each secondary, and a reserved 34.5 kV bay, foundation and control provision for a 15 MVAr C-type damped filter to be installed only if measurement required it. It did not.
Selection of the applicable current distortion row required care. The point of interconnection is above 161 kV, so the limits are those of the highest-voltage table rather than the distribution rows frequently quoted in developer submissions. On the short-circuit to maximum demand current ratio of 26.3 alone, the row for ratios between 25 and 50 would give 2.5 percent total demand distortion. IEEE Std 519 additionally provides that generation equipment connected above 161 kV is held to the most onerous row regardless of the actual ratio, which for a dedicated generation interconnection of this kind gives 1.5 percent total demand distortion with individual current limits of 1.0 percent below the eleventh harmonic, 0.5 percent from the eleventh to below the seventeenth, 0.38 percent from the seventeenth to below the twenty-third, 0.15 percent from the twenty-third to below the thirty-fifth and 0.1 percent at and above the thirty-fifth. Because the plant is a generating facility on a dedicated tie, the 1.5 percent basis was adopted and written into the inverter emission specification; the 2.5 percent ratio-based row was recorded in the compliance register as the less onerous alternative and was not relied upon.
| Quantity | Limit | Modelled | Commissioning measurement |
|---|---|---|---|
| Individual voltage distortion | 1.0 percent | 0.87 percent (7th) | 0.79 percent (7th) |
| Total voltage harmonic distortion | 1.5 percent | 1.21 percent | 1.14 percent |
| Individual current, worst order | 1.0 percent of IL | 0.6 percent (5th) | 0.5 percent (5th) |
| Total demand distortion | 1.5 percent | 0.9 percent | 0.8 percent |
A practical finding emerged during staged commissioning. Resonant frequency depends on how much cable is energized, so the parallel peak swept down from order 13 with four feeders in service, through order 11 at eight feeders, to 6.87 at full network — each intermediate state sitting on an order that inverters actually produce. A commissioning-stage harmonic assessment was therefore added, with distortion measured at each energization state rather than only at completion, and two intermediate configurations defined to be passed through quickly rather than held.
5.8 Control interaction and weak-grid screening
The short-circuit ratio at the point of interconnection is 26.3, comfortable in isolation. The weighted short-circuit ratio, accounting for two other inverter-based plants electrically close to the same corridor, is 3.9 — a genuinely weak condition that screening on the point-of-interconnection value alone would have missed entirely.
EMT simulation with the supplier's black-box model was run across a matrix of grid strength, dispatch and control mode. The impedance-based assessment compared inverter output admittance against network impedance from 5 to 200 Hz; minimum phase margin was 38 degrees at 42 Hz against a 30-degree criterion, achieved after the inverter outer voltage-control loop bandwidth was reduced from 12 Hz to 7 Hz and the plant controller reactive integral gain retuned. Sub-synchronous control interaction screening against series-compensated segments showed positive damping under all studied contingencies. Reactive step response settles within 2 percent of setpoint in 3.4 seconds with overshoot below 6 percent, and ride-through and primary frequency response conform to IEEE Std 2800 and NERC PRC-024. Model validation to NERC MOD-026 and MOD-027 was performed against commissioning disturbance records.
5.9 Temporary overvoltage: ground fault and load rejection
This study changed the design, and it is why the step-up specification could not simply be frozen on a standard configuration in Month 4. Two mechanisms dominate for inverter-based plants. Ground-fault overvoltage occurs when a high-voltage line-to-ground fault is isolated from the system source while the plant remains connected; with no zero-sequence ground source the unfaulted phases rise towards phase-to-phase voltage. Load-rejection overvoltage occurs when the plant is disconnected at full output and the inverters continue injecting into a network whose only remaining elements are cable and line charging and the transformer magnetizing branch.
| Case | GSU configuration | Peak TOV | Duration above 1.1 pu | Arrester energy |
|---|---|---|---|---|
| Ground fault, source isolated | YNd1 (selected) | 1.28 pu | 0.14 s | 1.9 kJ/kV |
| Ground fault, source isolated | Dyn1 (rejected) | 1.82 pu | 0.51 s | 11.4 kJ/kV |
| Full load rejection at 450 MW | YNd1 (selected) | 1.42 pu | 0.18 s | 3.6 kJ/kV |
| Full load rejection at 450 MW | Dyn1 (rejected) | 1.79 pu | 0.44 s | 9.8 kJ/kV |
The specified 276 kV rated, 220 kV MCOV station-class arresters have a thermal energy capability of 9.0 kJ per kV of rating. The originally proposed delta high-voltage winding produced 11.4 kJ/kV, 27 percent above capability, in a scenario that is not exotic — a single-line-to-ground fault with delayed or single-pole clearing on a radial generation tie. The likely consequence would have been arrester thermal runaway, potentially cascading into bushing and cable termination damage, at the first significant fault.
The high-voltage winding was therefore specified as grounded wye with delta secondaries, making the plant an effective ground source with X0/X1 of 2.4 and R0/X1 of 0.21. This raises the plant's contribution to transmission ground faults, and it was verified that the infeed does not compromise ground distance reach on adjacent lines. The YNyn0 alternative with a buried delta tertiary would have produced an effectively grounded collector, permitting 100 percent insulation cable at roughly 4 percent cable saving, but it produces collector ground-fault current above 14 kA — severe shield duty, high ground potential rise at every pad, and burn damage before clearing. For a plant whose ground faults occur in buried cable spread over ten square kilometres, resistance grounding is the better answer.
5.10 Transformer energization, sympathetic inrush and cold-load pickup
Energizing the step-up transformer from 345 kV gave a modelled first peak of 3,310 A against 837 A rated, decaying with a 1.2 s time constant, and a 1.7 percent voltage step at the point of interconnection — within the 3 percent limit, so controlled point-on-wave switching was evaluated and not adopted. Sympathetic inrush with the two transformers at the remote switching station extended the decay to about 3.5 s without misoperation once differential second-harmonic restraint was confirmed adequate.
The distributed transformers are the more interesting problem. One feeder close energizes six 4.0 MVA pad-mounted units simultaneously. Individual first-peak inrush is about eight times rated current, 536 A at 34.5 kV; six units with random point-on-wave and partial cancellation give a modelled aggregate first peak of 2,150 A, 5.6 times feeder rating, damped below pickup within 0.4 s, which constrains the feeder instantaneous setting directly. Energizing a whole bus of ten feeders at once gives a modelled 17.8 kA — enough to trip a main breaker set for fault protection. Restoration therefore staggers feeder closing at 3-second intervals under controller supervision, energizes trackers and block auxiliaries only after the collector is stable, and holds inverters blocked until voltage and frequency are verified. Cold-load pickup adds tracker motor starting and inverter precharge; the sequence separates the three so that none coincide.
5.11 Short-circuit study
| Location | Three-phase symmetrical | Single line-to-ground | Equipment rating |
|---|---|---|---|
| 345 kV point of interconnection | 19.8 kA | 18.4 kA | 40 kA breakers |
| 345 kV substation bus | 18.9 kA | 17.6 kA | 40 kA breakers |
| 34.5 kV collector bus (tie open) | 36.3 kA | 0.8 kA limited | 40 kA / 3 s switchgear |
| 34.5 kV collector bus (tie closed) | 38.1 kA | 1.1 kA limited | 40 kA / 3 s switchgear |
| Inverter transformer 34.5 kV terminals | 9.4 to 24.6 kA | 0.8 kA limited | 100E fuse, 50 kA interrupting |
Collector bus duty of 36.3 kA comprises 32.2 kA from the transmission system through the step-up transformer and 4.1 kA of inverter contribution, the latter limited by inverter current-limiting behaviour to about 1.1 times rated. Duty at 91 percent of the switchgear rating is closer to the limit than is comfortable and was accepted only after confirming that planned network reinforcements do not raise point-of-interconnection duty beyond 21 kA, at which the collector bus reaches 37.6 kA. The bus tie is interlocked against closure onto a fault.
5.12 Grounding, arc flash and compliance
Grounding was treated as two connected problems: the substation grid to IEEE Std 80, and plant-wide array grounding, which no single standard addresses completely.
| Parameter | Value |
|---|---|
| Substation grid area | 118 m x 94 m, 6.5 m mesh, 4/0 bare copper, 34 rods at 3 m |
| Grid resistance | 0.24 Ω |
| Fault current into grid after split factor 0.31 | 5.70 kA |
| Ground potential rise | 1,368 V |
| Calculated mesh (touch) voltage / limit | 742 V / 1,125 V |
| Calculated step voltage / limit | 486 V / 3,705 V |
Limits assume a 70 kg body criterion, 0.35 s clearing and 100 mm of 3,000 Ω·m surface rock giving a derating factor of 0.72. Ground potential rise exceeds the touch limit, so the grid was designed on mesh and step voltage, and transferred-potential paths addressed explicitly: substation-to-array communications are optical fibre with no metallic element, remote station service is transformer-isolated, and fence grounding is bonded and offset from the grid perimeter.
Array grounding is different in kind. A collector ground fault limited to 800 A into a 15 Ω local electrode at a pad-mounted transformer produces 12,000 V of local rise — a hazard at an accessible enclosure and a transferred potential onto every bonded tracker row and DC combiner. The resolution is a continuous bonded path rather than local electrodes: bare 4/0 copper counterpoise in every cable trench, bonded to every pad, to tracker pile foundations at defined intervals, and back to the substation grid. Modelled equivalent return impedance is 0.09 Ω and worst-case local rise falls from about 5,600 V to 340 V. Tracker rows are bonded with dedicated jumpers of specified cross-section rather than relying on galvanized pile-to-torque-tube structural joints, which may not remain electrically continuous after years of thermal cycling and tracker motion. Soil resistivity across ten square kilometres varies far more than at a substation site, so 22 measurement locations were used and the array model built on a two-layer fit per zone.
Arc-flash calculation to IEEE Std 1584 gave 6.8 cal/cm² at the 34.5 kV switchgear at 910 mm working distance with the arc-flash reduction maintenance setting enabled and 21.4 cal/cm² without it, making the maintenance setting a procedural requirement rather than an option. Inverter LV compartments, where fault current is inverter-limited, were assessed separately with conservative assumptions because the standard's models do not apply directly to current-limited sources. Compliance against IEEE Std 2800 was documented as a clause-by-clause register covering reactive capability, ride-through, momentary cessation, primary frequency response, power quality and model quality, closed in full before the interconnection submission.
6. Protection, Automation and Control Philosophy
Protection of an inverter-based plant differs from conventional practice in one governing respect: the sources do not behave like synchronous machines. Fault contribution is limited to about 1.1 times rated current, it is controlled rather than driven by machine reactance, negative-sequence injection may be deliberately suppressed, and the contribution can be withdrawn within a cycle or two. Schemes relying on a strong, sustained, symmetric contribution do not work.
Protection Function Schedule
| Zone | Main 1 functions | Main 2 / backup functions |
|---|---|---|
| 345 kV gen-tie line | 87L line differential, 21/21N, 25 | 21/21N step distance, 50/51, 67N, 79 disabled |
| GSU transformer | 87T with 2nd/5th harmonic restraint, 63, 49 | 87REF both secondaries, 51, 51N, 50BF |
| 34.5 kV bus | 87B low-impedance bus differential | 51 main with zone interlock, 50BF |
| Collector feeder | 50/51, 51N, 67N, 46, 27/59 | 51 at main as remote backup, 50BF |
| Grounding bank / NGR | 51G on neutral CT, 50G, thermal model | Bank overcurrent, NGR continuity monitor |
Collector feeder protection was the difficult part. For a fault on a feeder the contribution from the transmission system through the step-up transformer is large and easily detected. The difficulty is the reverse case: for a fault on an adjacent feeder a healthy feeder's inverters contribute through the bus, and if that contribution exceeds the healthy feeder's pickup the wrong breaker can trip. Directional overcurrent was therefore applied on all feeders with the forward direction defined towards the feeder, using memory-polarized voltage to survive the voltage collapse a close-in fault produces.
Ground-fault detection drove the grounding decision and produced the study finding with the widest applicability. Each bus is grounded through a zigzag grounding transformer and a neutral grounding resistor; the feasibility design specified 400 A. Keentel computed the network's capacitive ground-fault current at 1,480 A total, or 740 A per bus with the tie open — the unavoidable consequence of 190 km of shielded cable. A 400 A resistor is smaller than the capacitance it is meant to damp, leaving the system behaving closer to an ungrounded network than a resistance-grounded one: EMT simulation of a restriking arcing ground fault under the 400 A design produced recurring overvoltages reaching 4.1 per unit, a condition that damages insulation progressively rather than obviously.
The resistor was resized to 800 A per bus, so the resistive component exceeds the capacitive by a factor of 1.08. Modelled arcing-fault overvoltage falls to 2.3 per unit and every feeder sees an unambiguous residual current for a ground fault on it. The resistor is rated 800 A for 10 seconds and its continuity is monitored, because an open grounding resistor converts the system silently back to ungrounded operation.
Feeder residual settings must clear the feeder's own charging contribution, which appears as residual current during a ground fault elsewhere. Each feeder contributes about 74 A, so 51N elements are set at 120 A with a 0.35 s definite time delay and directional supervision, detecting faults up to about 130 Ω of fault resistance. High-impedance faults may not produce even that, so three complementary measures were applied: negative-sequence overcurrent with a sensitive long-time setting, continuous monitoring of grounding resistor current with an alarm well below trip, and periodic partial discharge monitoring at feeder terminations — presented to operations as a diagnostic rather than a protective function.
Pad-mounted transformers are protected by 100E current-limiting fuses coordinated below the feeder 51 curve and above the 2,150 A energization inrush envelope, verified explicitly at the reduced fault levels applying at the far end of the longest feeder. Automation follows an IEC 61850 architecture with GOOSE for interlocking and breaker failure initiation and a redundant PRP station bus. Revenue metering is at the 345 kV line bay with duplicate 0.2S meters on 0.15S metering cores, requiring no loss compensation. The plant controller command authority is limited by hard interlocks so that no controller fault can defeat a protective function.
7. Primary Plant, Insulation Coordination and Physical Design
Equipment Rating Schedule
| Equipment | Rating |
|---|---|
| 345 kV circuit breakers | 362 kV, 3,000 A, 40 kA, 2-cycle, independent pole operation |
| 345 kV disconnectors | 362 kV, 3,000 A, 100 kA peak withstand |
| GSU transformer | 300/400/500 MVA ONAN/ONAF/ODAF, 345/34.5–34.5 kV, YNd1d1, 11.5 percent |
| 34.5 kV switchgear | 38 kV metal-clad, 3,000 A bus, 40 kA / 3 s, arc-resistant type 2B |
| Inverter transformers | 120 x 4.0 MVA ONAN, 34.5 kV delta / 630-630 V wye, 6.0 percent |
| Grounding banks | 2 x zigzag, 34.5 kV, with 24.9 Ω NGR, 800 A for 10 s |
Insulation Coordination Summary
| Parameter | 345 kV system | 34.5 kV collector |
|---|---|---|
| Highest system voltage | 362 kV | 38 kV |
| Rated lightning impulse withstand | 1,300 kV | 200 kV |
| Rated switching impulse withstand | 1,050 kV | Not applicable |
| Arrester rating / MCOV | 276 kV / 220 kV | 36 kV / 29 kV |
| Lightning protective level at 10 kA | 612 kV | 104 kV |
| Protective margin | 2.12 (112 percent) | 1.92 (92 percent) |
The 34.5 kV arrester selection follows from the grounding decision. A resistance-grounded system is not effectively grounded, so unfaulted-phase voltage during a ground fault approaches full phase-to-phase value and arresters must be rated 36 kV with 29 kV MCOV rather than the 27 kV units an effectively grounded system would permit. The same logic sets cable insulation at 133 percent. Both are downstream costs of a grounding choice made for fault-current reasons, and both must be included when the trade-off is made rather than discovered afterwards.
Inverter transformers were specified with harmonic-duty capability verified by calculation to IEEE Std C57.110 rather than by a nominal K-factor designation alone. A K-factor rating is a standardized envelope; the C57.110 calculation uses the actual spectrum of the connected inverters to determine the eddy-current loss multiplier and hot-spot rise. For the specified spectrum the result sat just below K-4, and the winding eddy loss factor was written into the tender as a guaranteed figure with a heat run at the specified harmonic loading.
Substation lightning shielding was designed to IEEE Std 998 by the rolling sphere method. Collector surge protection is by arresters at every pad-mounted transformer and every cable-to-overhead transition; three feeder segments crossing terrain requiring rock excavation were built as overhead spans with arresters and dead-front terminations at both ends. The substation sits at one corner of the plant rather than at its electrical centre, which the routing model accounted for; the resulting seven-circuit entrance corridor was managed with engineered backfill, increased spacing and distributed temperature sensing fibre for operational monitoring.
8. Auxiliary Systems
Station service is the auxiliary problem specific to generation plants. A collector substation's station service is naturally taken from the 34.5 kV bus, so any event removing the collector also removes station service — including events during which protection, communications and controls are most needed. Two 750 kVA 34.5 kV / 480 V transformers were provided, one from each bus, with a 400 kW standby diesel generator and automatic transfer supporting the DC chargers, the protection and control building, the transformer cooling needed for controlled cool-down, and security and fire systems.
Auxiliary System Summary
| System | Design |
|---|---|
| DC system | 125 V nominal, two 100 percent chargers, 500 Ah VRLA (calculated 445 Ah) |
| DC autonomy | 8 hours to end voltage with breaker close duty at the end of the duty cycle |
| Communications DC | 48 V, separate battery and charger, 8 hours |
| AC station service | 2 x 750 kVA, 480 V, automatic transfer, 400 kW standby generator |
| Fire and containment | Aspirating smoke detection in the control building; oil containment for 110 percent of oil volume plus firewater |
Battery sizing follows IEEE Std 485 with an aging factor of 1.25, a temperature correction of 1.04 and a design margin of 1.10, giving 445 Ah calculated against a 500 Ah selected cell, with the breaker close and trip duty placed at the end of the discharge. Containment for approximately 120,000 litres of transformer oil, in a location with a shallow water table across parts of the site, required a lined basin with an oil-water separator sized for the design rainfall event as well as the full oil volume.
9. Construction, Commissioning and Energization Support
Keentel supported construction from Month 14 through energization at Month 26 and performance testing to Month 29.
Cable installation was the dominant activity. Every pull was preceded by a calculated tension and sidewall pressure check against the route's actual bend geometry and was recorded. All 412 splices were subjected to 0.1 Hz withstand testing per IEEE Std 400.2 with partial discharge monitoring before energization. Three failed, all traceable to semiconducting shield trimming during the same two-week period by one crew; the crew was requalified and 40 further splices from that period re-tested, all passing. Repairing three splices before energization cost roughly a week of programme; finding them in service, as unexplained feeder trips over two years, would have cost far more and arrived without a diagnosis.
Energization was staged over eleven days. The 345 kV line and bus were energized first and held 24 hours. The step-up transformer followed, from the high-voltage side, with transient recorders capturing a measured first peak of 3,540 A against a modelled 3,310 A — a 6.9 percent difference consistent with residual flux uncertainty — and a measured voltage step of 1.9 percent against a modelled 1.7 percent. Collector feeders were then energized one at a time at 3-second minimum intervals, with harmonic measurement at four defined network states. Inverters were released block by block with plant controller response verified at 10, 25, 50, 75 and 100 percent output.
Performance testing confirmed collector losses at 1.89 percent against a modelled 1.80 percent, within the Owner's 0.25 percentage point requirement, the difference attributable to soil temperature above the design assumption during the test period. Reactive capability was demonstrated at both corners at the point of interconnection, and model validation records were accepted without revision.
10. Results and Value Delivered
| Outcome | Baseline | Delivered |
|---|---|---|
| Collector system losses | 2.90 percent of generated energy | 1.80 percent modelled, 1.89 percent measured |
| Annual loss energy recovered | — | Approximately 12,800 MWh per year |
| Installed collector cable cost | Feasibility baseline | 8 percent lower, net of 4 additional feeders |
| Arrester energy duty, worst TOV case | 11.4 kJ/kV against 9.0 kJ/kV capability | 3.6 kJ/kV, 40 percent of capability |
| Reactive capability at POI | 0.975 pf achievable | 0.95 pf met with margin at 443 MW |
| Collector arcing-fault overvoltage | 4.1 pu modelled with 400 A NGR | 2.3 pu with 800 A NGR |
| Interconnection study acceptance | — | First-pass, no revision cycle |
| Loss uncertainty band for financing | ±0.6 percentage points | ±0.15 percentage points |
The loss reduction alone carries a present value of approximately 5.0 million at the project's energy value and discount rate, against a net capital saving rather than a capital cost. The temporary overvoltage finding is harder to value because it is the avoidance of an event, but the arrester population, transformer bushings and cable terminations exposed to an 11.4 kJ/kV duty represent replacement cost and outage duration of a different order.
11. Challenges and Engineering Lessons Learned
The collector network deserves the same analytical rigour as the substation, and rarely receives it. The collector system accounted for roughly 40 percent of the electrical capital cost and nearly four times the loss energy of the substation and generation tie combined, yet arrived with a feasibility-grade design and a rule-of-thumb loss assumption. The imbalance is structural: substations have owners, standards and review processes, and collector networks are often treated as a balance-of-plant commodity. Model the collector at full detail from the outset and let the substation specification follow from it.
Reactive capability must be evaluated where the obligation is written. The inherited inverter specification met 0.95 power factor at the inverter terminals and would have delivered 0.975 at the point of interconnection. The intervening 86 MVAr of transformer absorption is not a subtlety; it is the largest single term in the reactive balance. The error is common enough to warrant a standing check at the start of any interconnection engagement.
Grounding resistor sizing on a large cable network is a damping problem, not only a current-limiting problem. The instinct to specify a low ground-fault current is sound on a compact system. On 190 km of shielded cable, where capacitive ground-fault current alone is 1,480 A, a 400 A resistor is dominated by the network's own capacitance and leaves the system effectively ungrounded from a transient standpoint. The resistive component must exceed the capacitive component. That check takes an afternoon and is skipped routinely.
Screening grid strength at the point of interconnection is not sufficient. A point-of-interconnection short-circuit ratio of 26.3 suggested a strong interconnection and no interaction risk. The weighted short-circuit ratio, accounting for neighbouring inverter-based plants, was 3.9, and two control loops required retuning as a direct result. Any plant connecting into a corridor already hosting inverter-based generation should be screened on the weighted measure.
Cable installation quality is an engineering deliverable. Three splice failures out of 412, all from one crew in one two-week period, is a normal outcome and a manageable one when the test regime catches them before energization. Energized, the same three would have produced years of intermittent feeder trips with no obvious cause. Specify the tension calculations, bending radii, crew qualification and full very-low-frequency testing, and prohibit direct-current testing on extruded dielectric cable.
12. Keentel Capability Summary
- Owner's engineer and design authority for renewable collector and generator step-up substations at transmission voltage
- Medium-voltage collector design and optimization: topology, feeder count, conductor tapering, economic loading and lifetime loss valuation
- Cable ampacity and thermal analysis to IEC 60287, IEEE Std 835 and the Neher-McGrath method, including soil thermal survey specification and backfill design
- Interconnection study packages in PSS®E: steady-state, dynamic, contingency and reactive capability
- Electromagnetic transient analysis in PSCAD/EMTDC: temporary overvoltage, transformer energization, harmonic impedance scanning, control interaction and sub-synchronous screening
- Protection coordination and unbalanced fault analysis in DIgSILENT PowerFactory, including inverter-based-resource protection philosophy
- AC/DC auxiliary design, cable sizing and arc-flash assessment in ETAP
- Grounding design to IEEE Std 80, plant-wide array grounding, equipotential bonding and transferred-potential control
- Transformer and switchgear specification, capitalized loss evaluation and factory acceptance test witnessing
- IEEE Std 2800 and IEEE Std 519 compliance registers, NERC model validation, and commissioning and energization engineering
13. Frequently Asked Questions
Feeder count is a genuine optimum, found by costing cable and trenching, switchgear and protection, and thirty years of loss energy on a common routing model, then evaluating a range of counts. For this 450 MW plant the total present value curve was shallow between 18 and 22 feeders and rose outside it: fourteen feeders cost 5.9 percent more overall, driven almost entirely by loss energy on long heavily loaded trunks, while twenty-four cost 1.6 percent more, driven by switchgear and protection. Twenty were selected. The shallowness of the optimum is useful, because the count can then be shifted to suit block geometry without penalty. What is not acceptable is picking a count from a rule of thumb and sizing everything else around it.
Current in a collector feeder falls in steps as each inverter block taps off, so the last segment may carry a tenth of the trunk current, and uniform sizing buys aluminium that never carries current. Tapering is applied by the economic-loading method: at each segment, compare the marginal installed cost of the next conductor size up against the present value of the loss energy it saves. Here one kilowatt of loss at rated conditions carried a present value of about 800, setting the transition from 500 to 750 kcmil at 272 A and from 4/0 to 500 kcmil at 114 A. The transition from 750 to 1000 kcmil was governed by thermal rating rather than economics, so the largest conductor was used only where the smaller would overheat.
Yes, and by more than most people expect. A higher DC:AC ratio means the plant spends more hours clipped at rated AC output, which raises annual loss-equivalent hours even though peak current is unchanged. Going from 1.20 to 1.38 raised loss-equivalent hours from 1,530 to 1,870 and the present value of a kilowatt of loss from about 655 to 800. Because economic break-even current scales with the inverse square root of that value, every conductor transition moves down by roughly 10 percent in current, so larger conductor is justified across the network. A related trap: the empirical loss-factor formulas from distribution practice understated the loss factor for this clipped profile by about 32 percent.
Because it usually does not pay outside the congested corridors. Native soil here tested at 90 °C·cm/W dry, which supports the required ampacity for circuits installed singly or in pairs. Fluidized thermal backfill costs money to supply, place and verify along every metre of trench, and the ampacity it recovers on a lightly loaded lateral has no value because the conductor is not thermally limited there. The economics change where circuits converge: at three or more circuits in a shared trench, mutual heating derates ampacity by 17 to 26 percent, and at the substation entrance seven circuits converge. Engineered backfill was specified there and at road crossings, and native backfill elsewhere.
Considerably more than the point-of-interconnection number. Work the reactive path backwards: the generator step-up transformer absorbs 86 MVAr at rated throughput on 11.5 percent impedance, the 120 inverter transformers absorb about 24 MVAr, and collector cable reactance absorbs 8 MVAr, against a gain of 29.5 MVAr of cable charging. Meeting +148 MVAr at the point of interconnection therefore requires about 237 MVAr at the inverter terminals. Inverters specified at 0.95 power factor at their own terminals deliver only 148 MVAr, giving 0.975 at the point of interconnection. The resolution here was 0.90 power factor at rated active power plus a reactive-priority control mode allowed to trim active power by up to 1.5 percent in the rare binding corner.
Because the plant already has 29.5 MVAr of capacitance in its collector cable, and that capacitance sets a parallel resonance with the generator step-up transformer at harmonic order 6.87. Adding 24 MVAr of shunt capacitance would have moved the resonance towards the fifth harmonic, where inverter emission is strongest, and the plant was already meeting IEEE Std 519 voltage limits with modest margin. Uprating the inverter reactive specification cost less than a capacitor installation and carried no harmonic consequence. A bay and foundation were reserved for a 15 MVAr C-type damped filter in case measured performance required it; it did not, but the provision cost almost nothing and would have been expensive to retrofit.
Two competing requirements, and on a large cable network the second usually wins. The first is limiting fault damage and ground potential rise, which pushes the current down. The second is dominating the network's own capacitive ground-fault current, which pushes it up. Here 190 km of shielded cable produces 1,480 A of capacitive ground-fault current, 740 A per bus with the tie open. The originally specified 400 A resistor was smaller than the capacitance it had to damp, and EMT simulation of a restriking arcing fault produced recurring overvoltages to 4.1 per unit. Resizing to 800 A per bus, so the resistive component slightly exceeds the capacitive, reduced that to 2.3 per unit and gave unambiguous residual detection on every feeder.
Because it determines whether the plant is a zero-sequence ground source, and that determines temporary overvoltage. With a delta high-voltage winding the plant presents no ground path, so a line-to-ground fault isolated from the system source drives the unfaulted phases towards phase-to-phase voltage: 1.82 per unit here, sustained 0.51 seconds, producing an arrester energy duty of 11.4 kJ/kV against a 9.0 kJ/kV class capability. That is arrester failure. With a grounded-wye high-voltage winding and delta secondaries the same event gives 1.28 per unit and 1.9 kJ/kV. The cost is that the plant contributes zero-sequence current to transmission ground faults, which must be coordinated with the Transmission Provider's line protection.
By recognizing that the two directions are different problems. For a fault on a feeder, the contribution from the transmission system through the generator step-up transformer is large — over 30 kA at the bus — and ordinary overcurrent detects it easily. The difficulty is the reverse case: for a fault on an adjacent feeder, a healthy feeder's inverters contribute through the bus, and undirected overcurrent can trip the wrong breaker. Directional overcurrent with memory polarization solves this. Ground faults need separate treatment because resistance grounding limits them to 800 A and each feeder contributes about 74 A of residual charging current during external faults, so residual elements are set at 120 A with directional supervision.
Closing one feeder breaker energizes about six 4.0 MVA pad-mounted transformers simultaneously, producing a modelled aggregate first-peak inrush of 2,150 A — 5.6 times feeder rating — decaying within about 0.4 seconds. Energizing all ten feeders on a bus at once gives a modelled 17.8 kA, which will trip a main breaker set for fault protection. The answer is a supervised restoration sequence: feeders closed at minimum 3-second intervals, trackers and block auxiliaries energized only after collector voltage is stable, and inverters held blocked until voltage and frequency are verified. Cold-load pickup adds tracker motor starting and inverter precharge, which the sequence deliberately separates from transformer inrush.
Either can be defended; the deciding factor is the spare strategy, not the unit count. Two units halve the consequence of a failure but require a second high-voltage bay with its own bushings, arresters, foundations, firewalls and containment, and they double the no-load loss carried for all 8,760 hours against a resource generating in about 2,500 equivalent hours. Here a single unit with no spare gave an expected annual energy at risk of 0.62 percent, dominated by a 12-to-16-month replacement lead time. A portfolio spare stored ready for deployment cut expected replacement to about 16 weeks and energy at risk to 0.11 percent, at a fraction of the cost of a second installed unit.
For a plant of this size, from receipt of validated data to issued-for-construction documentation, 30 to 40 weeks is typical, with substation and collector work running in parallel. The critical path is rarely modelling effort. It is usually three items: a validated electromagnetic transient inverter model from the supplier, often released late and under restrictive terms; the Transmission Provider's network equivalent and any interconnection restudy; and soil thermal and electrical property surveys, which cannot be compressed and which govern cable sizing. Here the long-lead step-up specification had to be frozen in Month 4, so the temporary overvoltage study was pulled forward on preliminary data and confirmed later — which is what allowed the winding configuration to change before procurement.
14. Glossary of Terms and Abbreviations
| Term | Definition |
|---|---|
| Ampacity | Continuous current a cable can carry without exceeding its rated conductor temperature |
| Clipping | Limitation of plant output when DC array capability exceeds inverter AC rating |
| Collector system | Medium-voltage network gathering generation from distributed inverters to the substation |
| Counterpoise | Continuous buried bare conductor providing a low-impedance ground return path |
| DC:AC ratio | Ratio of installed DC array capacity to inverter AC rating |
| Economic loading | Conductor selection where marginal cable cost equals present value of avoided losses |
| GFOV | Ground-fault overvoltage, unfaulted-phase rise when no zero-sequence source is present |
| GPR | Ground potential rise, grid voltage relative to remote earth during a fault |
| GSU | Generator step-up transformer |
| IBR | Inverter-based resource |
| K-factor | Standardized transformer rating envelope for non-sinusoidal load current |
| Loss-equivalent hours | Hours at rated current producing the same annual loss energy as the actual profile |
| MCOV | Maximum continuous operating voltage of a surge arrester |
| Mesh voltage | Worst-case touch voltage within a grounding grid mesh, per IEEE Std 80 |
| Neher-McGrath | Analytical method underlying North American cable ampacity calculation |
| NGR | Neutral grounding resistor, limiting ground fault current on a grounded system |
| ONAN / ONAF / ODAF | Oil natural air natural / air forced / oil directed air forced cooling classes |
| Pad-mounted transformer | Compartmental ground-mounted transformer serving inverters at the block level |
| POI | Point of interconnection, the ownership and compliance boundary with the network |
| Sidewall bearing pressure | Force per unit length exerted by cable on a bend during pulling |
| SSCI | Sub-synchronous control interaction between converter controls and network |
| Sympathetic inrush | Prolonged asymmetric current in an energized transformer caused by energizing another |
| TDD | Total demand distortion, harmonic current relative to maximum demand current |
| Thermal resistivity | Soil property governing heat removal from buried cable, in °C·cm/W |
| TOV | Temporary overvoltage, a power-frequency overvoltage of limited duration |
| VLF | Very low frequency, typically 0.1 Hz, used for field withstand testing of cable |
| WSCR | Weighted short-circuit ratio, grid strength accounting for neighbouring IBR plants |
15. Confidentiality and Use Statement
This case study has been prepared for informational purposes. All client identities, project locations, contract details, and proprietary data have been withheld or generalized. Technical parameters, study results, and figures presented are representative of work performed by Keentel Engineering Solutions and have been adapted so that no individual project, owner, or facility can be identified. Nothing in this document constitutes a design recommendation for any specific installation. Any reuse of the methodologies described requires project-specific engineering analysis by a qualified professional engineer.