1. Executive Summary
The Client, a municipal distribution utility serving a densifying urban core, operated a distribution substation that had reached the end of its useful capacity. Two 20/26.6 MVA transformers supplied eight 15 kV class feeders into an area where peak demand had climbed to 34 MW. Firm capacity with one transformer out of service was 26.6 MVA, so the station had already lost N-1 compliance: a single transformer failure on a peak day required either an eight-hour emergency overload at approximately 130 percent of the surviving unit's forced-cooled rating or the shedding of roughly 8 MW of load. Feeder-end voltage on the two longest circuits fell to 0.923 pu at peak, below the ANSI C84.1 Range A service limit, and customer minutes lost were rising year on year.
Keentel Engineering Solutions was engaged as planning consultant and design authority for a reinforcement programme intended to serve a fifteen-year horizon without acquiring a new station site. The delivered scope covered spatial load forecasting, distribution planning, the substation design basis, all system studies, protection and automation philosophy, a network-wide feeder reconfiguration programme, a distribution automation and self-healing scheme, and commissioning support.
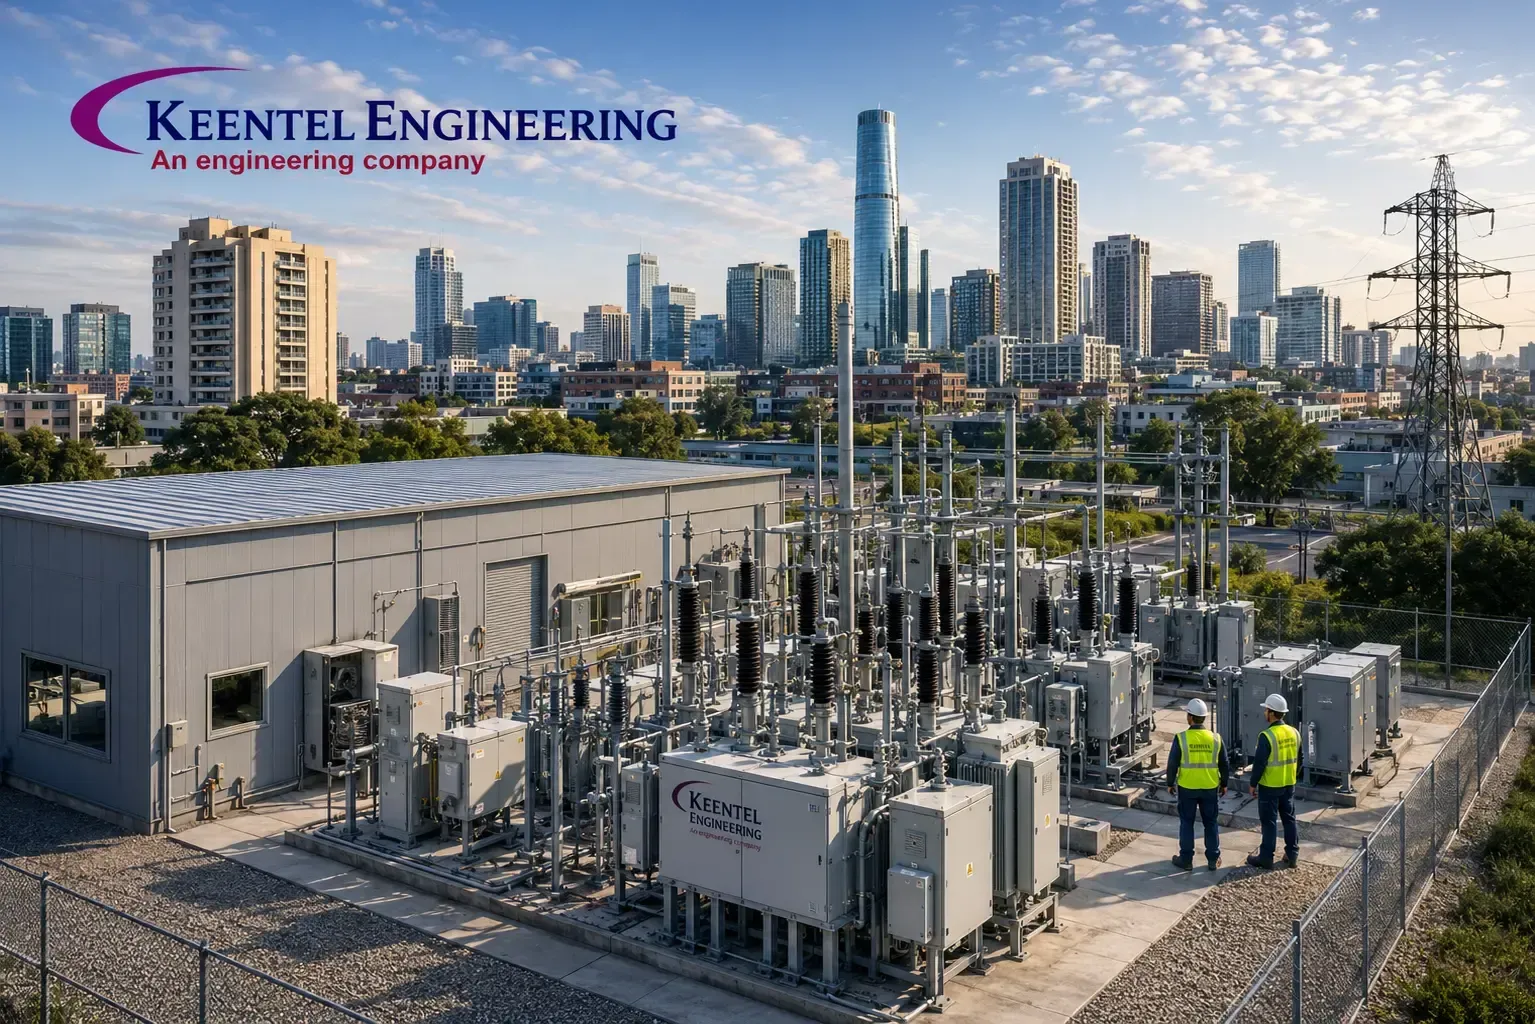
The station was rebuilt in place around a 115 kV ring bus, three 30/40 MVA 115/15 kV transformers, a new 115/34.5 kV subtransmission tier feeding two satellite unit substations, and indoor 15 kV metal-clad switchgear with twenty feeder positions. The feeder programme redistributed load across a reconfigured network, added capacitor banks, mid-feeder voltage regulators, conservation voltage reduction and volt-var optimization, and installed a fault location, isolation and service restoration scheme across six primary loops.
Figures presented are representative of the delivered design and have been generalized to protect client confidentiality.
The programme lifted firm capacity from 26.6 MVA to 80 MVA against a horizon-year forecast of 61 MW, improved SAIFI from 1.42 to 0.71 interruptions per customer-year and SAIDI from 118 to 54 minutes, raised worst-case feeder-end voltage from 0.923 pu to 0.968 pu, reduced modelled distribution losses from 4.6 percent to 3.1 percent of energy delivered, and increased aggregate distributed generation hosting capacity from 11.2 MW to 31.6 MW. It was delivered for approximately 46 percent of the estimated capital of the greenfield station alternative and pushed the next site acquisition beyond the planning horizon.
Project at a Glance
| Attribute | Detail |
|---|---|
| Asset type | In-place rebuild of an urban distribution substation |
| Voltage levels | 115 kV / 34.5 kV / 13.8 kV (15 kV class) |
| Transformation | 3 x 30/40 MVA 115/13.8 kV with LTC; 1 x 25/33 MVA 115/34.5 kV |
| Bus schemes | 115 kV ring bus (6 positions); 15 kV three-section metal-clad, normally split |
| Distribution scope | 20 feeder positions, 34 reclosers, 6 FLISR loops, CVR and VVO |
| Keentel scope | Load forecast, planning studies, design basis, protection and DA philosophy, commissioning |
| Headline outcome | Firm capacity 26.6 to 80 MVA; SAIDI 118 to 54 minutes; new station deferred |
2. Project Context and Business Drivers
The supply area is a mature urban district that had been static for a generation and then changed character quickly. Low-rise residential blocks were being replaced by mid-rise infill at three to four times the previous dwelling density, two former light-industrial parcels were being redeveloped as mixed-use commercial, and a cluster of data-adjacent tenants — edge compute, media production and telecommunications aggregation — had taken space in converted industrial buildings, adding load with a very high load factor and low tolerance for interruption.
Electrification compounded this. Building-code changes and incentive programmes were converting gas space and water heating to heat pumps at a measurable rate, shifting the load shape toward a winter evening peak. Light-duty EV adoption was following a familiar S-curve, and two fleet depots and a curbside charging programme sat in the connection queue. The utility had no defensible method for translating any of it into feeder-level demand.
The symptoms were those that appear when a network is asked to carry load it was not planned for. Both station transformers exceeded their 20 MVA ONAN nameplate on peak days, the more heavily loaded unit reaching 21.8 MVA. Feeder-end voltage on the two longest circuits fell to 0.923 pu. Two feeders were within 8 percent of their conductor thermal rating and could not accept a contingency transfer from a neighbour. Reliability had deteriorated to 1.42 interruptions and 118 minutes per customer per year, much of the duration attributable to long single-feeder restorations across circuits carrying 3,400 customers each.
The Client's initial position was that a new substation site was required. In a district with this land value and permitting environment, site acquisition was the dominant cost and schedule risk, and a realistic in-service date lay well beyond the point at which firm capacity would be exhausted. Keentel was asked instead to test whether the existing site, an adjacent utility-owned parcel and the surrounding feeder network could be engineered to carry the horizon load. That question — capacity from planning and reconfiguration rather than from land — framed every decision that followed.
3. Design Basis and Technical Requirements
The design basis was issued at Month 3 as a controlled document. It carried both the substation criteria and, unusually, the distribution planning criteria, because the case for the station depended on what the feeder network could be made to do.
Site and Environmental Design Criteria
| Parameter | Design value |
|---|---|
| Maximum ambient air temperature | 38 °C (32 °C maximum daily average) |
| Minimum ambient air temperature | -22 °C |
| Altitude | 145 m above sea level |
| Design wind speed (3 s gust) | 47 m/s |
| Seismic design category | Site class D, 0.21 g short-period design acceleration |
| Pollution severity | Light to medium, urban particulate and winter de-icing salt |
| Soil resistivity | 62 Ω·m upper layer to 3.1 m depth; 190 Ω·m lower layer |
| Boundary noise criterion | 62 dBA at the property line, night-time |
The climate is temperate continental with both a summer cooling peak and a winter heating peak, which is why the load forecast had to be built as two seasonal forecasts rather than one. The noise criterion is an urban constraint with real design consequences: it drove transformer sound-level specification, fan control staging and a barrier wall, and eliminated one candidate layout.
Standards Register
| Standard | Application |
|---|---|
| ANSI C84.1 | Electric power systems and equipment, voltage ratings and ranges |
| IEEE Std 1366 | Distribution reliability indices and major event day classification |
| IEEE Std 1547/ 1547.1 | DER interconnection, smart inverter functions and conformance testing |
| IEEE Std 1547.7 | Guide for conducting distribution impact studies for DER |
| IEEE Std C37.60 / C37.104 | Automatic circuit reclosers; automatic reclosing on distribution lines |
| IEEE Std C57.91 | Loading guide for mineral-oil-immersed transformers |
| IEEE Std C37.20.2 / C37.20.7 | Metal-clad switchgear; internal arcing fault testing |
| IEEE Std 242 | Protection and coordination of industrial and commercial power systems |
| IEEE Std 1584 | Arc-flash hazard calculation |
| IEEE Std 80 | Safety in AC substation grounding |
| IEEE Std 367 / Std 487 | Ground potential rise and protection of telecommunication circuits |
| IEEE Std 485 | Sizing lead-acid batteries for stationary applications |
| IEEE Std 519 | Harmonic control in electric power systems |
| IEEE Std 1815 (DNP3) | Distributed network protocol for SCADA and distribution automation |
| IEC 60076 series | Power transformers, rating, losses, temperature rise, tap changers |
| ANSI/NFPA 70 and NFPA 850 | Electrical code; fire protection for substation facilities |
The Owner's functional requirements set the framework: firm N-1 capacity at the horizon-year forecast peak, service voltage within ANSI C84.1 Range A at all metered points under normal conditions and Range B under first contingency, the ability to transfer every feeder's full load to at least two adjacent circuits, provision for a fourth 115/13.8 kV transformer bay without a station outage, eight-hour DC autonomy, and a documented hosting capacity method the utility could administer without further consultant involvement.
The 15 kV designation in the title refers to the equipment insulation class. Nominal system voltage on the distribution bus is 13.8 kV, four-wire multi-grounded wye. The subtransmission tier is 34.5 kV, low-resistance grounded through a 400 A neutral grounding resistor at the source transformer.
4. Substation Configuration and Single-Line Architecture
4.1 115 kV bus scheme selection
The existing 115 kV arrangement was a two-line tap with motor-operated disconnects and no high-side breakers, so a transformer fault dropped both incoming circuits until manual isolation. The rebuild adopted a six-position ring bus.
| Criterion | Ring bus | Main and transfer | Breaker-and-a-half |
|---|---|---|---|
| Relative capital cost | Baseline | -12 percent | +40 to 48 percent |
| Land area required | Baseline | -10 percent | +35 percent |
| Breakers per position | 1.0 | 1.0 plus transfer breaker | 1.5 |
| Consequence of breaker failure | Ring splits, two positions lost | Bus section lost | One position lost |
| Practical position limit | 6 | 8 to 10 | No practical limit |
The ring bus was selected for its single-contingency behaviour at low cost: any single breaker or bus fault removes one position and the ring reconfigures around it, with no loss of supply to the remaining transformers. Its weakness was documented explicitly — with the ring open for maintenance a second fault splits the station, and the scheme does not scale beyond six positions. The layout therefore reserves space and foundation provision for conversion to breaker-and-a-half when a seventh position is needed, and the ring may not run open during the peak-season restriction period. The six positions are two incoming circuits, three 115/13.8 kV transformers and one 115/34.5 kV transformer.
4.2 Transformation and the 35 kV subtransmission tier
Three 30/40 MVA ONAN/ONAF 115/13.8 kV transformers replaced the two existing units, giving 80 MVA of firm capacity with the largest unit out. Delta-wye connection with a solidly grounded 13.8 kV neutral follows four-wire multi-grounded practice and provides a ground source for feeder protection.
Impedance was specified at 12.0 percent on the 30 MVA ONAN base, deliberately higher than the 8 to 9 percent a purely economic specification would have produced. The reason is fault duty. At 9 percent, two transformers paralleled on a common 13.8 kV section would produce symmetrical fault current above 24 kA, forcing a 31.5 kA switchgear class and eliminating reuse of existing cable and termination designs. At 12 percent the same case yields 18.7 kA and the station fits within 25 kA metal-clad switchgear. The cost is roughly 3.6 percent additional voltage drop at full load, recovered by the 32-step ±10 percent load tap changer and by feeder voltage control.
The new 115/34.5 kV tier is the element that made site deferral possible. A single 25/33 MVA transformer here feeds a 34.5 kV cable loop that also connects to an existing source elsewhere on the host utility network, so the loop is N-1 secure without a second bank on this site. It supplies two satellite unit substations, each with two 12/16 MVA 34.5/13.8 kV transformers and six feeder positions, on small parcels the utility already owned. Each satellite is roughly one-tenth the footprint of a full 115 kV station and needed no transmission-voltage permitting. Together they take about 14 MW of horizon-year load off the main station and place distribution sources inside two of the three growth pockets identified by the spatial forecast, shortening feeders precisely where voltage and reliability were worst.
4.3 15 kV switchgear architecture
Distribution switchgear is indoor metal-clad in three bus sections, one per transformer, with two normally open bus-tie breakers, carrying 20 feeder positions, three main breakers, two ties, three capacitor bank positions, two station service positions and four spare cubicles.
Normal operation is with the bus split three ways, which holds fault duty to the single-transformer case and confines a bus fault to one third of the station. Ties are closed only for load transfer during transformer outages or maintenance switching, and because they can be closed under load the two-transformer parallel case remains the fault duty design basis. Bus differential protection on each section is what allows a bus fault to be cleared fast enough to keep incident energy within a practical arc-flash category.
5. System Studies and Analysis
5.1 Spatial load forecasting
The forecast is the foundation of this project and preceded every equipment decision. A system-level trend line would have been useless: growth is not uniform, and the question was not only how much load but where. Keentel divided the service area into 214 analysis cells aligned to census and zoning boundaries, assigning each a current land-use class, a current demand derived from billing and AMI data allocated to distribution transformers, and a horizon-year land-use class from published zoning and redevelopment plans. End-use densities in watts per square metre were calibrated against measured demand in cells that had already redeveloped, anchoring the forecast in the utility's own data rather than generic tables.
Historical peaks were weather-normalized first. Daily peak demand was regressed against a temperature-humidity index in summer and heating degree days with a wind-chill term in winter, giving R² of 0.91 and 0.87 and a summer sensitivity of 0.68 MW per °C above 24 °C. The observed summer peak of 32.6 MW normalized to 34.0 MW at 1-in-5 weather, and that became the base year.
Horizon-Year Load Forecast Build-Up
| Growth component | MW at horizon | Basis |
|---|---|---|
| Residential infill and redevelopment | +8.6 | Land-use conversion, 214 analysis cells |
| Mixed-use commercial redevelopment | +4.9 | Floor-area density, calibrated end-use |
| Heat pump conversion (winter peak) | +5.8 | Conversion rate scenario, HDD regression |
| Electric vehicle charging | +7.4 | S-curve adoption, central scenario |
| Data-adjacent commercial | +3.1 | Connection queue plus speculative allowance |
| Behind-the-meter solar (net-load credit) | -2.8 | Coincidence with peak hour only |
| Base year (weather-normalized) | 34.0 | 1-in-5 summer conditions |
| Horizon-year forecast peak | 61.0 | Winter evening peak, central scenario |
Compound growth near 4.0 percent per year would have been rejected from a trend extrapolation; built up from land and end use it is defensible line by line. The most consequential finding was seasonal. Heat pump conversion adds load coincident with a winter evening peak already elevated by lighting, cooking and unmanaged EV charging, and crossover occurs in the ninth year — 61 MW winter against 56 MW summer. Winter peaking changes which constraint binds: transformer overload capability improves in cold ambient, but voltage drop worsens at an evening peak when behind-the-meter solar contributes nothing. Every rating was therefore checked in both seasons.
5.2 Coincidence, diversity and load allocation
Feeder planning fails when non-coincident peaks are summed without diversity. The eight existing feeders' non-coincident peaks summed to 38.7 MVA against a measured station coincident peak of 34.7 MVA — a diversity factor of 1.12 and coincidence factor of 0.90, measured per feeder class at 0.86 residential-dominant and 0.94 commercial-dominant rather than assumed.
Load allocation in CYME used connected kVA weighted by billed energy at each distribution transformer, reconciled to measured feeder peak and validated against AMI interval data on 4 percent of service points; the model holds 1,860 line sections and 940 distribution transformers in three-phase unbalanced form. Milsoft built an independent allocation from the consumer database, agreeing within 4.1 percent at feeder level and 9 percent at section level. A load factor of 0.58 gives a loss factor of 0.37 from LsF = 0.15 LF + 0.85 LF², used later in the loss economics.
5.3 Electric vehicle and DER scenarios
EV load was modelled as an adoption S-curve applied to registered light-duty vehicles per analysis cell, multiplied by a charging-behaviour model rather than an average energy figure. Three scenarios were carried through the study.
| Parameter | Low | Central | High |
|---|---|---|---|
| Light-duty fleet electrified | 14 percent | 24 percent | 42 percent |
| Residential coincidence factor at peak hour | 0.11 | 0.19 | 0.31 |
| Light-duty contribution to peak | 2.1 MW | 4.4 MW | 9.6 MW |
| Depot and curbside contribution to peak | 1.9 MW | 3.0 MW | 4.2 MW |
| Total EV contribution to system peak | 4.0 MW | 7.4 MW | 13.8 MW |
The coincidence factor is where the engineering sits. Unmanaged home charging clusters in the two hours after the evening commute, coincident with the winter peak; the low scenario assumes a managed-charging tariff shifts most of it past midnight. Two fleet depots with 2.4 MW connected charge overnight, contributing almost nothing at peak but concentrating 1.6 MW at one point and setting the feeder thermal rating in the small hours. The 96-point curbside programme was modelled at 0.35 coincidence, higher than depot charging because sessions are opportunistic and follow the evening pattern.
Behind-the-meter solar was modelled for net-load effect, not as capacity: 2.8 MW of a projected 19 MW installed is credited at the summer peak hour and nothing at the winter evening peak. The duck-curve consequence is operational — the daily net-load ramp grows from 11 to a projected 24 MW per hour, which tap changer and capacitor controls must follow without excessive operation counts. That drove the tap changer duty specification more than the peak value did.
5.4 Deterministic and probabilistic planning criteria
The utility's deterministic standard required firm capacity above the 1-in-10 weather-normalized peak with the largest transformer out; applied literally it put the station in violation in the third year and demanded all three transformers at once. Keentel ran a parallel probabilistic assessment — 10,000 annual Monte Carlo iterations combining weather-driven load uncertainty, transformer failure and repair durations, mobile substation availability and forecast uncertainty across the three growth scenarios — reporting expected unserved energy and shed probability per staging option.
| Staging option | Expected unserved energy | Probability of shed event/yr | Relative capital timing |
|---|---|---|---|
| Three transformers at Month 0 | 0.9 MWh/yr | 0.4 percent | Baseline |
| Third transformer deferred to Year 6 | 3.4 MWh/yr | 1.7 percent | 26 percent deferred |
| Third transformer deferred to Year 9 | 14.8 MWh/yr | 6.9 percent | 26 percent deferred |
| Two transformers only, no third bay | 61.2 MWh/yr | 22.4 percent | 31 percent avoided |
The Year 6 option was adopted, with bay, foundations, bus work and the switchgear section built at Month 0 so the third unit could be added without a station outage. The deterministic criterion was restated as a trigger rather than abandoned: the transformer is ordered when the weather-normalized peak reaches 46 MW, not on a calendar date. The Client has since adopted the trigger form as standard practice.
5.5 Short-circuit and equipment duty
Short-circuit analysis used CYME for the distribution system and PSS®E for the 115 kV interface, with agreement checked at the station bus.
| Location | Three-phase symmetrical | Single line-to-ground | Equipment rating |
|---|---|---|---|
| 115 kV ring bus | 21.4 kA | 19.8 kA | 40 kA |
| 34.5 kV bus | 7.5 kA | 400 A (NGR limited) | 25 kA |
| 13.8 kV bus, one transformer | 9.9 kA | 10.4 kA | 25 kA |
| 13.8 kV bus, two paralleled | 18.7 kA | 19.3 kA | 25 kA |
| 13.8 kV bus, two paralleled plus DER | 19.3 kA | 19.8 kA | 25 kA |
Ground fault current at the 13.8 kV bus exceeds the three-phase value because the delta-wye transformer with a solidly grounded neutral presents a zero-sequence impedance below its positive-sequence impedance, so the switchgear rating must be checked against the ground fault case. The DER contribution of 0.6 kA is modest — inverters are current-limited near 1.2 times rated output — but it rises with hosting capacity, so horizon-year penetration was carried. On the 34.5 kV tier the neutral grounding resistor holds ground fault current to 400 A, limiting cable shield duty and step-and-touch exposure but making ground-fault detection a sensitivity problem rather than a magnitude problem.
5.6 Voltage, conservation voltage reduction and volt-var
The voltage study was run on the reconfigured feeder set in CYME at winter evening peak, summer peak, and minimum load with maximum solar.
| Condition | Before | After | Criterion |
|---|---|---|---|
| Worst feeder-end voltage, system peak | 0.923 pu | 0.968 pu | ≥ 0.950 pu, Range A |
| Worst feeder-end voltage, first contingency | 0.901 pu | 0.954 pu | ≥ 0.917 pu, Range B |
| Highest voltage, minimum load with solar | 1.061 pu | 1.043 pu | ≤ 1.050 pu, Range A |
| Voltage spread along worst feeder | 7.7 percent | 3.4 percent | ≤ 4.0 percent target |
| Station power factor at peak | 0.94 lagging | 0.99 lagging | ≥ 0.98 |
Compressing the voltage spread is what makes conservation voltage reduction possible: CVR lowers delivered voltage toward the bottom of Range A to exploit the voltage dependence of load, and is safe only if the flattest customer stays above the lower limit. Compression came from mid-feeder 32-step single-phase regulators on four long circuits, switched capacitor banks placed by the CYME optimal capacitor placement module, and shorter feeders from the satellites and the reconfiguration programme.
CVR was commissioned with a measurement protocol, not a claim. Fourteen feeders ran alternating weekly on-off cycles for a full season with load, voltage and weather logged at fifteen-minute resolution, regressed after weather and day-type normalization. The measured CVR factor was 0.72 against an assumed 0.65; with an achieved average voltage reduction of 2.4 percent that is 1.73 percent off demand and energy — about 0.75 MW at peak and 3,600 MWh per year.
Volt-var optimization runs in the utility's ADMS on a fifteen-minute cycle from a CYME-exported model, using voltage telemetry from AMI meters at feeder extremities. This end-of-line feedback replaced line drop compensation, which infers remote voltage from measured current and an assumed impedance — an inference that fails once distributed generation makes station current unrepresentative of the load beyond it. Measured end-of-line voltage has no such failure mode, and it was a condition of allowing CVR on feeders with significant solar.
5.7 Loss reduction and reconductoring economics
Technical losses were modelled at 4.6 percent of energy delivered, driven by high current on a few heavily loaded trunk sections, severe phase unbalance, and low power factor upstream of the station capacitors.
Phase balancing was the cheapest improvement available: worst-feeder current unbalance of 18.4 percent with 122 A of neutral current fell to 4.2 percent and 31 A after 61 lateral and distribution-transformer phase reassignments, most of them a single connector change at a pole. Because loss varies with the square of current, unbalance correction returns more per unit of expenditure than almost anything else in a distribution network.
Reconductoring was evaluated economically, not thermally. Eleven trunk sections were candidates for upgrade from 477 kcmil to 795 kcmil, each assessed by installed cost against the present value of loss savings using the 0.37 loss factor, an A-plus-B evaluation with separate demand and energy components, and a twenty-year period at the utility's discount rate. Only three cleared; for the rest the contingency capacity came far more cheaply from a feeder tie — the alternative a purely thermal assessment never surfaces. With capacitor placement and reconfiguration, losses fell to 3.1 percent, worth about 3,400 MWh per year and, with CVR, an annual benefit near 7,000 MWh.
5.8 Contingency load transfer analysis
The reconfiguration programme was driven by one criterion: every feeder must transfer its full peak load to adjacent circuits under first contingency, with voltage above 0.917 pu and no element above its emergency rating.
| Metric | Before | After |
|---|---|---|
| Feeders from this station | 8 | 20 |
| Average feeder peak demand | 4.3 MVA | 2.4 MVA |
| Average customers per feeder | 3,400 | 1,450 |
| Average circuit exposure per feeder | 14.6 km | 7.8 km |
| Peak load transferable under N-1 | 41 percent | 96 percent |
The analysis ran as an automated sequence in CYME across every credible single-element outage — feeder breaker, trunk section and transformer — with the switching plan recorded for each case. The residual 4 percent of load that cannot be fully transferred sits at the end of two circuits where a tie would cross a rail corridor, documented as a known exception with a cost to close rather than discovered during an outage.
5.9 Transient studies
PSCAD/EMTDC addressed three phenomena that steady-state tools cannot.
Capacitor switching. Back-to-back energization of a 4.8 MVAr bank against one already in service gave a computed inrush of 24.3 kA peak at 5.1 kHz, exceeding the 20 kA and 4.25 kHz limits for definite-purpose capacitor switching devices; 100 µH current-limiting reactors reduced it to 8.9 kA at 1.6 kHz. Voltage magnification at customer low-voltage banks reached 1.9 pu at a 480 V commercial bus unmitigated, and 1.24 pu with synchronous closing control.
Ferroresonance on the 34.5 kV tier. Cable capacitance in series with an unloaded transformer's magnetizing reactance is the classic ferroresonant configuration. A saturable transformer model showed sustained overvoltage reaching 2.4 pu for single-pole switching above 320 m of cable. Mitigation is physical and procedural: gang-operated three-phase switching only, no single-phase fusing on the loop, a cable length limit in the design, and secondary loading before high-side energization where practicable.
Transformer inrush. A 40 MVA unit gave a modelled first-peak inrush of 8.2 times rated current, with the second-harmonic ratio falling from 21 percent to 9 percent at 400 ms. Because the ratio drops below typical 15 percent restraint thresholds while differential current is still appreciable, cross-blocked harmonic restraint across all three phases was required in place of per-phase restraint.
5.10 Hosting capacity and reverse power flow
Hosting capacity was assessed per feeder by adding generation at each node in increments until one of four criteria was violated: steady-state overvoltage above 1.05 pu, thermal loading above rating, a voltage change above 3 percent for a step change in output, or a defined reduction in protection reach or sensitivity.
| Limiting criterion | Before, binding cases | After, binding cases | Aggregate capacity |
|---|---|---|---|
| Steady-state overvoltage | 5 of 8 feeders | 3 of 20 feeders | — |
| Thermal | 1 of 8 feeders | 2 of 20 feeders | — |
| Voltage fluctuation | 2 of 8 feeders | 1 of 20 feeders | — |
| Protection reach or sensitivity | 0 of 8 feeders | 4 of 20 feeders | — |
| Aggregate hosting capacity | 11.2 MW | 31.6 MW | +182 percent |
The shift in binding constraint is the interesting result. Overvoltage previously limited five of eight feeders; afterwards, with tighter voltage control and shorter feeders, protection sensitivity became the most common constraint — a healthier position, since protection limits can often be relieved by settings rather than capital.
Regulators set for unidirectional operation can run to the wrong end of their range under reverse flow, so the four mid-feeder units were specified with bidirectional detection and cogeneration mode, the reverse-power threshold set above the measurement noise floor to prevent hunting near zero flow. The station tap changer controls were reviewed likewise, since reverse flow at the station bus becomes credible at high solar penetration during light spring load. A smart-inverter settings policy was issued as a standing document: IEEE Std 1547-2018 Category B ride-through, a default volt-var characteristic, volt-watt and frequency-watt enabled, and a defined process for granting non-default settings.
6. Protection, Automation and Control Philosophy
6.1 Protection zones and functions
Protection follows a zone philosophy with overlapping current transformer boundaries and no unprotected sections. Transformer and bus zones are unit-protected; feeders use directional overcurrent with reclosing.
| Zone | Primary functions | Backup functions |
|---|---|---|
| 115 kV ring bus | 87B low-impedance bus differential | 51/51N on ring positions, 50BF |
| 115/13.8 kV transformer | 87T with cross-blocked restraint, 63, 49 | 51/51N high side, 51G neutral |
| 115/34.5 kV transformer | 87T, 63, 49, 51G on NGR | 51/51N, 50BF |
| 13.8 kV bus section | 87B, 50BF on main and tie | 51 on transformer LV, 27/59 |
| 13.8 kV feeder | 67/67N directional overcurrent, 79, 50/51 | 51N ground, 46 unbalance alarm |
| 34.5 kV cable loop | 87L line differential over fibre, 67N | 21 distance backup, 50BF |
Directional overcurrent on feeders is a change from the utility's previous non-directional practice, driven by the DER study. With inverter-based generation on adjacent feeders, a fault on one circuit draws contribution from generation on another through the station bus, and non-directional ground elements on the healthy feeder can operate. Directional supervision removes that exposure, and ground element settings were re-derived with horizon-year DER contribution included so they stay sensitive to high-impedance faults while secure against through-fault contribution. Reclosing on DER-dense feeders is supervised by dead-line voltage detection with an extended first-shot dead time, guarding against reclosing onto an unintentional island.
Line differential on the 34.5 kV loop is justified by the 400 A ground fault limit: overcurrent grading where ground fault current approaches load current is not a reliable basis for fast selective clearing, whereas a differential scheme is indifferent to fault magnitude.
Arc-flash analysis to IEEE Std 1584 confirmed the value of bus differential. With the 87B in service, an 18.1 kA arcing fault on the 13.8 kV bus clears in four cycles for 4.6 cal/cm² at 914 mm working distance; cleared instead by transformer low-side backup overcurrent at 0.42 s it yields 19.3 cal/cm². An arc-flash reduction maintenance setting is provided on the feeder relays.
6.2 Distribution automation and FLISR
The reliability improvement is delivered mainly outside the substation fence: 34 pole-mounted reclosers and 18 motor-operated sectionalizing switches, organized into six primary loops with fault location, isolation and service restoration logic.
| Attribute | Distributed peer-to-peer | Centralized ADMS |
|---|---|---|
| Typical restoration time | 30 to 45 s | 2 to 3 minutes |
| Dependence on comms backbone | Local loop only | Full path to control centre |
| Multi-feeder and multi-source transfers | Limited | Full capability |
| Load and voltage checking before transfer | Pre-configured limits | Real-time power flow |
| Settings management effort | High, per device | Moderate, central model |
A hybrid was adopted. The six primary loops run distributed logic between adjacent reclosers, isolating and restoring unfaulted sections within a 45-second target with no dependence on the control centre. The ADMS scheme sits above it and handles what distributed logic handles badly: transfers involving more than two feeders, transfers whose acceptability depends on a real-time power flow check, and restoration during an outage on the loop's own source. Where both could act, the distributed scheme has precedence and the ADMS scheme is inhibited for a defined interval.
Recloser and sectionalizer placement was optimized in the Milsoft reliability model, evaluating candidate locations for marginal reduction in customer-minutes subject to access, coordination and communications constraints. Returns diminished sharply beyond three switching devices per feeder — the fourth on a typical circuit returned less than a quarter of the benefit of the second — so the programme was sized accordingly rather than to a uniform rule.
Fuse philosophy was decided feeder by feeder. Fuse saving trips the recloser before a lateral fuse melts, clearing transient lateral faults without a sustained outage but giving every customer on the feeder a momentary interruption; fuse blowing confines the interruption to the faulted lateral at the cost of a sustained outage for every transient lateral fault. On the twelve feeders serving dense load with high electronics and inverter density, fuse blowing was adopted because momentaries were generating complaints and process disturbances. On four long circuits with heavy tree exposure and predominantly transient faults, fuse saving was retained.
6.3 Communications and telemetry
Field devices communicate by DNP3 over a private network: a fibre backbone between the substation, the two satellite unit substations and four aggregation points, with licensed radio serving pole-mounted devices from those points. Latency was specified explicitly because FLISR performance depends on it — 200 ms round-trip for peer-to-peer messaging within a loop, 2 s for SCADA polling, and unsolicited reporting for status and fault indication so events are not delayed by a polling cycle. Measured availability in the first operating year was 99.74 percent against a 99.5 percent requirement.
Every recloser and switch reports position, load current, fault current magnitude and direction, and voltage on both sides. The last item was added after design review and proved decisive: without both-side voltage, restoration logic cannot distinguish a de-energized section from an open switch on an energized section, and several initial FLISR test failures traced to exactly that ambiguity.
7. Primary Plant, Insulation Coordination and Physical Design
The three 115/13.8 kV transformers are 30/40 MVA ONAN/ONAF, delta-wye, 12.0 percent impedance on the ONAN base, with a 32-step ±10 percent load tap changer on the high-voltage winding. Vacuum-type tap changers were specified in preference to oil-immersed diverter designs because the net-load ramp analysis projected tap operations rising toward 28,000 per year, a duty at which oil-type contact and oil maintenance intervals become an operating burden. Sound level was a specified performance requirement: 68 dBA at 2 m under ONAN conditions with staged fan control, and a 4.5 m acoustic barrier wall on two boundaries brings the calculated night-time property-line level to 59 dBA against the 62 dBA criterion.
Insulation Coordination Summary
| System | BIL | Arrester rating / MCOV | Protective margin |
|---|---|---|---|
| 115 kV | 550 kV | 98 kV / 76 kV | 83 percent |
| 34.5 kV | 200 kV | 36 kV / 29 kV | 69 percent |
| 13.8 kV switchgear | 95 kV | 10 kV / 8.4 kV | 188 percent |
The 34.5 kV arrester rating deserves comment. On a solidly grounded 34.5 kV system a 27 kV arrester would be conventional, but this tier is low-resistance grounded, so the coefficient of grounding is higher and sustained phase-to-ground voltage on the unfaulted phases during a ground fault approaches line-to-line. A 36 kV rated arrester with 29 kV MCOV withstands that condition for the duration of a fault plus reclose sequence, and the resulting 69 percent margin remains comfortably above the 20 percent generally accepted as a minimum.
Grounding was designed to IEEE Std 80 using the two-layer soil model. Low upper-layer resistivity made grid resistance easy to achieve at 0.21 Ω, but the calculated ground potential rise of 4,150 V is an order of magnitude above the 300 V rms threshold conventionally taken to define the power influence zone under IEEE Std 487 and IEEE Std 367 practice, so the station lies well inside the zone of influence and isolation of metallic telecommunication circuits is required rather than optional. The design accordingly specified fibre-optic isolation for all protection signalling and teleprotection paths, isolating or neutralizing transformers with high-dielectric isolation for the few metallic pairs retained for legacy service circuits, and isolating joints on incoming metallic services. Touch and step voltages are within limits with a 100 mm crushed-rock surface layer inside the fence. Because the station sits in an urban block with third-party metallic infrastructure nearby, transfer potential onto water and telecommunications services was assessed separately and the isolating joints extended to two further service entries.
The switchgear building is two storeys, with switchgear at ground level, a cable basement below and control, protection and communications rooms above, which suits a constrained urban footprint and keeps cable runs short. Arc-resistant switchgear to IEEE Std C37.20.7 was specified with plenum exhaust ducted above the roofline. Transformers sit outdoors with two-hour rated firewalls at the separation dictated by NFPA 850, and containment sized for 110 percent of the largest unit's oil volume plus a rainfall allowance, discharging through an oil-water separator.
8. Auxiliary Systems
Station DC is 125 V nominal from a 60-cell flooded lead-acid battery. Sizing to IEEE Std 485 for the eight-hour duty cycle — continuous loads, one-minute inrush at the start, and a final-minute trip and close duty for the full complement of breakers — gave a calculated requirement of 312 Ah.
Battery Sizing Summary
| Parameter | Value |
|---|---|
| System voltage / cells | 125 V nominal, 60 cells, flooded lead-acid |
| Duty cycle | 8 hours, with first-minute and final-minute duties |
| Calculated capacity | 312 Ah |
| Applied factors | Aging 1.25, temperature 1.04, margin 1.10 |
| Selected capacity | 500 Ah, two 100 percent chargers |
A separate 48 V DC system with four-hour autonomy serves the communications equipment, deliberately independent of the 125 V system so a protection DC fault does not blind the utility to the state of the network at the moment it most needs visibility.
Station service comes from two 500 kVA 13.8/0.48 kV transformers, one from each of two 15 kV bus sections, with automatic transfer. A 350 kW standby generator with 72 hours of fuel was added at the Client's request; in a conventional distribution substation that would be hard to justify, but here the station hosts the fibre aggregation for the distribution automation network and the ADMS field interface, and the self-healing scheme's value during a wide-area event depends on that equipment staying alive.
Fire detection uses aspirating smoke detection in the switchgear, relay and communications rooms, with clean-agent suppression in the relay and communications rooms only. The switchgear hall relies on detection and manual intervention, on the reasoning that arc-resistant switchgear vents its own energy and that inadvertent discharge poses more risk to service continuity than the residual fire risk. Security includes a solid architectural screen wall on the two public street frontages, driven as much by planning consent as by security, with intrusion detection and camera coverage integrated into existing monitoring.
9. Construction, Commissioning and Energization Support
The station carried load throughout, and that single constraint shaped the delivery sequence, which ran from Month 0 to Month 31 with Keentel providing design authority, technical query resolution, FAT witnessing and commissioning oversight.
A 20 MVA mobile substation was connected at Month 9 and carried part of the load while the first existing transformer and its switchgear were removed. Work was sequenced so no stage reduced available capacity below the seasonal load requirement, and no capacity-reducing stage was permitted during the peak-season restriction period. The new 15 kV switchgear building was constructed on the adjacent parcel first, allowing the twenty feeder positions to be built, tested and energized before any existing feeder was disturbed.
Feeder cutovers were the highest-risk activity. Twenty circuits were transferred over fourteen weekend windows, each with an approved switching programme, a defined abort point and a tested fallback, and each preceded by a CYME contingency run confirming the network could survive a single credible failure mid-cutover. Two windows were aborted on weather grounds and rescheduled without incident.
Panel FAT was run end to end with secondary injection driven by the PSCAD-derived inrush waveforms, demonstrating cross-blocked differential stability before shipment and identifying one current transformer polarity error and three settings errors. Site testing covered zone-by-zone primary injection, functional proving of every trip and interlock path, and point-to-point verification of 3,140 SCADA points. Energization followed a defined sequence: 115 kV ring bus first with a 24-hour observation period, then each transformer on no load, then bus sections and feeders progressively. Measured inrush first peak was 7.6 times rated against the modelled 8.2, validating the PSCAD model within 8 percent. Capacitor banks were commissioned after load history confirmed the reactive requirement, and CVR and volt-var optimization only after a full season of baseline data.
Self-healing validation was the last activity and the most instructive. Forty-four staged fault scenarios were executed across the six loops, with faults applied through a test set and the full isolation and restoration sequence timed. Forty-one succeeded first time. The three failures traced to switch position telemetry — one reversed contact, one intermittent auxiliary switch and one DNP3 point map error — and none to the restoration logic. That distribution of causes is consistent with wider experience: FLISR schemes usually fail on data quality, not on algorithms.
10. Results and Value Delivered
| Metric | Before | After | Change |
|---|---|---|---|
| Firm N-1 capacity | 26.6 MVA | 80 MVA | +201 percent |
| Horizon-year forecast peak served | 34 MW actual | 61 MW capable | Full horizon |
| SAIFI | 1.42 /customer-yr | 0.71 /customer-yr | -50 percent |
| SAIDI | 118 min/customer-yr | 54 min/customer-yr | -54 percent |
| CAIDI | 83.1 min | 76.1 min | -8 percent |
| MAIFI | 4.1 events/customer-yr | 4.6 events/customer-yr | +12 percent |
| Worst feeder-end voltage at peak | 0.923 pu | 0.968 pu | +4.5 points |
| Technical losses | 4.6 percent | 3.1 percent | -3,400 MWh/yr |
| CVR energy saving | None | 3,600 MWh/yr | 0.75 MW at peak |
| DER hosting capacity, aggregate | 11.2 MW | 31.6 MW | +182 percent |
| Capital against greenfield alternative | 100 percent baseline | 46 percent | 54 percent avoided |
Reliability indices were computed to IEEE Std 1366 with major event days excluded by the 2.5 beta method. Five years of daily SAIDI values were log-transformed, giving a mean of -3.09 and a standard deviation of 1.24, and the threshold exp(α + 2.5β) evaluated to 1.01 minutes per day. Six days exceeded it and were excluded from both baseline and post-project figures, so the comparison is like for like; an unadjusted improvement would have been indefensible, since a single severe storm in either window would have dominated the result.
The gain decomposes approximately as follows: 44 percent from FLISR isolating and restoring unfaulted sections automatically, 31 percent from shorter feeders with fewer customers exposed to each fault, 17 percent from the fuse philosophy change and improved coordination, and 8 percent from reduced equipment failures following load relief on overloaded assets.
MAIFI increased, and that was expected. Adding 34 reclosers necessarily produces more momentary events, since faults that previously caused a sustained outage now cause an operation that is momentary for most customers. The trade — 0.5 additional momentary events for 64 fewer outage minutes — is favourable for most customers but not all, and the sensitive-load customers in the data-adjacent cluster were engaged directly about ride-through and on-site mitigation. The commercial outcome the Client values most is the deferred station: the reinforcement cost approximately 46 percent of the greenfield alternative, avoided a contested site acquisition, and pushed the next site requirement beyond the fifteen-year horizon.
11. Challenges and Engineering Lessons Learned
The forecast, not the equipment, was the deliverable. Every difficult decision — three transformers rather than two, the 35 kV tier, the staging trigger, the tap changer duty specification — traced back to a line in the spatial forecast. Had the forecast been a trend extrapolation, the station would have been sized for the wrong peak in the wrong season and the satellite substations sited where growth was not.
Seasonal peak crossover changes which constraint binds. The transition from summer to winter peaking moved the binding constraint from transformer thermal capacity to feeder-end voltage, because the winter evening peak occurs with no solar contribution and with electric heating load at its most voltage-sensitive. Any network undergoing heating electrification should test both seasons independently before sizing anything.
Higher transformer impedance bought more than it cost. Specifying 12 percent rather than 9 percent kept the 15 kV switchgear at 25 kA and preserved compatibility with the utility's existing cable and termination standards network-wide, and the regulation penalty was recovered by tap changer range and feeder voltage control. Price fault duty into the transformer specification rather than treating impedance as a purely economic parameter.
Distribution automation fails on data, not on logic. All three self-healing test failures were telemetry problems: a reversed contact, an intermittent auxiliary switch, a DNP3 point map error. The restoration algorithms performed as designed in every case. FLISR commissioning effort should be weighted heavily toward point-by-point verification of device status, and both-side voltage indication treated as mandatory rather than optional.
Measure the CVR factor, do not assume it. The planning assumption of 0.65 understated the measured 0.72 by 11 percent, which materially changed the benefit case. More importantly, the alternating on-off protocol produced a result the Client could defend to its regulator. A claimed CVR benefit without a measurement protocol behind it is not a benefit anyone will pay for.
Momentary interruptions are a real cost of a reliability programme. MAIFI rose by 12 percent and the affected customers were the least tolerant of momentary events. The engineering answer was a feeder-by-feeder fuse philosophy rather than a network-wide rule, but the wider lesson is that a reliability programme should forecast its MAIFI impact and engage sensitive customers before commissioning, not after the first complaint.
12. Keentel Capability Summary
This project exercised the following Keentel services:
- Small-area spatial load forecasting with land-use and end-use calibration
- Weather normalization and degree-day regression for peak demand
- EV adoption, charging-behaviour and coincidence modelling; behind-the-meter solar net-load assessment
- Deterministic and probabilistic distribution planning, including Monte Carlo staging analysis
- Distribution power flow, load allocation and feeder modelling in CYME and Milsoft
- Contingency load transfer analysis and feeder reconfiguration programme design
- Conservation voltage reduction design, commissioning and measurement protocol
- Volt-var optimization, optimal capacitor placement and phase balancing
- Loss evaluation and reconductoring economic assessment
- Reliability simulation, IEEE Std 1366 index computation and major event day classification
- FLISR architecture, recloser placement optimization and self-healing validation
- DNP3 distribution automation communications architecture and latency specification
- DER hosting capacity analysis and smart-inverter settings policy development
- Short-circuit, insulation coordination and arc-flash studies to IEEE Std 1584
- Protection philosophy, ANSI function schedules and coordination settings
- PSCAD/EMTDC transient studies for capacitor switching, ferroresonance and transformer inrush
- Substation grounding to IEEE Std 80 and auxiliary design to IEEE Std 485
- Procurement specification, FAT witnessing, cutover planning and energization support
13. Frequently Asked Questions
Feeder length is the constraint. Adding 15 kV feeders from a single station means every circuit starts at the same point and must reach growth areas several kilometres away, which costs voltage, costs losses and puts thousands of customers behind a long exposure. A 34.5 kV loop moves bulk power at two and a half times the voltage — roughly one-sixth the losses for the same power — and lands it at satellite unit substations inside the growth pockets, so the feeders that serve customers start short and stay short. The satellites occupied small parcels the utility already owned and needed no transmission-voltage permitting. Here the tier was the difference between deferring a new station site and acquiring one.
You start with what exists publicly and calibrate it against the utility's own measurements. Zoning maps, published redevelopment plans and building permit records give the land-use trajectory; billing and AMI data allocated to distribution transformers give current demand per analysis cell. The critical step is calibration: find cells that have already undergone the transition you are forecasting elsewhere, measure their actual demand density in watts per square metre, and use those figures rather than generic tables. On this project calibration moved the mixed-use commercial density about 22 percent below the textbook value, because the redevelopments were substantially LED-lit and heat-pump conditioned. Without it, the forecast would have overbuilt.
The CVR factor is the ratio of percentage demand reduction to percentage voltage reduction: 0.72 means lowering voltage by 1 percent reduces demand by 0.72 percent. It cannot be calculated reliably from first principles, because it depends on the mix of constant-impedance, constant-current and constant-power load on that particular feeder, and that mix changes with season and time of day. The credible method is measurement by alternating operation — run the feeder with CVR enabled one week and disabled the next, over a full season, logging load, voltage and weather at fifteen-minute resolution, then regress the demand difference against the voltage difference after normalizing for weather and day type. That protocol produces a result defensible to a regulator.
Both, in most cases. Distributed peer-to-peer logic between adjacent reclosers restores unfaulted sections in 30 to 45 seconds and keeps working when the path to the control centre fails, but it decides against pre-configured limits and handles multi-feeder or multi-source transfers poorly. Centralized ADMS-based FLISR runs a real-time power flow before transferring load, coordinates across the network and is far easier to maintain as the network changes, but it is slower and depends on the full communications path. The practical architecture is distributed logic on primary loops for speed, with the central scheme handling complex cases and inhibited for a defined interval where both could act.
The method is iterative: add generation at each node in increments and record the injection at which the first technical criterion is violated — typically steady-state overvoltage above 1.05 pu, thermal loading, a voltage step exceeding 3 percent for a change in output, or a defined loss of protection reach or sensitivity. The answer changes because it is a property of the network state, not of the feeder: it depends on the load level assumed, the location of existing generation, the voltage regulator and capacitor settings, and the protection settings in force. That is why the deliverable here was not a number but a documented, repeatable method the utility can rerun, together with the model to run it in.
Two mechanisms, neither requiring large fault current. The first is desensitization: generation between the substation and a fault supplies part of the fault current, so the station relay sees less than it otherwise would and its reach and operating time degrade — a high-impedance fault that was marginally detectable can become undetectable. The second is sympathetic tripping: generation on a healthy feeder contributes through the station bus to a fault on an adjacent feeder, and a non-directional ground element on the healthy feeder can operate. Inverter contribution is limited to roughly 1.2 times rated current, but 1.2 times a large aggregate rating is enough for both effects. Directional supervision and settings re-derivation at forecast penetration address them.
They answer different questions and good practice uses both. Deterministic N-1 is a clear, auditable standard that defines the right end-state and is easy to defend. Its weakness is that it is binary — it tells you that you are in violation but not how much risk the violation carries — which makes it a poor tool for deciding when to spend. A probabilistic assessment quantifies expected unserved energy and the probability of a shed event for each staging option, which is exactly what is needed to decide whether a transformer can wait six years. Here the deterministic rule set the end-state and the probabilistic work set the schedule, deferring 26 percent of capital timing without meaningful added risk.
It classifies major event days so that reliability indices reflect normal operating performance rather than the worst storm in the reporting period. The method takes daily SAIDI values over five years, discards zero days, takes the natural logarithm of the remainder, computes the mean α and standard deviation β, and sets the threshold at exp(α + 2.5β). Days above the threshold are excluded and reported separately. On this project the threshold evaluated to 1.01 minutes per day and six days were excluded from both windows. It matters because without exclusion a single severe storm in either the baseline or the post-project period would swamp the comparison, making any claimed improvement an artefact of weather rather than of engineering.
By comparing installed cost against the present value of the losses avoided, not against the thermal rating. The loss saving is computed from the current squared through the section, converted to annual energy using a loss factor derived from the load factor — here LsF = 0.15 LF + 0.85 LF², giving 0.37 — and valued with separate demand and energy components over an evaluation period at the utility's discount rate. On this project only three of eleven candidate sections cleared that test. For the other eight, the contingency capacity the upgrade would have provided was obtained far more cheaply by building a feeder tie, which is the alternative a purely thermal assessment never surfaces.
For independent verification of the two things most likely to be wrong. Load allocation and reliability simulation both depend heavily on data quality and modelling convention, and a single tool with a single set of assumptions gives no way to detect a systematic error. Building the load allocation independently in each platform — one weighted by billed energy at distribution transformers, the other from the consumer database — produced agreement within 4.1 percent at feeder level, which gave real confidence in the base model. Beyond verification, each tool was used where it is strongest: CYME for unbalanced power flow, optimal capacitor placement and hosting capacity, Milsoft for predictive reliability and device placement optimization.
Design and study work ran roughly nine months, and delivery to full commissioning about thirty-one months from project start. Three things drive duration on an in-place urban rebuild. First, the station stays in service, so every stage needs a switching plan, a contingency check and an outage window, and no capacity-reducing work is permitted in the peak season. Second, feeder cutovers proceed only at the rate safe weekend windows allow — twenty circuits took fourteen windows. Third, transformer lead times typically exceed a year and must be committed before studies close, which is why the design basis carries deliberate margin. The forecasting and planning phase is short by comparison but must complete first, because it determines everything else.
Yes. The voltage levels and the specific standards cited are local conventions; the method is not. Spatial forecasting, coincidence and diversity analysis, contingency transfer criteria, loss and reconductoring economics, CVR measurement, reliability index computation and hosting capacity assessment are all voltage-agnostic and translate directly between IEEE and IEC practice. What changes is the regulatory framing — permitted voltage ranges, the reliability indices a regulator recognizes, whether CVR benefits are recoverable — and the availability and quality of billing, AMI and outage records. Keentel's normal first step on a new network is a data readiness assessment, because the forecast and the reliability work are only as good as the records they are built from.
14. Glossary of Terms and Abbreviations
| Term | Definition |
|---|---|
| ADMS | Advanced distribution management system, the control platform hosting VVO and central FLISR |
| AMI | Advanced metering infrastructure, interval metering with two-way communication |
| ANSI C84.1 Range A / B | Normal and limited-duration acceptable service voltage ranges |
| CAIDI | Customer average interruption duration index, equal to SAIDI divided by SAIFI |
| Coincidence factor | Ratio of a group's coincident peak to the sum of individual non-coincident peaks |
| CVR | Conservation voltage reduction, lowering delivered voltage to reduce demand and energy |
| CVR factor | Percentage demand reduction per percentage voltage reduction |
| DER | Distributed energy resource, generation or storage connected at distribution voltage |
| DNP3 | Distributed Network Protocol version 3, standardized as IEEE Std 1815 |
| Duck curve | Net-load shape produced by midday solar output, with a steep evening ramp |
| Diversity factor | Sum of non-coincident peaks divided by coincident peak, the reciprocal of coincidence |
| FLISR | Fault location, isolation and service restoration, automated network reconfiguration |
| Fuse saving / fuse blowing | Reclosing philosophies that trip before, or allow, lateral fuse operation |
| Hosting capacity | Maximum DER connectable at a location without violating a defined technical limit |
| LDC | Line drop compensation, inferring remote voltage from measured current and assumed impedance |
| Load factor / loss factor | Average demand over peak demand; average losses over peak losses, estimated from load factor |
| LTC | Load tap changer, adjusting transformer ratio without interrupting load |
| MAIFI | Momentary average interruption frequency index |
| MED / 2.5 beta | Major event day and the IEEE Std 1366 log-normal threshold method for excluding it |
| NGR | Neutral grounding resistor, limiting ground fault current on a wye winding |
| ONAN / ONAF | Oil natural air natural / oil natural air forced transformer cooling classes |
| Reverse power flow | Power flowing from the distribution network toward the source, typically DER-driven |
| SAIDI / SAIFI | System average interruption duration index / frequency index |
| Sympathetic tripping | Operation of protection on a healthy feeder due to contribution to an adjacent fault |
| VVO | Volt-var optimization, coordinated control of regulators and capacitors to a defined objective |
15. Confidentiality and Use Statement
This case study has been prepared for informational purposes. All client identities, project locations, contract details, and proprietary data have been withheld or generalized. Technical parameters, study results, and figures presented are representative of work performed by Keentel Engineering Solutions and have been adapted so that no individual project, owner, or facility can be identified. Nothing in this document constitutes a design recommendation for any specific installation. Any reuse of the methodologies described requires project-specific engineering analysis by a qualified professional engineer.