A Coordinated Electric System Interconnection Review—the utility’s deep-dive on technical and cost impacts of your project.
Challenge: Frequent false tripping using conventional electromechanical relays
Solution: SEL-487E integration with multi-terminal differential protection and dynamic inrush restraint
Result: 90% reduction in false trips, saving over $250,000 in downtime
The three operating regions you have to design to
| Device | Output vs voltage | Response | Best suited to | Main limitations |
|---|---|---|---|---|
| Mechanically switched capacitor or reactor | Proportional to voltage squared | Seconds; discrete steps; limited switching operations per day | Steady-state reactive supply, voltage profile, loss reduction | No dynamic capability; step voltage change on switching; capability collapses when most needed |
| Static var compensator | Capacitive branches proportional to voltage squared | A few cycles; continuously controllable | Continuous control where cost matters and deep voltage support is not the driver | Square-law capability loss; harmonic filters are part of the plant and interact with the network |
| STATCOM | Approximately proportional to voltage — constant current capability | One to two cycles closed loop; converter response faster still | Voltage stability margin, weak interconnections, fast disturbance recovery, flicker and unbalance compensation | Higher capital cost; converter losses; adds a converter and its control dynamics to the network |
| Synchronous condenser | Governed by machine capability and excitation | Excitation response in the hundreds of milliseconds; inherent inertial response instantaneous | System strength and inertia, short-circuit contribution, black start support | Rotating plant with maintenance and losses; slower controlled response than a converter |
| STATCOM with energy storage | Reactive as a STATCOM, plus real power within the storage rating | As STATCOM for reactive; real power limited by storage | Where a real power deficiency is part of the problem | Cost and complexity of the storage; different failure and maintenance profile |
| Stage | Keentel scope | Outcome |
|---|---|---|
| Screening | Series-compensation proximity, radial contingency review, UIF and short-circuit ratio screening, frequency scans | Early identification of which SSO types apply |
| Detailed studies | PSCAD/EMTDC EMT studies with vendor real-code models, impedance-based and frequency-scan analysis | Clear evidence of stability margins or risk |
| Model quality | EMT model review, benchmarking against positive-sequence models, model acceptance support | Models that system operators accept |
| Mitigation | Control retuning recommendations with vendors, SSDC and bypass logic requirements, protection and monitoring specifications | Practical, coordinated solutions |
| Interconnection support | SSR and SSO study reports for ISO and utility requirements, response to reviewer comments | Fewer delays in the interconnection process |
Resilience: designing CDUs to the facility Tier objective
Liquid cooling makes heat removal more critical, not less. Cold plates hold only seconds of thermal buffer. If TCS flow stops, processors throttle or shut down very quickly. Resilience design must therefore cover:
- Pump redundancy: N+1 pumps at minimum, with automatic changeover.
- CDU redundancy: N+1 CDUs on a common TCS header, or 2N CDUs serving A and B manifolds for fault-tolerant designs.
- Power to CDUs: dual-corded CDUs fed from A and B sources, with pumps and controls on UPS power so coolant keeps flowing through a utility failure and generator start. This is the liquid-cooling equivalent of continuous cooling.
- Facility water continuity: chilled water or condenser water must also continue, through thermal storage, UPS-backed pumps or a high enough FWS temperature that the TCS can coast on stored thermal mass for the transfer period.
- Concurrent maintainability: isolation valves so any CDU, pump, filter or manifold section can be serviced without stopping the others.
- Leak management: leak detection, drip trays, automatic isolation valves and procedures for fluid spills.
Electrical engineering considerations
CDUs and liquid-cooling plants are electrical loads with their own design requirements:
- Pump motors and VFDs. Large CDUs use variable-frequency drives on their pump motors. These introduce harmonic current that must be included in the facility's harmonic study and IEEE 519 evaluation.
- Critical mechanical load on UPS. Putting CDU pumps on UPS increases UPS and battery sizing. The mechanical UPS load must be included in redundancy and ride-through calculations.
- Feeder and protection design. Dual feeds, automatic transfer, selective coordination and arc-flash labelling apply to CDU power distribution just as they do to IT power.
- Generator transient response. CDU pumps restarting together after a transfer create motor inrush on the generators. Staged restarts and soft acceleration reduce the step load.
- Load dynamics. AI training loads can swing rapidly between high and low power. Cooling controls must track those swings without temperature overshoot, and electrical systems must handle both the IT and the cooling load changes.
Commissioning a liquid-cooled data hall
- Flush and clean the TCS piping and manifolds to the specified cleanliness, using high-purity flush water.
- Fill and vent with the specified coolant, verifying glycol concentration and chemistry.
- Pressure test for leaks at design and test pressures, including quick-disconnect fittings.
- Verify sensors and controls: flow meters, temperature sensors, pressure transmitters, leak detection and BMS points.
- Load test with heat load banks connected through the cold-plate interfaces or rack manifolds, across the operating range.
- Prove the heat balance on both loops at several load steps, and the approach temperature against the design.
- Test failure scenarios: pump failure, CDU failure, power transfer to generator, valve failure and loss of facility water, confirming temperatures stay within the IT vendor's limits.
How Keentel Engineering helps
Keentel Engineering supports data center owners, developers and EPCs with the electrical engineering that liquid-cooled facilities depend on, and coordinates with the mechanical engineer of record and cooling vendors on the integrated design.
PRC-028-1 Disturbance Monitoring: Requirements, Recording & IBR Compliance
October 27, 2026 | Blog
Part A — PRC-028-1 at a Glance
When a 230 kV line fault 200 miles away causes a solar plant to drop 150 MW, three engineering questions follow at once:
- What did the plant actually do, and when?
- Which inverters, feeders or controls caused the loss?
- Can the owner prove it — with synchronized, high-resolution data — within days, not months?
For most of the last decade, the honest answer at many inverter-based resource (IBR) sites was "we don't know." Event investigators repeatedly found that plants had no fault recordings, low-resolution SCADA data, inverter logs with unsynchronized clocks, and fault codes that were overwritten before anyone asked for them.
NERC Reliability Standard PRC-028-1, Disturbance Monitoring and Reporting Requirements for Inverter-Based Resources, closes that gap. It requires Generator Owners (GOs) of applicable IBRs to record three kinds of data, synchronize it to UTC, keep it retrievable, provide it quickly on request, and restore failed recording capability on a fixed clock.
The standard on one page
| Requirement | What it requires | Key numbers |
|---|---|---|
| R1 — Sequence of events recording (SER) | Breaker status for the main power transformer (MPT), collector buses and feeders, shunt reactive devices and dedicated VSC-HVDC converters; IBR unit fault codes, alarms and ride-through mode status | Unit-level SER mandatory for new units; for existing units only if the unit is capable |
| R2 — Fault recording (FR) quantities | Phase-to-neutral voltages, phase and residual currents, real and reactive power at the MPT high side and collector feeders; reactive power at shunt dynamic reactive devices | Quantities may be measured or determined |
| R3 — FR performance | Pre-trigger, record length, sample rate and triggers | ≥ 2 cycles pre-trigger; ≥ 2.0 s total; ≥ 64 samples/cycle; residual overcurrent, phase over/undervoltage and over/underfrequency triggers |
| R4 — Dynamic disturbance recording (DDR) quantities | Continuous recording at each MPT: one voltage, the matching current, three-phase P and Q, and frequency | One frequency measurement per site is acceptable |
| R5 — DDR performance | Input sampling and output recording rates | ≥ 960 samples/s input; ≥ 60 records/s output |
| R6 — Time synchronization | All SER, FR and DDR data synchronized to UTC | Plant devices ±1 ms; IBR units ±100 ms |
| R7 — Data retention and provision | Retrievability, response time and file formats | Retrievable 20 calendar days; provided within 15 calendar days of a request; CSV/COMTRADE; COMNAME file names |
| R8 — Recording failures | Restore capability, or submit a Corrective Action Plan (CAP) | 90 calendar days from discovery |
Key dates
| Category | Requirements | Compliance date |
|---|---|---|
| Standard effective date | — | April 1, 2025 |
| Existing BES IBRs | R1–R7 | 50% within three calendar years of the effective date; 100% by January 1, 2030 |
| Generator Owner with only one BES IBR | R1–R7 | 100% within three calendar years of the effective date |
| New BES IBRs | R1–R7 | Later of July 1, 2026 or the commercial operation date |
| All BES IBRs | R8 | January 1, 2026 |
| Existing non-BES IBRs (in service on or before May 15, 2026) | R1–R7 | 100% by January 1, 2030 |
| New non-BES IBRs | R1–R7 | Later of 15 months after the effective date or the commercial operation date |
| All non-BES IBRs | R8 | April 1, 2027 |
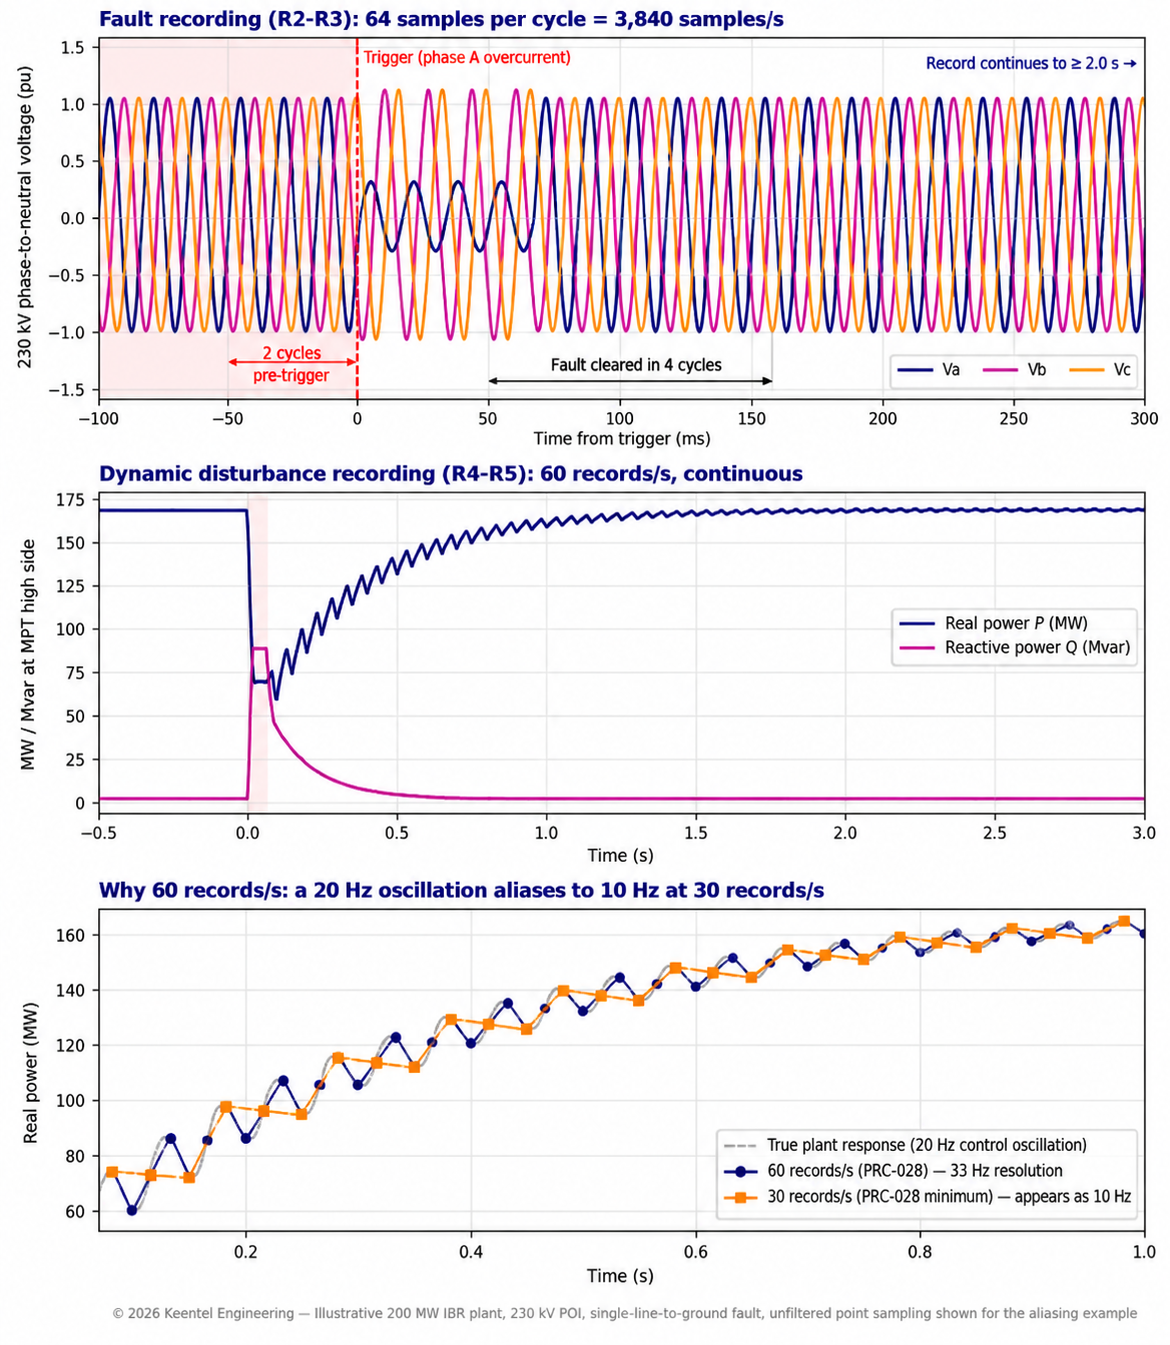
Figure 1. Keentel Engineering's illustration of PRC-028-1 data at a 230 kV point of interconnection during a cleared single-line-to-ground fault. Top: fault recording at 64 samples per cycle with the 2-cycle pre-trigger and 2.0 s minimum record marked. Middle: dynamic disturbance recording of real and reactive power at 60 records per second. Bottom: a 20 Hz plant control oscillation sampled at 60 records per second (resolved) and at 30 records per second (misread as 10 Hz).
Five lessons
- PRC-028-1 is an engineering standard, not a paperwork standard. Compliance is proven by recorder settings, channel lists, trigger logic, clock architecture and retrieved files — not by a procedure alone.
- Existing PRC-002 equipment is a starting point, not the answer. PRC-028 adds collector feeder FR, a 2.0 s record, 60 records/s DDR and IBR unit-level SER that most legacy installations do not provide.
- Fifteen days is the real deadline. The 20-day figure is how long data must remain retrievable; the response deadline is 15 calendar days from the request.
- Time synchronization decides whether data is usable. A 1 ms error is 21.6° of phase at 60 Hz. Unsynchronized inverter logs are the most common reason event timelines cannot be reconstructed.
- Design once for the whole Order No. 901 roadmap. The same data feeds ride-through evaluation under PRC-029-1, event analysis under PRC-030-1 and model validation. A minimum-compliance design often fails the analyses that follow.
Engineering review of the original draft
Keentel Engineering reviewed the earlier version of this guide and the common industry statements it contained. The corrections below are carried into this edition.
| Statement | Keentel's check |
|---|---|
| "Plant level devices ±1 ms; IBR unit clocks ±100 ms" | Correct for PRC-028-1. Do not confuse with IEEE Std 2800-2022, which specifies ±1 µs at plant level and ±100 µs at unit level for new resources where an interconnection agreement adopts it. The two documents differ by a factor of 1,000. |
| "Data requested on Day 6 must be provided within 20 calendar days" (example in supporting documents) | Conflates two clocks. Part 7.1 sets 20 days of retrievability; Part 7.2 sets a 15 day response deadline. Build procedures around 15 days. |
| "DDR at 60 records per second is a step up from PRC-002" | Correct. PRC-002 DDR requires an output rate of at least 30 records/s; PRC-028 doubles it, raising the observable oscillation range from 15 Hz to 30 Hz. |
| "Phase in: 50% within three calendar years" | The Implementation Plan does not define the 50% basis (count or capacity), and "three calendar years" has been read as April 1, 2028 or January 1, 2029. Plan to the earlier date and document the basis. |
| "BES generation: units above 20 MVA or plants above 75 MVA" | Correct in substance. The BES definition applies these thresholds to resources connected at 100 kV or above; the new non-BES IBR category captures ≥ 20 MVA aggregate at a common point of 60 kV or above. |
| "Penalties can exceed $1 million per violation per day" | Correct. FERC adjusts the maximum for inflation each year; actual penalties follow the NERC Sanction Guidelines and depend on risk, history and internal controls. |
| "Collector feeder residual overcurrent trigger 'if applicable'" | The standard does not define applicability. Document the collector grounding design and any alternative ground fault trigger used. |
Part B — PRC-028-1 Disturbance Monitoring for Inverter-Based Resources: An Engineering Guide From Requirement to Recorder Settings
1. Why IBR disturbance monitoring became mandatory
1.1 What event analysis kept finding
Between 2016 and 2023, NERC and the Regional Entities published a series of disturbance reports on large losses of solar and wind output during normally cleared transmission faults. The recurring causes were well known by the end of the series:
- Inverter phase-locked loop (PLL) loss of synchronism during phase jumps.
- Instantaneous AC overvoltage and DC overvoltage trips.
- Momentary cessation, with slow or incomplete recovery.
- Plant controller interactions that held output down after the fault.
- Feeder and collector protection that tripped on transient conditions.
- Frequency measurement errors that tripped inverters on false over- or underfrequency.
The reports also kept repeating one complaint: many plants could not explain what had happened because the data did not exist. SCADA at 2–4 s resolution cannot see a 50 ms event. Inverter logs had clocks drifting by seconds or minutes. Fault codes were overwritten. Several sites had no fault recorder at all because PRC-002 had not required one at their location.
1.2 From FERC Order No. 901 to PRC-028-1
FERC Order No. 901 (October 2023) directed NERC to develop IBR standards in four areas: disturbance monitoring, ride-through performance, analysis and mitigation of performance issues, and data sharing and model validation. NERC filed the first milestone in late 2024. FERC approved PRC-028-1 together with the IBR glossary definitions, PRC-002-5 and PRC-030-1 on February 20, 2025. PRC-028-1 became effective on April 1, 2025, with phased compliance dates running to January 1, 2030.
PRC-002-5 now excludes IBRs, which are covered by PRC-028-1. A transmission bus that meets PRC-002 criteria stays under PRC-002; the IBR plant at the other end of the line falls under PRC-028.
1.3 How the IBR standards depend on each other
| Standard | What it needs from PRC-028 data |
|---|---|
| PRC-029-1 — IBR ride-through | Proof that the plant stayed connected and responded as required during voltage and frequency excursions |
| PRC-030-1 — Unexpected IBR event mitigation | Root cause of output changes of at least 20 MW and 10% of nameplate; unit-level fault codes and ride-through status |
| MOD-026 / IBR model validation | Recorded MPT voltage, current, P, Q and frequency to benchmark positive-sequence and EMT models |
| PRC-004 — Protection misoperations | Feeder and MPT fault records to separate correct operations from misoperations |
| EOP-004 — Event reporting | Timely, defensible facts for reportable events |
A recording system designed only to tick the PRC-028 boxes often turns out to be inadequate for the PRC-030 analysis that follows the first significant event.
2. Applicability: which plants and which owners
2.1 Functional entity
PRC-028-1 applies to Generator Owners. Earlier drafts also listed Transmission Owners; the approved standard does not. Where a Transmission Owner owns the interconnection substation breakers, the GO must still obtain the required data, which usually means a written data-sharing agreement.
2.2 Facilities
The standard covers:
- BES IBRs — generally, IBR plants of more than 75 MVA aggregate connected through a system designed primarily to deliver that capacity to a common point at 100 kV or above.
- Non-BES IBRs — IBRs that have, or contribute to, an aggregate nameplate capacity of at least 20 MVA, connected through a system designed primarily for delivering that capacity to a common point of connection at 60 kV or above. Owners of these resources were to register as GOs and Generator Operators (GOPs) by May 2026 under NERC's revised Rules of Procedure.
2.3 Worked example: applicability screening
| Plant | Capacity | Common point voltage | Category |
|---|---|---|---|
| Solar A | 300 MW / 330 MVA | 345 kV | BES IBR |
| Solar + BESS B | 150 MW PV + 100 MW BESS | 230 kV | BES IBR (aggregate > 75 MVA) |
| Wind C | 40 MW | 69 kV | Non-BES IBR (≥ 20 MVA, ≥ 60 kV) |
| Solar D | 60 MW | 34.5 kV, utility distribution | Outside PRC-028 (≤ 60 kV) |
| BESS E | 18 MW | 115 kV | Outside PRC-028 (< 20 MVA) |
| Solar F + BESS G, shared 69 kV tie | 15 MW + 10 MW | 69 kV common point | Non-BES IBR (contributes to 25 MVA aggregate) |
Plant F and G show why aggregation matters: neither qualifies alone, but together they exceed 20 MVA at a 69 kV common point. Screening must be repeated whenever capacity, configuration or the point of interconnection changes — for example, when storage is added to an existing solar site.
3. R1 — Sequence of events recording
3.1 Plant-level SER
The GO must have SER data for the position of circuit breakers (and, per the Technical Rationale, other interrupting devices such as circuit switchers) associated with:
- Each main power transformer.
- The collector bus and each collector feeder.
- Shunt static reactive devices (capacitor banks, reactors, harmonic filter banks) and shunt dynamic reactive devices (STATCOMs, SVCs, synchronous condensers).
- The AC-DC and DC-AC converters of a dedicated VSC-HVDC connection, where one exists.
SER is the backbone of the event timeline. In an analysis, the first question is usually "what opened, and in what order?" A breaker status change recorded with a 1 ms time stamp answers it directly.
3.2 IBR unit-level SER
R1 also requires, at the IBR unit level:
- All fault codes.
- All fault alarms.
- High- and low-voltage and frequency ride-through mode status.
These are recorded when triggered by ride-through operation or by tripping of the unit. The Technical Rationale states that entry into momentary cessation should also trigger recording.
For units placed in commercial operation after the effective date, unit-level SER is mandatory. For units already in service, it is required only if the unit is capable of recording it. Lack of capability must be supported by evidence: equipment specifications, a manufacturer's letter, or documentation of the attempt to obtain one. If the manufacturer no longer exists and capability cannot be determined, the Technical Rationale indicates that the data is not required, provided the owner keeps records of its efforts.
3.3 The firmware gray area
A common situation: the inverter hardware can log ride-through status, but only after a firmware update. Is the unit "capable"? The standard does not say. Keentel's recommended position is to document the manufacturer's statement, the cost and risk of the update (including any effect on PRC-029 ride-through performance and on the validated dynamic model), and the decision. If the update is applied, re-run the model validation and PRC-019 coordination screens, because firmware changes frequently alter controller behavior.
3.4 Worked example: SER point count
For a 200 MW solar + BESS plant with one MPT, a 34.5 kV collector bus, eight collector feeders (six PV, two BESS), one STATCOM and one 34.5 kV harmonic filter bank:
| Device | Breakers or interrupters | SER points (52a/52b and trip) |
|---|---|---|
| MPT high-side breaker (230 kV) | 1 | 3 |
| MPT low-side main breaker (34.5 kV) | 1 | 3 |
| Collector feeder breakers | 8 | 24 |
| STATCOM breaker | 1 | 3 |
| Filter bank breaker | 1 | 3 |
| Total plant SER | 12 | 36 |
Recording both "a" and "b" contacts allows the recorder to detect contact discrepancy (both open or both closed), a useful check on auxiliary-switch failure. At the unit level, the plant (120 MW PV and 80 MW BESS) has 36 PV inverters and 24 BESS power conversion systems of 3.6 MVA each — 60 units, each with its own fault-code stream. Unit-level SER is usually collected by the plant SCADA or the inverter manufacturer's data logger rather than by the plant recorder.
3.5 SER file format
SER data must be provided in the comma-separated value (CSV) format defined in Attachment 1 of the standard. Many recorders and SCADA historians export SER in their own formats; a conversion script that has been tested against Attachment 1 should be in place before the first request arrives.
4. R2 and R3 — Fault recording
4.1 Where fault recording is required
R2 requires FR data sufficient to determine specified electrical quantities at three locations:
| Location | Quantities |
|---|---|
| High side of each main power transformer | Phase-to-neutral voltage, each phase; each phase current and the residual or neutral current; real and reactive power (three-phase) |
| Each collector feeder breaker | Same as the MPT high side |
| Each shunt dynamic reactive device | Phase-to-neutral voltage, each phase; each phase current and residual or neutral current; reactive power (three-phase) |
Collector feeder FR is the most significant departure from PRC-002 practice. Feeder-level data lets the analyst see whether a loss of output came from all feeders (a plant-wide controller or ride-through issue) or from one feeder (a feeder protection operation or an inverter-specific problem).
4.2 "Measured or determined"
The standard requires quantities to be recorded or determinable. Residual current, for example, does not need its own CT if all three phase currents are recorded:
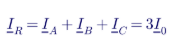
Three-phase real power can be computed from the sampled waveforms:

and reactive power from the fundamental phasors:

The trap is triggering. R3 requires a residual overcurrent trigger. If residual current is only calculated after the fact, the device cannot trigger on it. Confirm that the recorder or relay has a real-time calculated residual element that can initiate a record.
4.3 R3 performance criteria
| Parameter | PRC-028-1 minimum | Keentel's recommended setting |
|---|---|---|
| Pre-trigger data | 2 cycles | 10–20 cycles, to show pre-fault loading and controller state |
| Total record length | 2.0 s (single record or multiple records for the same trigger point) | 3–5 s at the MPT; 2–3 s at feeders, plus automatic retrigger |
| Recording rate | 64 samples per cycle | 64–128 samples per cycle |
| Triggers — MPT and feeders | Residual overcurrent (feeders: if applicable); phase overvoltage and undervoltage; over- and underfrequency | Add negative-sequence voltage and external cross trigger from SER |
| Triggers — shunt dynamic reactive devices | Residual overcurrent; phase overvoltage and undervoltage (no frequency triggers) | Add device trip or block status |
The 2.0 s minimum matters because IBR behavior unfolds after the fault. A fault at a 230 kV substation clears in 3–5 cycles, but the inverters' current injection, PLL resynchronization, momentary cessation recovery and plant controller response continue for hundreds of milliseconds to several seconds. A 0.5 s record — common in relays set up only for protection analysis — shows the fault and nothing of the response that PRC-029 and PRC-030 care about.
4.4 Worked example: sample rate, Nyquist and harmonics
At 64 samples per cycle and 60 Hz:

The Nyquist frequency — the highest frequency that can be represented without aliasing — is:
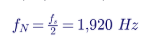
That is the 32nd harmonic of 60 Hz. In practice the recorder's anti-aliasing filter rolls off below the Nyquist frequency, so reliable content extends to roughly the 20th to 25th harmonic. That is adequate for fault analysis, DC offset, CT saturation, transformer inrush and lower-order harmonic resonance. It is not adequate for inverter switching ripple (typically several kilohertz) or for high-frequency control interactions, which need a dedicated power quality or high-speed recorder.
4.5 Worked example: residual overcurrent trigger at a collector feeder
A 34.5 kV collector feeder uses 1200:5 CTs. The collector system is effectively grounded through a zig-zag grounding transformer at the collector bus. Field measurements show a standing residual current of up to 30 A primary from unbalanced cable charging and load.
Setting the trigger at four times the standing residual:

A bolted single-line-to-ground fault on this feeder produces several thousand amperes of residual current, and a high-resistance fault of a few hundred amperes still triggers reliably. The trigger is far below the feeder's ground protection pickup, so the recorder captures events the relay does not trip on — which is the point.
If the collector system is ungrounded or high-resistance grounded, residual current during a ground fault may be only a few amperes. The "if applicable" qualifier in Part 3.2.3.1 was written for this case, but the standard does not define it. Document the grounding design, the reason a residual trigger is not meaningful, and the alternative used — for example a zero-sequence voltage (3V0) trigger from a broken-delta VT.
4.6 Worked example: voltage and frequency triggers
Triggers must be sensitive enough to capture disturbances that matter but not so sensitive that they fill the recorder with nuisance records.
| Trigger | Typical starting point | Basis |
|---|---|---|
| Phase undervoltage | 0.88 pu for 1 cycle | Just below the 0.90 pu continuous operating limit used in PRC-029-1 |
| Phase overvoltage | 1.10 pu for 1 cycle | Upper continuous operating limit |
| Underfrequency | 59.6 Hz | Captures significant frequency events without daily nuisance triggers |
| Overfrequency | 60.4 Hz | Symmetrical with underfrequency |
| Residual overcurrent | 3–5 × standing residual | Measured, not assumed |
These are starting points only. Keentel tunes triggers against the plant's measured voltage and frequency distribution so that the expected number of records per month is known and storage is sized accordingly.
4.7 Relays or dedicated recorders?
The standard is equipment-neutral. Modern feeder relays often support 64 samples per cycle and synchronized time stamps, and the Technical Rationale allows multiple records for the same trigger point, which helps relays that cannot store 2.0 s in one record. The trade-offs:
| Factor | Protective relays | Dedicated digital fault recorder (DFR) |
|---|---|---|
| Hardware cost | Already installed | Additional device and panel space |
| Record length | Often limited; may need chained records | Long records and continuous DDR in one unit |
| Storage depth | Limited event memory; overwrite risk | Large storage |
| Retrieval | Per relay, varied formats | Central, automated |
| Trigger flexibility | Tied to protection logic | Independent, configurable |
| Risk of affecting protection | Settings changes touch protection | None |
Many owners use a hybrid: feeder relays for feeder-level FR and a multifunction DFR at the MPT for FR, DDR and SER.
4.8 Worked example: FR storage and overwrite risk
A binary COMTRADE record stores, for each sample, a 4-byte sample number, a 4-byte time stamp, 2 bytes per analog channel and 2 bytes per 16 digital channels. For an MPT or feeder record with 7 analog channels (three voltages, three phase currents and neutral current) and 16 digital channels:

For a 2.5 s record at 3,840 samples/s:

Ten FR measurement points (one MPT, eight feeders, one STATCOM) during a storm with 40 triggers per day per device generate:

Storage is cheap at the DFR. The problem is relays. A feeder relay with a 30 s high-rate event buffer holds about 12 records of 2.5 s. On a storm day with 40 triggers, the first 28 records are overwritten before anyone retrieves them — and the most important record is often the first one. Automatic retrieval to a station server after every trigger is the only reliable fix.
5. R4 and R5 — Dynamic disturbance recording
5.1 What DDR captures
FR captures seconds of high-rate waveform around a trigger. DDR records continuously at a lower rate and shows the slower evolution of a disturbance: power swings, frequency excursions, voltage recovery, plant controller response and oscillations. R4 requires DDR data for each MPT sufficient to determine:
- One phase-to-neutral or positive-sequence voltage on the high side (phase-to-phase is acceptable per the Technical Rationale).
- The corresponding phase current or positive-sequence current.
- Real and reactive power on a three-phase basis.
- Frequency (one measurement per site is sufficient).
5.2 R5 rates
R5 requires an input sampling rate of at least 960 samples per second (16 samples per cycle) and an output recording rate of at least 60 records per second.
5.3 Worked example: why 60 records per second
The output stream is a sequence of phasors or RMS values. Its own Nyquist frequency is:

At 30 records per second (the PRC-002 minimum), fN is 15 Hz. At 60 records per second, fN is 30 Hz.
IBR plants can exhibit control interactions and sub-synchronous oscillations in the 5–25 Hz range, particularly in weak grids. Consider a 20 Hz oscillation in plant real power. At 60 records per second it is visible directly. At 30 records per second, without adequate filtering, it aliases to:

An analyst would see a 10 Hz oscillation that does not exist, and could tune the wrong controller. With the filtering used in phasor measurement units, the 20 Hz content is attenuated rather than aliased — but then it is simply invisible. Either way, 30 records per second cannot resolve the behavior. This is why existing PMUs configured at 30 frames per second must be reconfigured, and some older devices replaced.
5.4 Worked example: DDR storage
For one MPT, with an 8-byte time stamp and six 4-byte values (V, I, P, Q, f and phase angle):

At 60 records per second for one day:

Twenty days need about 3.3 GB in binary, or about 8 GB as CSV. Keentel recommends a ring buffer of at least 60 days at the station plus automatic archiving of any period that contains a trigger, so that an event on Day 19 is never lost on Day 21.
5.5 Measurement accuracy is not specified
PRC-028-1 sets rates but not measurement accuracy. Frequency and phasor accuracy depend on the estimation algorithm, the window length and the instrument transformers. For model validation, Keentel recommends devices that meet the measurement classes of IEEE/IEC 60255-118-1 (synchrophasor measurement), and documents CT and VT accuracy classes and burdens for each DDR channel.
6. R6 — Time synchronization
6.1 The requirement
All SER, FR and DDR data must be synchronized to Coordinated Universal Time (UTC), with or without a local time offset. Clock accuracy must be within:
- ±1 ms of UTC for plant-level recording devices.
- ±100 ms of UTC for IBR units.
The accuracy applies to the synchronized clock, not to every time stamp, which also includes measurement and processing delays.
6.2 Do not confuse PRC-028 with IEEE 2800
IEEE Std 2800-2022, the interconnection and interoperability standard for transmission-connected IBRs, specifies ±1 µs at plant level and ±100 µs at unit level for new plants that adopt it through interconnection requirements. These figures are 1,000 times tighter than PRC-028-1. A plant built to IEEE 2800 will meet PRC-028 timing; the reverse is not true. Check which applies to each plant before specifying clocks.
6.3 Worked example: what a timing error does to the data
At 60 Hz, a time error Δt produces a phase angle error:

| Clock error Δt | Phase error at 60 Hz | Fraction of a cycle | Practical effect |
|---|---|---|---|
| 1 µs (GPS, IRIG B, PTP) | 0.0216° | 0.00006 | Synchrophasor quality |
| 1 ms (PRC 028 plant limit) | 21.6° | 0.06 | Event sequencing to a fraction of a cycle; not good enough for phasor comparison between sites |
| 10 ms (typical NTP over WAN) | 216° | 0.6 | Cannot tell whether a breaker opened before or after a voltage dip |
| 100 ms (PRC 028 unit limit) | 2,160° | 6 cycles | Unit events only placed to within ±6 cycles |
For a fault cleared in 4 cycles (67 ms), a unit trip time-stamped with ±100 ms uncertainty cannot be placed definitively before or after fault clearing. That distinction often decides whether a trip was a ride-through failure (PRC-029) or a protection response. Keentel therefore recommends distributing NTP or PTP to inverters and plant controllers with a target accuracy of a few milliseconds — well inside the ±100 ms limit.
6.4 Time synchronization architecture
| Layer | Recommended method | Typical accuracy |
|---|---|---|
| Substation clock | GPS/GNSS clock with holdover oscillator | < 1 µs |
| DFR, relays, PMU | IRIG B (B00x) or IEEE 1588 PTP (IEEE C37.238 power profile) | 1 µs |
| Plant controller, SCADA | NTP from the substation clock | 1 ms on a well-designed LAN |
| Inverters and PCS | NTP or SNTP over the plant fiber network | 1–10 ms |
Two often-missed details:
- Loss of synchronization must be detected and logged. A GPS antenna failure that goes unnoticed for months makes every record from that period noncompliant and may count as a recording failure under R8.
- Leap seconds and time zones. Record in UTC (with any local offset declared in the file), and confirm that daylight-saving changes do not shift time stamps on inverters configured with local time.
6.5 Worked example: verifying inverter clock accuracy
Keentel's field method is to compare inverter event logs against the DFR for a known plant-level event — for example, a collector feeder breaker opening during a planned outage. Every inverter on the feeder records loss of grid voltage. If the DFR records the breaker opening at 14:02:07.412 UTC and an inverter logs the loss of voltage at 14:02:07.389, the inverter recorded the effect 23 ms before its cause, so its clock runs at least 23 ms ahead of UTC (more, once the inverter's few milliseconds of detection delay are added). Repeating this across all units gives a measured clock error distribution, which is strong R6 evidence.
7. R7 — Data retention and provision
7.1 The requirement
On request from the Transmission Planner, Planning Coordinator, Transmission Operator, Balancing Authority, Reliability Coordinator, Regional Entity or NERC, the GO must provide SER, FR and DDR data as follows:
| Part | Requirement |
|---|---|
| Retrievability | Data retrievable for 20 calendar days, inclusive of the day it was recorded |
| Response time | Provided within 15 calendar days of the request, unless the requestor grants an extension |
| SER format | CSV per Attachment 1 of the standard |
| FR and DDR format | CSV with appropriate headers, or IEEE C37.111 COMTRADE (1999 revision or later) |
| File naming | IEEE C37.232 (COMNAME), 2011 revision or later |
7.2 Two clocks, not one
Watch for this. A worked example in the PRC-028-1 supporting documents describes data requested on Day 6 as due within 20 calendar days of the request. That example conflates the 20-day retrievability window (Part 7.1) with the 15-day response deadline (Part 7.2). The standard governs. Build internal procedures around 15 days and document any extension granted by the requestor.
7.3 Worked example: the request timeline
A disturbance occurs on March 3. The Reliability Coordinator requests data on March 8.
- Data recorded on March 3 must remain retrievable through March 22 (20 calendar days, inclusive of March 3).
- The response is due by March 23 (15 calendar days after March 8).
Now suppose a second request for the same March 3 data arrives on March 20. The data is still within its retrievability window, and the response is due April 4. But if the GO waits to retrieve it, the ring buffer may overwrite it on March 23. The practical rule:
- On receipt of any request, immediately preserve (copy and lock) all data in the requested window.
- Keep raw data longer than 20 days — Keentel recommends at least 60 days — so that retrieval delays never put data at risk.
- After any significant event, hold the data until analysis under PRC-030-1 is complete.
7.4 What a compliant data package looks like
| Item | Contents |
|---|---|
| Cover memo | Request reference, date received, date provided, devices, time window, time zone and UTC offset |
| SER file | Attachment 1 CSV, all plant and unit-level events in the window |
| FR files | COMTRADE .cfg/.dat (or .cff) pairs, COMNAME file names, channel names and units documented |
| DDR files | COMTRADE or CSV with headers, continuous across the window |
| Channel map | Device, channel, quantity, CT/VT ratio, polarity, phase |
| Data quality notes | Gaps, clock status, known issues |
7.5 Why COMNAME matters
IEEE C37.232 file names encode the start date and time, time zone offset, station, device and other identifiers. An analyst receiving thousands of files from dozens of owners after a wide-area event sorts and aligns them by name. Files named "event001.cfg" slow the analysis and draw attention. Configure naming at the retrieval server, and test the full chain — retrieve, convert, rename, package, transmit — before the first request arrives.
8. R8 — Restoring failed recording capability
8.1 The requirement
Within 90 calendar days of discovering a failure of SER, FR or DDR recording capability, the GO must either restore the capability or submit a Corrective Action Plan to the Regional Entity and implement it. Maintenance or testing outages longer than 90 days count as failures; an outage of the monitored Element (for example, a feeder out of service) does not. Supporting materials indicate that CAPs are submitted through the Periodic Data Submittals module of the ERO's Align platform.
8.2 What counts as a failure
- Recorder or relay hardware failure.
- Loss of communications that prevents storage or retrieval.
- Loss of time synchronization that makes data noncompliant.
- Configuration errors — wrong trigger, wrong channel mapping, wrong sample rate — found after the fact.
- Storage full, or ring buffer overwriting data before 20 days.
8.3 Worked example: the 90-day clock
A GPS antenna failure is discovered on March 10. Counting 90 calendar days:
| Period | Days | Running total |
|---|---|---|
| March 11–31 | 21 | 21 |
| April | 30 | 51 |
| May | 31 | 82 |
| June 1–8 | 8 | 90 |
Capability must be restored, or a CAP submitted, by June 8. Long-lead items — a replacement DFR, an outage to install CTs — rarely fit inside 90 days, so the CAP route should be decided within the first two to three weeks.
8.4 Discovery is the key fact
The clock starts at discovery. An owner without monitoring may "discover" a six-month-old failure during an audit, and the auditor will ask why it was not found sooner. Keentel recommends:
- Daily automated health checks of every recorder: communications, clock status, storage, last record time.
- A weekly test trigger (or review of the most recent natural trigger) on each FR device.
- Alarms to the operations center for clock loss and recorder failure.
- A failure log recording discovery date, cause, restoration date or CAP submission.
9. Compliance dates and phase-in strategy
9.1 Reading the Implementation Plan
The phased dates are summarized in Part A. Three details deserve attention:
- "Within three calendar years." Some read this as April 1, 2028; the RSAW lists January 1, 2029. Until your Regional Entity confirms otherwise, plan to April 1, 2028.
- The 50% basis is undefined. The plan does not say whether 50% is measured by number of facilities, nameplate capacity or another measure. Document your basis.
- The single-IBR provision. A GO with only one BES IBR must reach 100% within three calendar years — not by 2030. This provision is easy to miss because the RSAW compliance-date summary omits it.
9.2 Worked example: meeting the 50% milestone
A GO owns six existing BES IBRs:
| Plant | Capacity |
|---|---|
| P1 | 300 MW |
| P2 | 250 MW |
| P3 | 200 MW |
| P4 | 150 MW |
| P5 | 100 MW |
| P6 | 80 MW |
| Total | 1,080 MW |
Fifty percent by count is three plants. Fifty percent by capacity is 540 MW. Choosing the three smallest plants (P4, P5, P6) gives 330 MW — compliant by count, not by capacity. Choosing P1, P4 and P5 gives three plants and 550 MW — compliant on both bases. Keentel recommends a plan that satisfies both, which removes the interpretation risk at little cost, and prioritizing plants by reliability risk: size, grid strength, event history and inverter vintage.
9.3 New and non-BES resources
A new BES IBR must comply at the later of July 1, 2026 or its commercial operation date. Because the non-BES new-resource date is measured from the standard's effective date rather than from registration, a non-BES IBR that reaches commercial operation shortly after May 15, 2026 must comply at commercial operation. Monitoring must be in the construction scope, not added afterward.
9.4 Extensions
The Implementation Plan allows GOs with IBRs in service before the effective date to request an extension when circumstances beyond their control — supply chain delays, inability to obtain outages — prevent installation. The request must identify the IBRs, give an installation plan and timetable, explain the circumstances, and be submitted no later than three months before the compliance date. For an April 1, 2028 milestone, that means by January 1, 2028.
9.5 The PRC-002 gap
PRC-002-5 removed IBRs immediately, while existing IBRs have until 2028–2030 to comply with PRC-028. Monitoring equipment at existing IBRs may therefore not be strictly required by either standard for a period. Do not neglect or decommission it. It is likely to form part of the PRC-028 solution, and event analysts will expect its data to exist.
10. Designing a PRC-028 monitoring system
10.1 The example plant
| Item | Value |
|---|---|
| Capacity | 120 MW PV + 80 MW / 320 MWh BESS (200 MW at the POI) |
| Point of interconnection | 230 kV |
| Main power transformer | One 230/34.5 kV, 140/187/233 MVA ONAN/ONAF/ONAF |
| Collector system | 34.5 kV, eight feeders (six PV, two BESS) |
| Reactive support | One 150 Mvar STATCOM; one 34.5 kV harmonic filter bank |
| Units | 36 PV inverters and 24 BESS PCS, 3.5 MVA each |
| Grounding | Zig zag grounding transformer on the 34.5 kV bus |
10.2 Worked example: channel and device count
| Location | FR analog channels | DDR quantities | SER points | Device |
|---|---|---|---|---|
| MPT high side (230 kV) | 3 V + 4 I = 7 | V, I, P, Q, f | 3 | Multifunction DFR |
| Collector feeders (×8) | 7 each = 56 (bus VT shared) | — | 24 | Feeder relays (FR) + DFR (SER) |
| STATCOM | 7 | — | 3 | DFR channel group or STATCOM recorder |
| MPT low side main, filter bank | — | — | 6 | DFR SER inputs |
| Total | 70 | 1 MPT stream | 36 plant points | 1 DFR + 8 relays + clock |
Plus 60 IBR units' fault codes, alarms and ride-through status through the SCADA or the manufacturer's data logger.
At 64 samples per cycle, the aggregate FR sampling load across the plant is:

That is spread across nine devices, well within modern hardware — but it should be checked for any single DFR that takes all feeder channels directly.
10.3 Architecture
- One multifunction DFR at the collector substation: MPT FR and DDR, STATCOM FR, all plant SER.
- Feeder relays configured for 64 samples per cycle, 2.5 s records, residual and voltage triggers, with automatic retrieval.
- GPS clock with IRIG-B to the DFR and relays, PTP or NTP to the plant controller, SCADA and inverters.
- Station data server collecting all records, converting to COMTRADE with COMNAME names, keeping a 60-day ring buffer and permanent archive of triggered events.
- Health monitoring feeding alarms to the operations center.
- Cyber security — the recorder network is part of the plant's BES Cyber Systems scope; low-impact controls under CIP-003, including vendor electronic remote access controls, apply.
10.4 Instrument transformers
The data is only as good as the CTs and VTs. Check:
- CT saturation. For the MPT high-side CTs, verify that the CT will not saturate for the maximum asymmetrical fault current and burden; saturated currents in a fault record lead to wrong conclusions about inverter fault current contribution.
- VT location. High-side voltage must represent the MPT high side, not the line side of an open breaker.
- Polarity and phasing. Verify with a primary injection or load check at commissioning; reversed CT polarity produces negative power in the DDR and an apparent "export" during a fault.
10.5 Commissioning test plan
| Test | Purpose |
|---|---|
| Secondary injection of each trigger | Prove each trigger initiates a record |
| Record length and pre-trigger check | Prove ≥ 2 cycles pre-trigger and ≥ 2.0 s total |
| Sample rate check from COMTRADE .cfg | Prove ≥ 64 samples per cycle and DDR ≥ 60 records/s |
| Clock check against reference | Prove ±1 ms (plant) and ±100 ms (units) |
| Load check | Prove polarity, phasing and P/Q sign |
| End to end data request drill | Prove a 15 day response is achievable, with correct formats and file names |
| Unit SER test | Trip one inverter in test mode; confirm fault codes and ride-through status are recorded and time stamped |
11. Evidence and audit readiness
11.1 Evidence by requirement
| Requirement | Strong evidence |
|---|---|
| R1 | SER point list, recorder settings, sample SER export, unit-level capability documentation for existing inverters |
| R2 | Channel maps for each location, one-line and three-line drawings, calculation basis for determined quantities |
| R3 | Recorder settings showing pre-trigger, record length, sample rate and triggers; test records |
| R4, R5 | DDR configuration showing quantities, 960 samples/s input, 60 records/s output; sample DDR file |
| R6 | Time-sync architecture drawing, clock status logs, measured clock error results |
| R7 | Data request log, transmittals, file samples in COMTRADE/CSV with COMNAME names, extension correspondence |
| R8 | Health monitoring logs, failure log, restoration records, CAPs and Align submittals |
11.2 Read the RSAW — but rely on the standard
The RSAW tells you how the auditor will test you. It is not the requirement. In Keentel's review, the PRC-028-1 RSAW contains at least three points that differ from the standard: the 20-day response example, an evidence request for real power at shunt dynamic reactive devices (R2 requires only reactive power there), and an auditor note on time synchronization that cites only the 1 ms figure, without the 100 ms tolerance for IBR units. Where the RSAW and the standard differ, rely on the standard and be ready to cite the requirement part.
11.3 Requirements that may never be triggered
R7 and R8 apply only when a request or a failure occurs. If none occurred during the audit period, the evidence is an attestation supported by the processes that would have caught one: the request intake log, the health-monitoring system and the failure log. An auditor will ask, "How would you know?" The answer must be a system, not a person.
11.4 A 90-day readiness plan
| Days | Work |
|---|---|
| 1–15 | Applicability screen for every plant; confirm compliance dates and phase-in basis |
| 16–45 | Requirement by requirement gap assessment at each in-scope plant: devices, channels, rates, triggers, clocks, storage |
| 46–60 | Engineering fixes that need only settings: sample rates, record length, triggers, clocks, naming |
| 61–75 | Data request drill and health monitoring set up |
| 76–90 | Evidence binder, compliance narrative per requirement, capital plan for hardware gaps |
12. Common misconceptions
| Misconception | Reality |
|---|---|
| "Our PRC 002 recorder at the POI covers us." | PRC-028 adds collector feeders, shunt dynamic devices, 2.0 s records, 60 records/s DDR and unit SER. |
| "We have 20 days to respond." | 15 days to respond; 20 days of retrievability. |
| "SCADA at 1 s is good enough for DDR." | DDR requires ≥ 60 records/s from ≥ 960 samples/s input. |
| "Inverters need microsecond clocks." | PRC 028 requires ±100 ms for units; microsecond figures are from IEEE 2800. Good practice is a few milliseconds. |
| "Old inverters are exempt." | Unit-level SER for existing units is required if they are capable; incapability must be documented. |
| "A failed recorder is a violation immediately." | R8 allows 90 days to restore or submit a CAP — from discovery. |
| "Once installed, we're done." | Firmware changes, additions and repowering change scope and settings; recheck at every change. |
13. Key takeaways
- PRC-028-1 is effective now; the R8 date for BES IBRs (January 1, 2026) has passed, and the first R1–R7 milestones are approaching.
- The minimums — 64 samples per cycle, 2.0 s records, 60 records/s DDR, ±1 ms plant clocks — are achievable with modern equipment, but rarely without settings changes.
- Collector feeder FR and unit-level SER are the most common gaps.
- Fifteen days is the response deadline; design retrieval to deliver in days.
- Monitoring health is a compliance function: discovery starts the R8 clock.
- Good PRC-028 data is the foundation of PRC-029, PRC-030 and model validation.
14. How Keentel Engineering helps
Keentel Engineering supports Generator Owners, developers and asset managers with NERC compliance built on engineering evidence, for IBR plants interconnected from 69 kV to 500 kV.
| Service | Keentel scope | Outcome |
|---|---|---|
| Applicability and registration review | BES and non-BES screening, aggregation, compliance dates, phase-in basis | A documented scope for every plant |
| PRC 028 gap assessment | Requirement-by-requirement review of devices, channels, rates, triggers, clocks and storage | A prioritized gap register and cost estimate |
| Monitoring system design | DFR, relay and clock specification; CT/VT review; drawings and settings | A compliant, analysis-ready design |
| Settings and commissioning | Trigger tuning, record length, sample rates, time sync, end-to-end testing | Verified compliance before the compliance date |
| Data request and R8 programs | Retrieval, COMTRADE/COMNAME packaging, health monitoring, CAP preparation | 15-day responses and no surprises at audit |
| Event analysis | PRC 030-1 root cause analysis using PRC 028 data; PRC 029-1 ride-through review | Defensible findings and corrective actions |
| Model validation | PSS®E and PSCAD model benchmarking against recorded disturbances | Models that match the plant |
| Audit readiness | Evidence binders, compliance narratives, mock audits | A smooth audit |
Why clients choose Keentel Engineering
- Engineering-first compliance: settings files, drawings and test records — the evidence auditors trust.
- IBR depth: protection, controls, ride-through, EMT and positive-sequence modeling under one roof.
- Practical field experience: commissioning and event analysis at solar, wind and storage plants.
- Clear deliverables: gap registers, plans and narratives that owners can act on.
- Licensed professional engineering: a Florida-registered firm with offices in Tampa, Austin, Sacramento and Baltimore, supporting projects nationwide.
Facing a PRC-028-1 compliance date or a data request? Talk to Keentel Engineering at (813) 389-7871, contact@keentelengineering.com, or book a 15-minute scoping call at calendly.com/keentel-engineering/15min.
Part C — Case Studies
The following are illustrative composite scenarios based on conditions typical of US IBR compliance work. They show how Keentel Engineering approaches PRC-028-1; site details are generalized and figures are rounded.
Case Study 1 — Portfolio gap assessment and phased implementation
Situation. A Generator Owner with seven existing BES solar and solar-plus-storage plants, interconnected at 115 kV to 345 kV across two Regional Entities, needed a PRC-028-1 plan. Each plant had a DFR at the point of interconnection installed under earlier PRC-002 practice. The owner assumed most requirements were already met.
Analysis. Keentel performed a requirement-by-requirement gap assessment at every plant. Findings:
- The DFRs met 64 samples per cycle, but records were set to 1.0 s with 5 cycles of pre-trigger.
- DDR was configured at 30 records per second at four plants.
- No plant had collector feeder FR beyond protection event reports of 15–30 cycles.
- Feeder relays could record at 64 samples per cycle but stored only a few records before overwriting.
- Inverter clocks at three plants were synchronized to the SCADA server, which itself drifted by up to 4 s.
- No plant had a tested data request procedure.
Engineered solution. Keentel separated settings-only fixes from hardware work. Record length, DDR rate and triggers were changed by settings at all seven plants. Feeder relays were reconfigured and automatic retrieval added to a station server. GPS clocks were added at two plants, and NTP was redistributed from the substation clock to the SCADA server and inverters. The 50% milestone was planned on both count and capacity, with the two highest-risk plants (largest, in the weakest part of the grid) first.
Outcome. About 70% of the gaps closed through settings and configuration in the first six months. The hardware program fit the owner's capital cycle, and the measured inverter clock error fell from several seconds to under 10 ms. A data request drill delivered a complete COMTRADE package in four days.
Case Study 2 — Event analysis that the data could not support
Situation. A 250 MW wind and storage plant at 345 kV lost about 90 MW during a nearby line fault that cleared in 4 cycles. The Reliability Coordinator requested data and an explanation. The owner's records consisted of a 0.5 s fault record at the POI, SCADA data at 2 s and inverter logs with unknown clock offsets.
Analysis. Keentel reconstructed the event. The fault record showed fault clearing, but ended before output fell. SCADA showed the loss but not its timing. Turbine and PCS logs showed ride-through mode entries and several trips, but time stamps differed by up to 40 s between turbine groups. Keentel aligned the logs using a common feeder breaker event, which narrowed the trips to a 200 ms window after fault clearing — enough to identify a converter DC overvoltage protection setting on one turbine type, but not enough to rule out a plant controller contribution.
Engineered solution. Keentel redesigned the plant's monitoring to PRC-028-1: 3 s FR at the MPT and feeders, 60 records/s DDR, PTP to the DFR and NTP to turbines and PCS, unit-level SER with ride-through status. The turbine protection setting was corrected through the manufacturer, and the change was screened for PRC-019 coordination and model updates.
Outcome. Eight months later a similar fault occurred. The plant rode through with a brief, recovering dip, and the full event timeline — breaker operations, unit ride-through mode entries and plant P, Q and frequency — was assembled in two days.
Case Study 3 — A newly registering non-BES IBR owner
Situation. An independent owner of three plants — 40 MW solar at 69 kV, 30 MW solar at 69 kV and 25 MW storage at 115 kV — was newly within NERC's non-BES IBR registration scope. The owner had no compliance program and no disturbance monitoring beyond revenue metering and SCADA. A fourth plant, a 60 MW solar-plus-storage project, was due to reach commercial operation shortly after May 15, 2026.
Analysis. Keentel confirmed that all three existing plants met the ≥ 20 MVA, ≥ 60 kV criteria. Their PRC-028 compliance date for R1–R7 was January 1, 2030, but R8 applied from April 1, 2027. The new plant was the urgent issue: as a non-BES IBR entering service after May 15, 2026, it had to comply at commercial operation.
Engineered solution. Keentel added a DFR, a GPS clock and feeder relay recording settings to the new plant's construction scope, with commissioning tests for every PRC-028 requirement. For the existing plants, Keentel prepared a phased design and budget, set up health monitoring ahead of the R8 date, and built a compliance program covering PRC-028 alongside CIP-003, PRC-005, PRC-019, PRC-024/PRC-029, PRC-030, MOD and VAR obligations.
Outcome. The new plant entered service with compliant monitoring and evidence in place. The owner completed registration with a functioning program rather than building one after the fact.
Part D — Technical FAQ: PRC-028-1 Disturbance Monitoring for IBRs
A NERC Reliability Standard requiring Generator Owners of applicable IBRs to have sequence of events, fault and dynamic disturbance recording, synchronized to UTC, with rules for data retention, provision and restoration of failed capability.
April 1, 2025, following FERC approval on February 20, 2025. Compliance with R1–R7 is phased to January 1, 2030; R8 applied to BES IBRs from January 1, 2026 and applies to non-BES IBRs from April 1, 2027.
BES IBRs, and non-BES IBRs that have or contribute to an aggregate nameplate capacity of at least 20 MVA connected through a system designed primarily to deliver that capacity to a common point at 60 kV or above.
No. Earlier drafts included Transmission Owners; the approved standard applies to Generator Owners. Where a TO owns the interconnection breakers, the GO should secure the data through an agreement.
Not automatically. PRC-028 adds collector feeder FR, shunt dynamic reactive device FR, 2.0 s records, 60 records/s DDR and unit-level SER. Existing recorders can be part of the solution if they meet every criterion.
At least 64 samples per cycle (3,840 samples/s at 60 Hz), with at least 2 cycles of pre-trigger and 2.0 s total record length.
Residual (neutral) overcurrent, phase overvoltage and undervoltage, and over- and underfrequency at the MPT and feeders (feeder residual overcurrent if applicable); shunt dynamic reactive devices require residual and voltage triggers but not frequency.
Yes, if they meet the sample rate, record length, triggers and time synchronization requirements. Multiple records for the same trigger point are allowed. Watch storage depth and retrieval.
Continuous recording at each MPT of one voltage, the matching current, three-phase P and Q, and frequency, with at least 960 samples/s input and 60 records/s output.
A 60 records/s stream can represent oscillations up to 30 Hz; a 30 records/s stream only up to 15 Hz. IBR control interactions often fall between 5 and 25 Hz.
±1 ms of UTC for plant-level devices and ±100 ms for IBR units. IEEE 2800's ±1 µs and ±100 µs figures are a separate, tighter interconnection requirement.
Generally yes for the ±100 ms unit requirement, if the design is documented and achieved accuracy is verifiable. Plant-level recorders usually need IRIG-B, PTP or a direct GPS input to meet ±1 ms reliably.
Retrievable for 20 calendar days, including the day recorded. Keentel recommends at least 60 days and indefinite hold of data from significant events.
Within 15 calendar days of a request, unless the requestor grants an extension.
SER as CSV per Attachment 1; FR and DDR as COMTRADE (IEEE C37.111-1999 or later) or CSV with headers; file names per IEEE C37.232 (COMNAME), 2011 or later.
For units in service before the effective date, unit-level SER is required only if the unit is capable. Document incapability with specifications or manufacturer correspondence.
Any condition that prevents compliant recording — hardware failure, communications loss, clock loss, configuration errors or maintenance outages longer than 90 days. An outage of the monitored Element is not a failure.
Ninety calendar days from discovery to restore capability or submit a CAP to the Regional Entity.
The Implementation Plan does not say. Plan to meet 50% by both count and capacity, document the basis and confirm with your Regional Entity.
PRC-028 provides the data. PRC-029 uses it to show ride-through performance; PRC-030 uses it to find the root cause of unexpected output changes and to verify corrective actions. It is also the reference data for IBR model validation.
References and Further Reading
Links were current at publication (October 2026).
- NERC, PRC-028-1 — Disturbance Monitoring and Reporting Requirements for Inverter-Based Resources, with Implementation Plan, Technical Rationale and RSAW. North American Electric Reliability Corporation, nerc.com.
- NERC, PRC-002-5 — Disturbance Monitoring and Reporting Requirements. NERC.
- NERC, PRC-029-1 — Frequency and Voltage Ride-through Requirements for Inverter-Based Resources; PRC-030-1 — Unexpected Inverter-Based Resource Event Mitigation. NERC.
- FERC, Order No. 901, Reliability Standards to Address Inverter-Based Resources, October 2023. Federal Energy Regulatory Commission.
- NERC, Glossary of Terms Used in NERC Reliability Standards (IBR and IBR Unit definitions). NERC.
- NERC, Rules of Procedure and Compliance Registry materials for Category 2 non-BES IBR Generator Owners and Generator Operators. NERC.
- NERC and Regional Entity disturbance reports on solar and wind resource loss events, 2016–2023. NERC.
- IEEE Std 2800-2022, Standard for Interconnection and Interoperability of Inverter-Based Resources Interconnecting with Associated Transmission Electric Power Systems. IEEE.
- IEEE Std C37.111, Common Format for Transient Data Exchange (COMTRADE). IEEE.
- IEEE Std C37.232, Recommended Practice for Naming Time Sequence Data Files (COMNAME). IEEE.
- IEEE/IEC 60255-118-1, Synchrophasor for Power Systems — Measurements. IEEE/IEC.
- IEEE Std C37.238, Profile for Use of IEEE 1588 Precision Time Protocol in Power System Applications. IEEE.
Disclaimer
This article is general technical information for educational purposes. It is not legal or compliance advice for any specific entity and does not create a professional relationship. Requirement summaries are paraphrases for orientation; the approved NERC Reliability Standards, Implementation Plans and the guidance of your Compliance Enforcement Authority govern. Dates reflect the public record as understood at publication and should be confirmed before reliance. Worked examples and settings are illustrative and must be verified by project-specific engineering, sealed by a licensed professional engineer where required.
Case studies are illustrative composite scenarios based on typical project conditions, not records of specific client projects. Figures are rounded and indicative.
NERC, FERC, IEEE, IEC and other names are the property of their respective owners. Keentel Engineering is not affiliated with or endorsed by these organizations or any equipment vendor.
© Keentel Engineering. All rights reserved.
| Office | Address | Phone |
|---|---|---|
| Head Office — Tampa | 400 N Ashley Dr STE #2600, Tampa FL 33602 | (813) 389-7871 |
| Austin | 5900 Balcones Drive STE 100, Austin TX 78731 | (512) 591-0752 |
| Sacramento | 1401 21st St Ste R, Sacramento CA 95811 | (916) 913-4524 |
| Baltimore | 306 W Redwood St STE 200, Baltimore MD 21201 | (410) 225-2181 |

About the Author:
Sandip "Sonny" R. Patel, P.E.
IEEE Senior Member · Founder & CEO, Keentel Engineering
In 1995, Sonny Patel earned his Electrical Engineering degree from the University of Illinois. But degrees don't build legacies — action does.
For three decades, he has worked the power industry from every side of the table: 16 years as a utility engineer at Exelon/Commonwealth Edison; generation leadership across hydroelectric, industrial steam turbine, and a 9 GW renewable fleet; NERC Regional Entity Senior Compliance Engineer and Audit Team Lead, auditing some of the nation's largest utilities; and testing and commissioning lead on equipment up to 765 kV — the very top of the North American grid.Utility. Generator. Regulator. Consultant. Few engineers have seen all four seats. Fewer still have sat in them.
His experience spans nuclear, hydro, conventional generation, renewables, oil and gas, mining — and today's data centers, where he is authoring a three-book series on data center design. He is a Licensed Professional Engineer in six states and a Licensed Electrical Contractor in Florida (Unlimited EC) — he doesn't just design the work; he's qualified to stand behind its execution.Today, as Founder and CEO of Keentel Engineering, Sonny leads a nationwide team of engineers delivering substation design, power system studies, NERC compliance, and commissioning — done right, coast to coast.Three decades. Every side of the table. One standard: accountable engineering.
Services

Let's Discuss Your Project
Let's book a call to discuss your electrical engineering project that we can help you with.
About the Author:
Sandip "Sonny" R. Patel, P.E.
IEEE Senior Member · Founder & CEO, Keentel Engineering
In 1995, Sonny Patel earned his Electrical Engineering degree from the University of Illinois. But degrees don't build legacies — action does.
For three decades, he has worked the power industry from every side of the table: 16 years as a utility engineer at Exelon/Commonwealth Edison; generation leadership across hydroelectric, industrial steam turbine, and a 9 GW renewable fleet; NERC Regional Entity Senior Compliance Engineer and Audit Team Lead, auditing some of the nation's largest utilities; and testing and commissioning lead on equipment up to 765 kV — the very top of the North American grid.
Utility. Generator. Regulator. Consultant. Few engineers have seen all four seats. Fewer still have sat in them.
His experience spans nuclear, hydro, conventional generation, renewables, oil and gas, mining — and today's data centers, where he is authoring a three-book series on data center design. He is a Licensed Professional Engineer in six states and a Licensed Electrical Contractor in Florida (Unlimited EC) — he doesn't just design the work; he's qualified to stand behind its execution.
Today, as Founder and CEO of Keentel Engineering, Sonny leads a nationwide team of engineers delivering substation design, power system studies, NERC compliance, and commissioning — done right, coast to coast.Three decades. Every side of the table. One standard: accountable engineering.
Leave a Comment
Thank you for contacting us.
We will get back to you as soon as possible.
We will get back to you as soon as possible.
Oops, there was an error sending your message.
Please try again later.
Please try again later.
Related Posts

By SANDIP R PATEL
•
October 26, 2026
Explore cyber-physical resilience for the Energy Internet, including DER attacks, false data injection, BESS readiness, AI detection, and NERC CIP compliance.
By SANDIP R PATEL
•
October 26, 2026
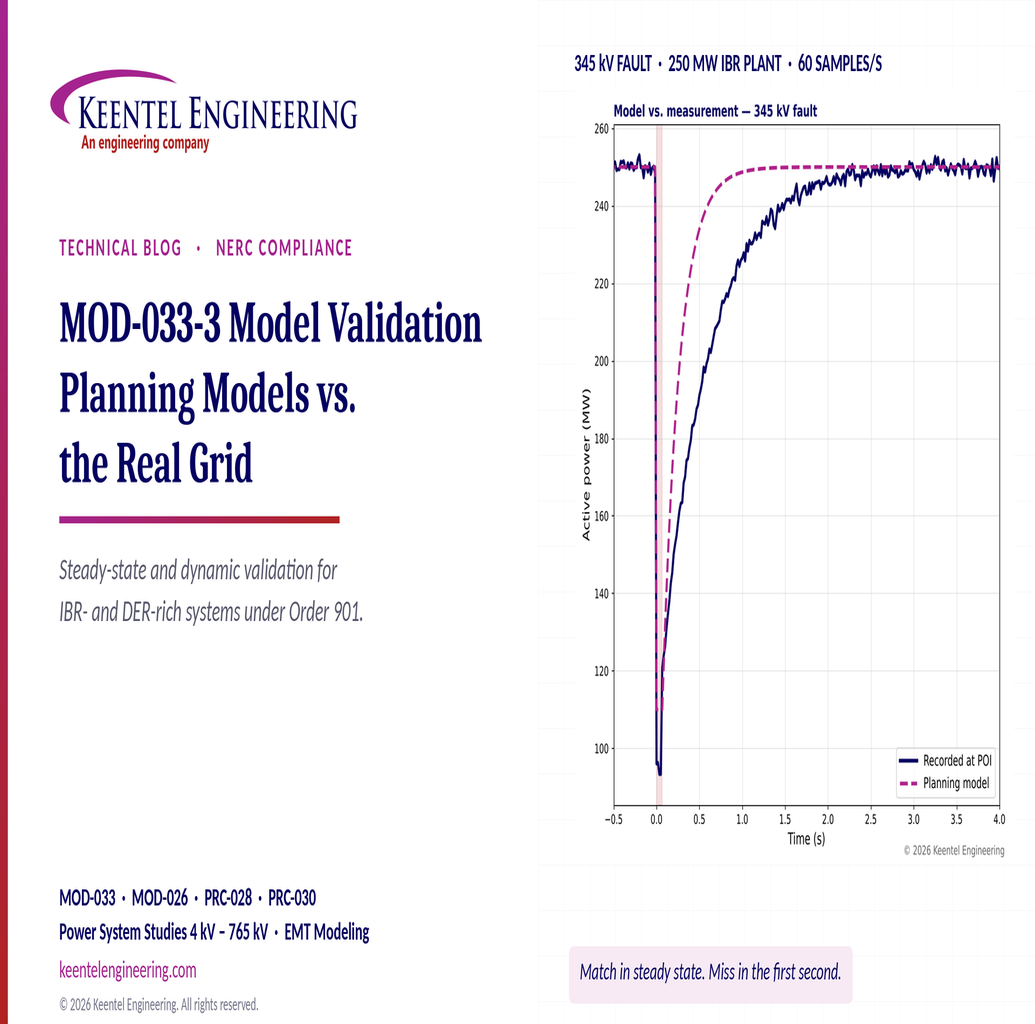
Understand MOD-033-3 requirements, IBR and DER model validation, steady-state comparisons, dynamic studies and NERC compliance.

By SANDIP R PATEL
•
October 24, 2026
Learn how Buchholz and sudden pressure relays protect transformers, detect internal faults, and meet NERC PRC-005-6 maintenance requirements.
By SANDIP R PATEL
•
October 24, 2026
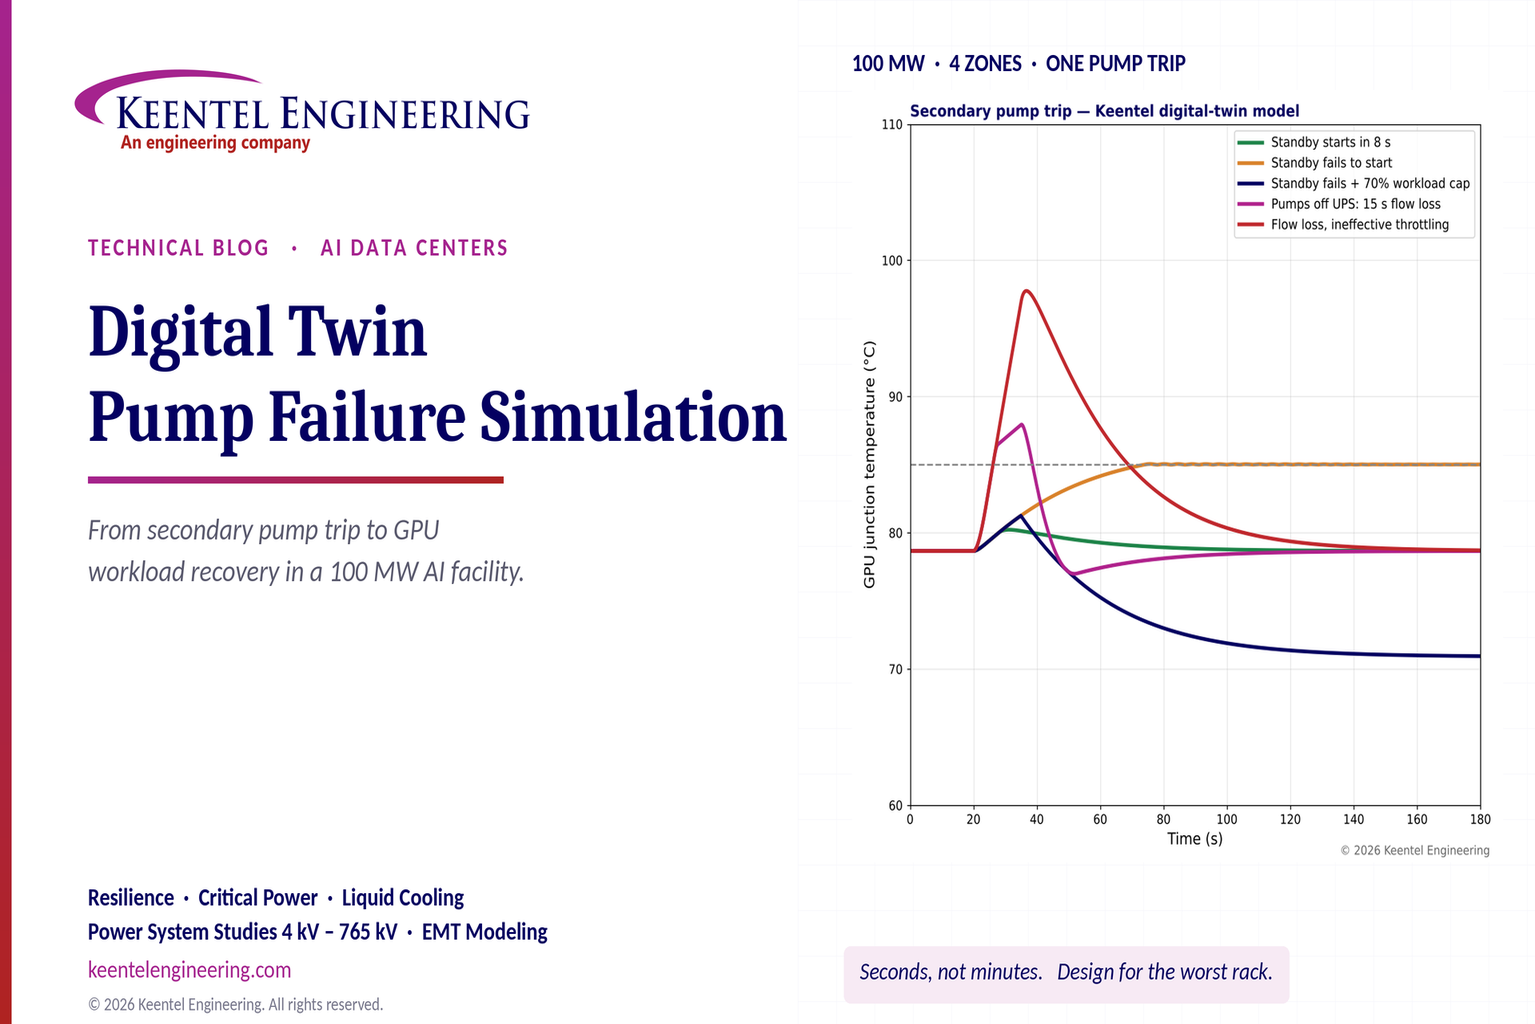
Explore digital twin pump failure simulation for liquid-cooled AI data centers, including GPU temperatures, standby pump failover, UPS and workload recovery.

By SANDIP R PATEL
•
October 24, 2026
Learn PSCAD custom component parameters, field types, Literal, Constant and Variable settings, Fortran coding, and EMT model validation for grid studies.

By Team 2 Dexora
•
October 24, 2026
Explore 800 VDC rack fault protection for AI data centers, including solid-state breakers, DC short circuits, selectivity, arc flash, and NEC/UL standards.
October 24, 2026
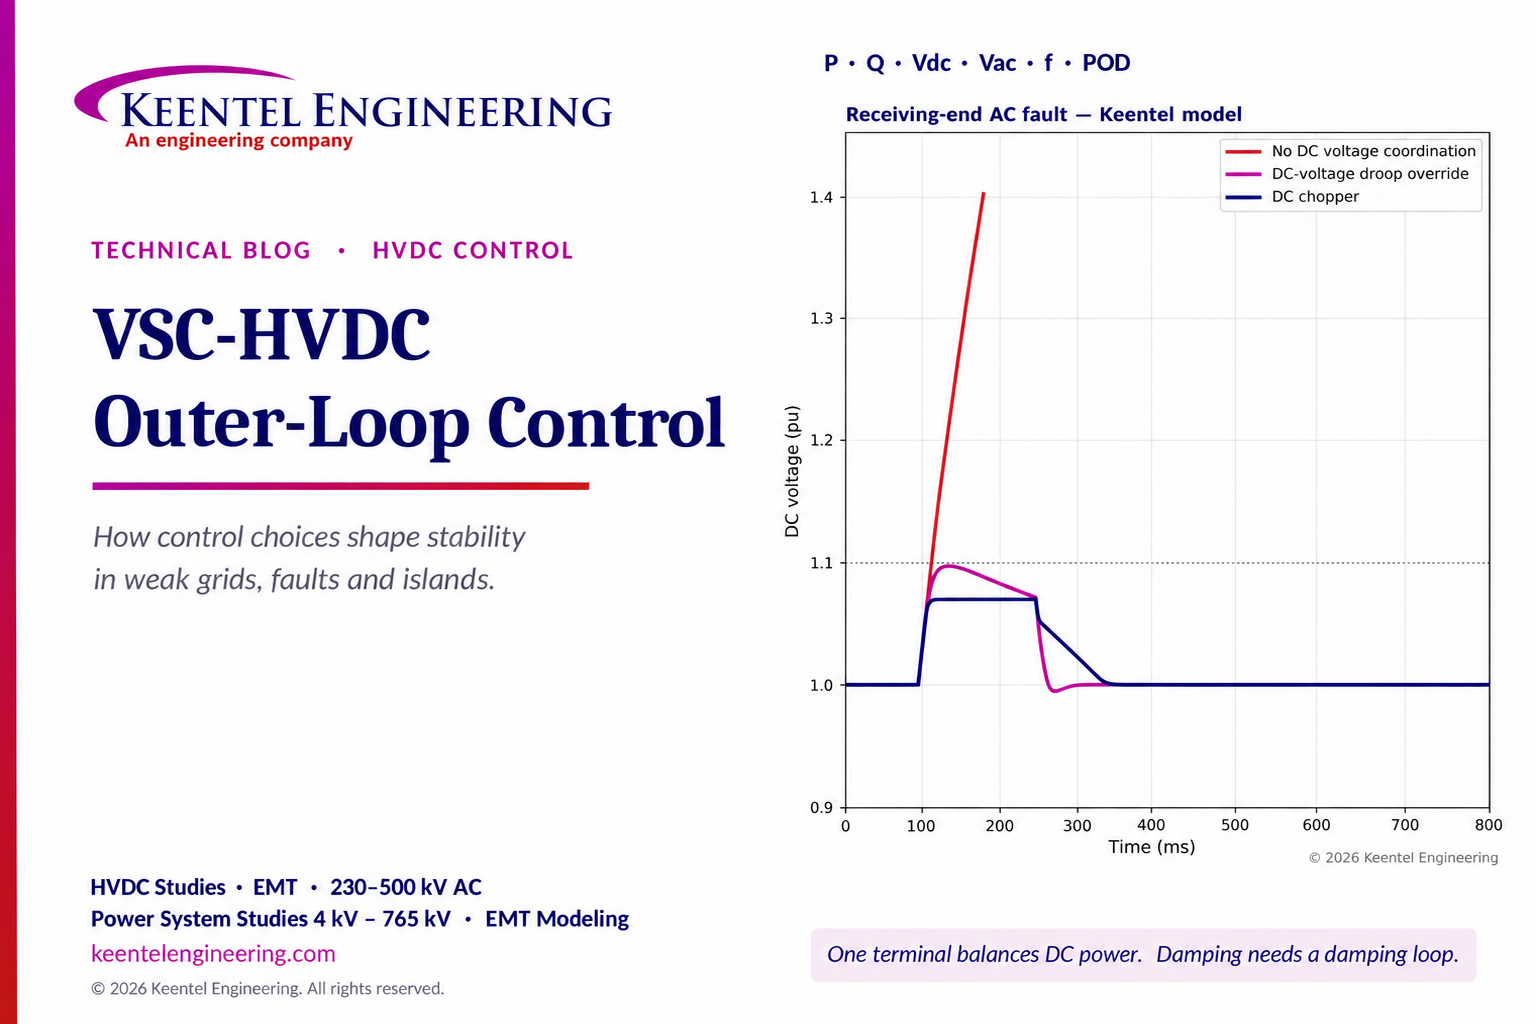
Explore VSC-HVDC outer-loop control for P, Q, DC voltage, weak-grid stability, fault ride-through and power oscillation damping with engineering models.
By SANDIP R PATEL
•
October 23, 2026
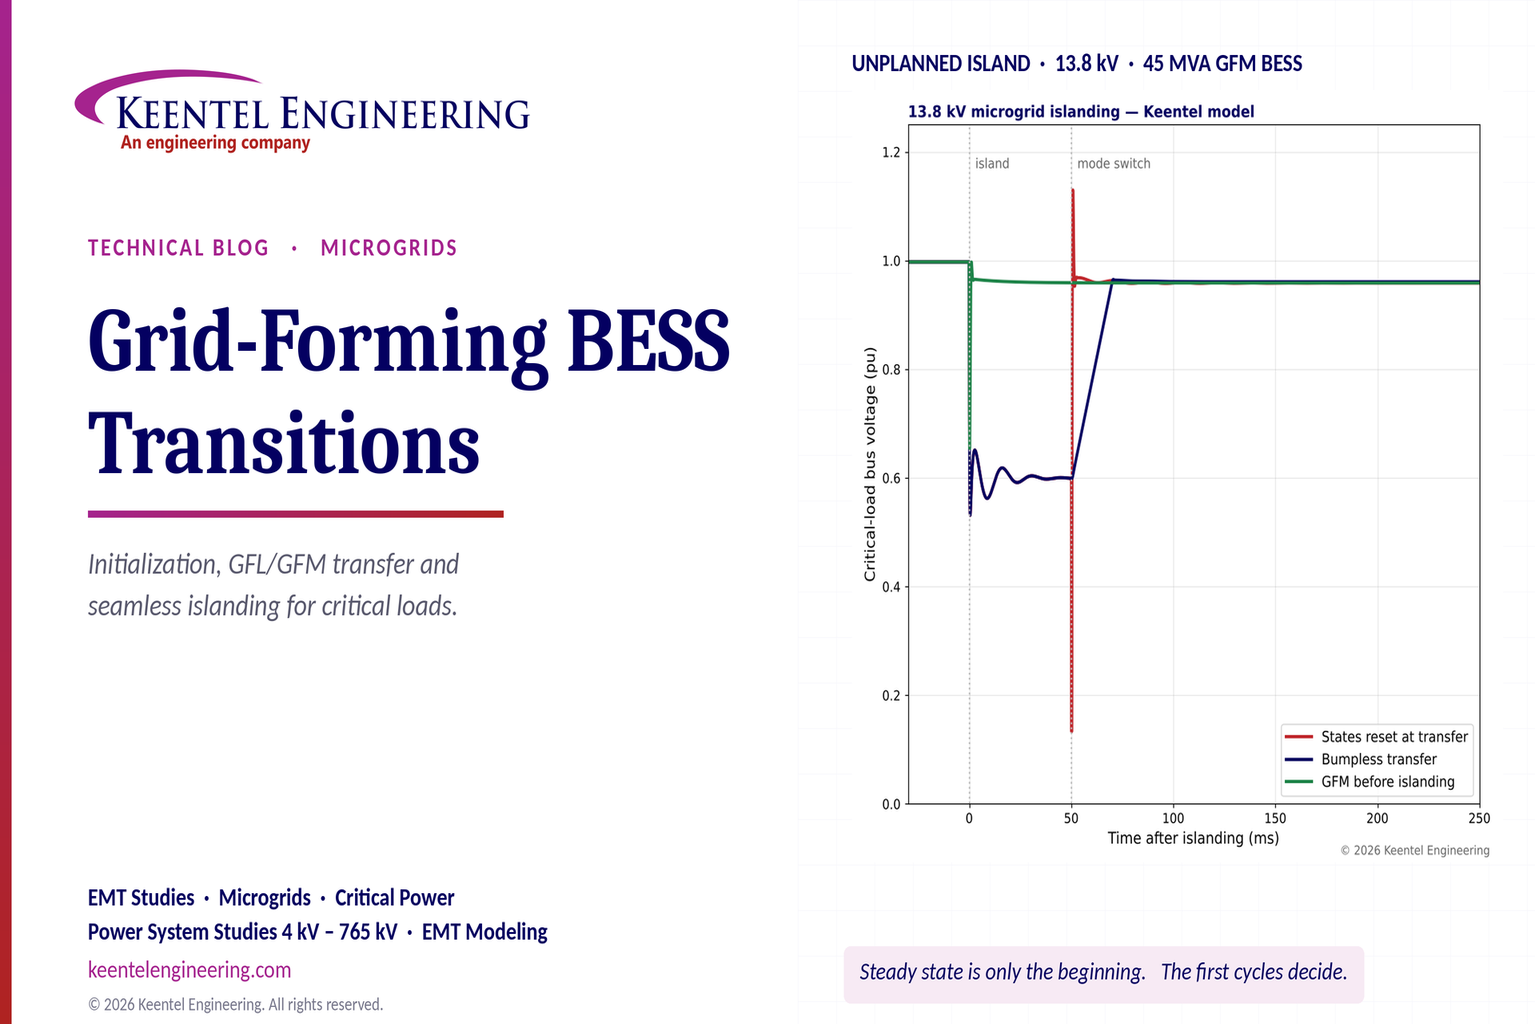
Explore grid-forming BESS initialization, GFL-to-GFM transitions, seamless islanding, EMT simulations, current limiting and microgrid protection.
By SANDIP R PATEL
•
October 23, 2026
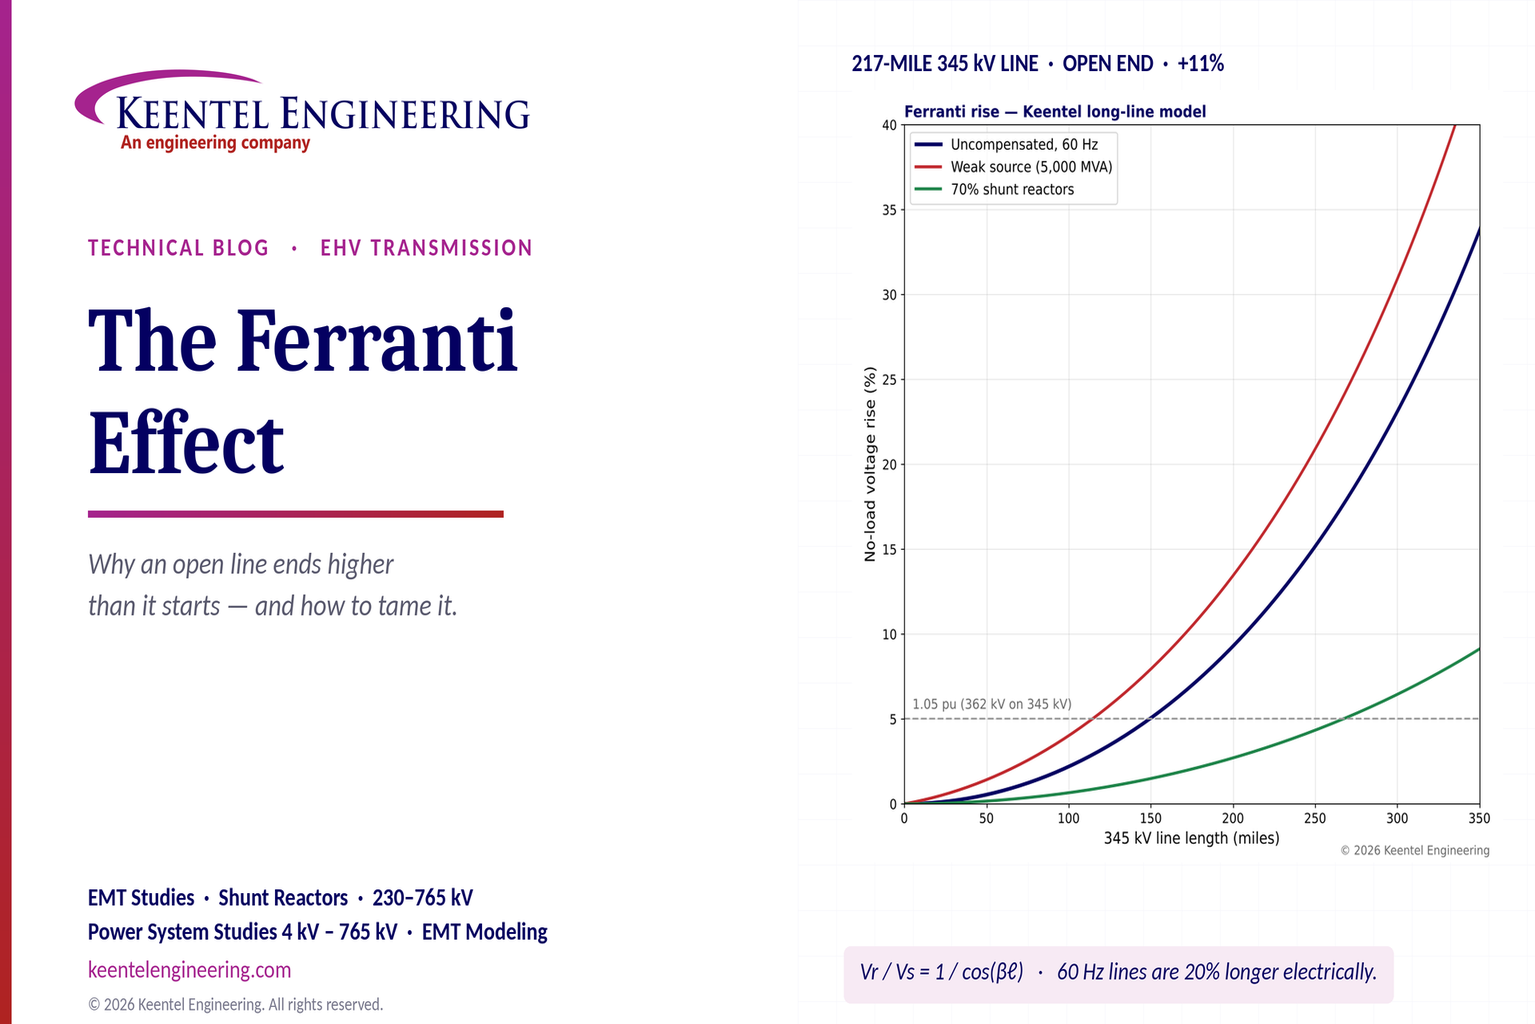
Explore the Ferranti effect in EHV transmission lines: voltage rise, 345 kV examples, switching overvoltages, shunt reactor sizing and mitigation.