
A Coordinated Electric System Interconnection Review—the utility’s deep-dive on technical and cost impacts of your project.
Challenge: Frequent false tripping using conventional electromechanical relays
Solution: SEL-487E integration with multi-terminal differential protection and dynamic inrush restraint
Result: 90% reduction in false trips, saving over $250,000 in downtime
ERCOT enforces all of the above through simulation, which means your model is your compliance case. The bar is now high:
- Whole-facility scope. The model must represent everything the IT load, the UPS and power conversion, the cooling plant, the protection and control systems in formats compatible with ERCOT's study platforms (PSS/E, PSCAD, TSAT).
- Real control loops, not approximations. Generic textbook representations are unacceptable. The model must capture the actual inner control behavior of your power electronics.
- Hardware-validated converter models. For electronic loads, the PSCAD model must be benchmarked against actual hardware testing including voltage ride-through and subsynchronous response. A model assembled from standard PSCAD library blocks fails by definition, because a generic block has never been tested against your vendor's hardware. The good news: validation is a hardware-type test, so results for a given converter product are reusable across every facility that uses it.
- Format migration. Facilities that previously submitted the older composite load model (CMLD) format must transition to EPRI's PERC1 format.
- Three checkpoints. Models are reviewed before the stability study begins (no model, no study), before each quarterly stability assessment, and for electronic loads one final time before energization, when you must submit as-built models with a documented comparison against the previously studied data and a sworn attestation that the model matches actual field settings. ERCOT's review takes 10 business days, extendable by 20 put it on your critical path.
- A living obligation. Change your technology, controls, or relay settings in a way that affects ride-through including converting a crypto mining site to an AI data center — and you've triggered a new interconnection study, even if your megawatts don't change.
| Parameter | Detail |
|---|---|
| System | 230 kV / 138 kV transmission corridors, wind and wet-snow icing exposure |
| Data basis | 15 years of minute-resolution forced-outage records + regional weather observations |
| Core methods | Event grouping, MVA performance curves, time-to-95%-restore, area outage rate curves, fragility modeling, rerun-history benefits, exceedance and log-domain risk metrics |
| Headline result | ≈85% of maximum resilience benefit at 60% of original capital; worst-event restoration window cut from 11 days to 5 in rerun-history terms |
| Decision supported | Capital portfolio selection; resilience plan filing; post-investment verification framework |
| System / Topic | Governing Standard(s) | What It Controls |
|---|---|---|
| Overall plant electrical distribution | IEEE 141 (Red Book); IEEE 666 | Distribution architecture, voltage selection, design of generating station auxiliary service systems |
| Power system studies | IEEE 399 (Brown Book); IEEE 551 | Load flow, symmetrical/asymmetrical short circuit, motor starting methodologies down to the lowest LV panelboard |
| Protection & coordination | IEEE 242 (Buff Book); IEEE 3004.5; IEEE C37 series | Generator relaying (21, 59N, 87G), time-current coordination, selective clearing between LV and MV tiers |
| GSU / UAT / SST transformers | IEEE C57.12.00 and C57 family | Transformer ratings, impedance, testing, loading |
| HV switchyard breakers | IEEE C37.06 | AC high-voltage circuit breaker preferred ratings |
| MV switchgear (13.8 kV) | IEEE C37.20.2; IEEE C37.20.7 | Metal-clad construction, compartmentalization, vacuum breakers; arc-resistant design with plenum venting |
| MV cable | UL 1072; ICEA S-93-639 (NEMA WC 74) | Type MV-105 shielded cable, 133% insulation level for HRG systems |
| LV switchgear (480 V) | IEEE C37.13; UL 1558 | Metal-enclosed LV power circuit breaker switchgear to 635 V, draw-out ACBs with electronic trip units |
| Motor control centers | UL 845; NEMA ICS 18 | LV-MCC construction, MCCB/MCP protection for motors under ~200 HP |
| Motors | NEMA MG-1 | Motor performance, starting characteristics, service factors |
| DC & battery systems | IEEE 485; IEEE 946 | Lead-acid battery sizing (125/250 VDC), DC auxiliary system design |
| Grounding | IEEE 80; IEEE 142 (Green Book) | Ground grid step/touch potential limits; system grounding including high-resistance grounding |
| Lightning protection | IEEE 998 | Direct-stroke shielding of switchyard and outdoor generator structures |
| Arc flash & electrical safety | IEEE 1584; NFPA 70E | Incident energy calculation; worker safety boundaries and PPE |
| Fire protection | NFPA 850 | Fire protection and risk management for combustion turbine generating plants |
| Installation code | NEC (NFPA 70); NESC | Wiring methods inside the plant fence; overhead/outdoor clearances at the switchyard |
| Interconnection & compliance | FERC LGIP; NERC MOD-025/026/027, PRC-019/024/029, FAC-008 | Interconnection process, model validation, protection/ride-through coordination, facility ratings |
| IFC / Construction Deliverable | Purpose |
|---|---|
| Stamped IFC packages | Legal basis for construction; P.E. responsible charge |
| Final relay settings & TCCs | Protection as-installed matches the coordination study |
| Calculation archive | Owner records; NERC audit evidence trail |
| Commissioning procedures | Safe, sequenced energization; MOD field testing |
| Construction support | RFIs, field changes, FAT/SAT witness |
| As-builts & model handoff | Operating baseline; future study currency |
| Metric | Outcome |
|---|---|
| Defects found pre-occupancy | Three topology defects and one settings-mismatch family corrected before load migration; the shared-switchboard defect alone would have invalidated the concurrently-maintainable claim on day one |
| IST findings | Fourteen additional discrepancies surfaced under scenario testing (control logic, alarm mapping, one generator sequencing fault) — all closed before handover instead of during operations |
| Black-building test | Passed on second execution; the first attempt exposed the generator sequencing fault under true block load, exactly the failure the compressed plan would never have found |
| Handover quality | Operations team certified on the actual failure scenarios; corrected EOPs and settings documentation delivered as controlled documents |
| Business outcome | Occupancy proceeded three weeks behind the original date — against an independent estimate that the uncorrected sequencing fault carried a high probability of a full facility outage within the first year |
Gigawatt-Scale Loads on the Bulk Power System
Jul 14, 2026 | Blog
Behaviors, Capabilities, and Limitations of Data Centers, AI Training Facilities, Cryptocurrency Mining, and Hydrogen Electrolysis — An Interconnection Engineering Perspective
About This Publication
This publication is part of the Keentel Engineering Technical Insight Series, developed to help utilities, developers, independent power producers, data center operators, and industrial energy users understand the engineering realities of interconnecting very large loads to the bulk power system. It synthesizes publicly available industry research — including the July 2026 report "Large Loads: Behaviors, Capabilities, and Limitations" published by the Energy Systems Integration Group (ESIG) Large Loads Task Force — together with Keentel Engineering's own interconnection, power system study, and compliance engineering experience.
All analysis, commentary, and recommendations in this document are Keentel Engineering's own. Where industry findings are discussed, they are summarized and interpreted in our own words; readers should consult the original ESIG publications at esig.energy for the source material.
Non-Affiliation Disclaimer
Keentel Engineering is an independent consulting engineering firm. Keentel Engineering is not affiliated with, endorsed by, or sponsored by the Energy Systems Integration Group (ESIG), NERC, ERCOT, PJM, CAISO, the Open Compute Project, ITIC, IEEE, or any equipment vendor, developer, or organization referenced in this document. All trademarks and report titles are the property of their respective owners and are referenced solely for identification and educational purposes.
Part 1 Technical Blog: When the Load Becomes the Largest Machine on the Grid
1. A New Class of Grid Citizen
For a century, power system planning treated load as the predictable side of the ledger. Generators were the complex machines that needed models, studies, and performance requirements; load was an aggregate — millions of motors, lights, and appliances whose statistical behavior smoothed itself out. That assumption has now been broken, decisively, by a new class of facility: single-site loads of 500 MW to 1.5 GW built around power electronics rather than iron and copper.
The July 2026 ESIG Large Loads Task Force report on large-load behaviors, capabilities, and limitations — one of eleven reports produced by that task force — confirms what interconnection engineers have been seeing in study queues for the past two years: the majority of forecast load growth over the next five years comes from hyperscale data centers, AI training campuses, cryptocurrency mining facilities, hydrogen electrolysis plants, and large manufacturing. These facilities do not behave like the loads embedded in legacy planning models. They ramp in seconds. They trip in milliseconds. They respond to token prices, electricity prices, and training-job schedulers rather than to weather and time of day. And because they interface with the grid through rectifiers, uninterruptible power supplies, and DC/DC converters, they bring converter dynamics — the same class of dynamics that reshaped generation interconnection over the past decade — to the demand side of the meter.
At Keentel Engineering, we have long argued that grid interconnection is a first-order engineering input, not a downstream administrative step. Nowhere is that more true than for gigawatt-class loads. A facility's internal power distribution architecture, UPS topology, cooling drive selection, and protection philosophy are made years before energization — and every one of those decisions determines how the facility will behave during the grid fault it will inevitably experience. This article walks through the behaviors, capabilities, and limitations of the three load classes reshaping interconnection queues — data centers (including AI campuses), cryptocurrency mining, and hydrogen electrolysis — and translates them into the study, modeling, and compliance work that developers and utilities must now perform.
2. Four Ways Large Electronic Loads Threaten Operational Security
Industry analysis converges on four distinct problem classes that large power-electronic loads introduce to bulk power system operation. Understanding which of the four applies to a given facility is the first step in scoping an interconnection study correctly.
The first is speed. Modern electronic loads can move hundreds of megawatts in seconds, and the power-electronics interface between the load and the grid introduces control-loop dynamics that legacy load models never contemplated. Highly variable AI training workloads, aggregated across a fleet of campuses, can consume balancing reserves that were procured against far slower load behavior.
The second is trip sensitivity. Electronic loads are protective by design — their protection settings exist to save servers, not to support the grid. When a transmission fault depresses voltage across a wide area, many large loads can reduce demand or disconnect simultaneously. Losing gigawatts of load in an instant produces the mirror image of a generation trip: over-frequency and over-voltage conditions with genuine cascading potential.
The third is forecastability. Cryptocurrency miners chase real-time energy prices. AI training facilities start and stop billion-parameter jobs at a scheduler's discretion. Neither behavior maps onto the weather-and-calendar regressions that underpin conventional short-term load forecasting, which complicates everything from reserve procurement to day-ahead unit commitment.
The fourth is power quality — harmonics and oscillations. Rectifier front ends, power factor correction stages, and variable frequency drives all emit harmonics and, under the wrong impedance conditions, can become the source of forced or converter-driven oscillations that interact with nearby synchronous generators. As we discuss below, these are no longer theoretical: they have been measured, replicated, and corrected at operating facilities.
| Characteristic | Traditional Data Center | AI Data Center | Crypto Mining | Hydrogen Electrolysis |
|---|---|---|---|---|
| Core technology | CPU/GPU servers, storage | GPU/TPU training clusters | ASIC mining rigs | PEM / alkaline / SOEC stacks |
| Backup power | UPS + generators | Checkpointing often replaces UPS | None (cost-driven) | UPS for safety loads only |
| Load profile | Stable, uptime-driven | Highly variable (training) | Stable until price signals | Stable baseload, contract-driven |
| Flexibility | Typically inflexible | Potentially flexible | Highly flexible | Potentially flexible |
| Ride-through basis | ITIC computer limits | ITIC computer limits | ITIC computer limits | No unified standard |
Keentel Insight
These four problem classes map directly onto four study products: dynamic and EMT modeling for speed, ride-through and protection coordination review for trip sensitivity, operational load characterization for forecastability, and harmonic/oscillation screening for power quality. An interconnection scope that omits any of the four is incomplete for a facility above roughly 100 MW.
3. Inside the Modern Data Center Power Chain
A large data center connects to the transmission system and steps utility voltage down through a familiar chain: a main power transformer to a medium-voltage network around 11 kV to 15 kV, medium-voltage distribution throughout the building with backup generators paralleled to those buses, and a final transformation to roughly 400 V AC at the server rack level. What makes the facility electrically interesting is not the transformers — it is everything between the medium-voltage bus and the silicon.
Nearly all compute and power equipment inside the facility is designed to the ITIC (formerly CBEMA) voltage tolerance curve, which defines the envelope of voltage magnitude and duration that IT equipment must withstand without damage or shutdown. When grid voltage exits that envelope, the facility transfers to its UPS or battery backup, and if the disturbance persists, to on-site generation. A facility with no backup will simply disconnect along the ITIC boundary.
Here is the problem, and it is the single most important concept in large-load interconnection today: the ITIC curve was written to protect computers, not the grid. Its voltage tolerances are misaligned with the disturbance profiles the bulk power system actually produces. A normally cleared transmission fault — well within the planning criteria every utility studies — can push voltage outside the ITIC envelope long enough to shed an entire campus. The load "worked as designed," and the grid inherited a gigawatt-scale contingency it never studied. This is precisely why dedicated large-load voltage ride-through requirements, written from the grid's reliability perspective rather than the server's, are emerging across the industry — and why ERCOT's NOGRR282 and NERC's developing large-load work matter so much to project schedules.
Compounding the misalignment is opacity. Data center operators and their vendors treat IT equipment specifications as confidential, so the interconnecting utility frequently cannot determine the voltage level at which the facility will actually disconnect. In our study practice, the ITIC curve serves as a reasonable default proxy for fault response modeling — but the modeler should always request the facility's actual ride-through characterization, and interconnection agreements should compel its disclosure.
3.1 The UPS: A Small Converter Plant Hiding Inside the Load
The double-conversion UPS is the workhorse of enterprise, colocation, and hyperscale facilities. Its front-end rectifier regulates a DC bus and manages grid-side power factor; its back-end inverter feeds the data center bus, buffering the load from grid-side distortion; a battery hangs on the DC bus, always ready. Three operating modes — normal, eco/bypass, and battery — are transferred between seamlessly. UPS runtimes vary with the business served: on the order of one to two minutes at hyperscale facilities, around five minutes for cloud and colocation, and ten to fifteen minutes where financial customers demand it.
Under a grid voltage sag, the DC bus sags with it. Because the IT load is constant-power, current rises as voltage falls — and if the rectifier hits its current limit, it blocks and shuts down, transferring the facility to UPS power. Recovery is asymmetric: a facility riding on its UPS can return to the grid within seconds, but a facility that has transferred to backup generation cannot. Backup generators carry minimum run times, typically twenty to thirty minutes, which means the load does not come back when the fault clears. Operators and balancing authorities must plan restoration around that constraint.
AI training campuses increasingly skip the UPS altogether for IT load. Training jobs checkpoint their state to protected storage; if power fails, the run restores from the last snapshot, and the economics of a campus-scale UPS simply do not justify the training progress it would save. The grid-facing consequence is a facility with even less inherent ride-through than its enterprise cousins — a fact that must be represented honestly in study models.
3.2 Documented Oscillations: The Load as a Source, Not a Victim
The most consequential field evidence in the recent industry literature concerns oscillations that originate inside data centers. In one documented test program, an operator brought a full complement of servers to load and then idled them synchronously. At high load, a fleet of forty UPS units arranged in twenty pairs began to oscillate, with the onset point governed by feed inductance and unit loading. Removing one UPS pair from the utility feed — reducing the effective impedance seen by the remaining pairs — stopped the oscillation. The behavior was replicated in simulation and in factory testing with the manufacturer by representing the utility-side inductance, and the permanent fix was a reduction in the loop gain of the rectifier's power factor correction circuit to restore adequate phase margin.
The same operator later encountered a second, distinct instability in a power supply PFC stage — this one appearing at sites both with and without UPS units, at much higher frequency, in the ninth-to-eleventh harmonic range, and resolved through a vendor firmware change to the rectifier control. In a separate case, oscillations were triggered not by anything inside the facility but by the utility removing one of two parallel transformers, raising the source inductance feeding the UPS fleet.
Three lessons follow. First, converter-driven instability on the demand side is real, measured, and sensitive to grid impedance — meaning it is a function of the interconnection, not just the equipment. Second, models that omit the UPS PFC stage cannot screen for the phenomenon; positive-sequence phasor-domain models alone are structurally blind to it, which is why EMT representation of the power conversion chain is becoming a study requirement for large facilities in low short-circuit-ratio areas. Third, high-resolution monitoring — phasor measurement units and digital fault recorders at the point of interconnection and within the facility — is the only way operators gain situational awareness of these interactions before they propagate.
Keentel Insight
Every one of these documented events was diagnosed, replicated, and corrected through the combination of field measurement and validated EMT modeling — the same discipline the industry spent a decade building for inverter-based generation. Developers who invest in facility-level EMT models during design, rather than after an event, protect both their energization schedule and their neighbors on the grid.
3.3 Architectures in Motion: From 415 V AC to 800 V DC
Rack power density is forcing a redesign of the entire internal distribution chain, and each architecture generation changes the facility's dynamic signature at the point of interconnection. The conventional design delivers medium voltage to a step-down transformer, through a double-conversion UPS, to in-rack power supplies converting roughly 415/480 V AC to 54 V DC. The Open Compute Project's ORV3 generation moves the battery backup function into the rack alongside the power supply. As machine-learning racks head toward 500 kW and beyond, the industry is standardizing on 400 V DC distribution: a "sidecar" power rack takes in low-voltage AC, converts it to 400 V DC, and distributes it to adjacent compute racks, where DC/DC converters step down to 54 V. Full-bridge LLC resonant conversion inside 18 kW power supply modules, combined six to a shelf, enables roughly 400 kW per rack.
The next step is building-level DC. In the "Northstar"-class architecture, a solid state transformer — or a large rectifier — converts medium voltage AC (11 kV to 35 kV) directly to 400 V DC at the facility level, eliminating conversion stages. Nvidia has proposed an 800 V DC ecosystem for AI factories supporting megawatt-class racks: 13.8 kV AC is converted to 800 V DC at the data center perimeter, transmitted via busway through the halls, and stepped down to 54 V/12 V inside the rack, carrying substantially more power through the same conductor cross-section and shedding multiple AC/DC stages along the way.
For the power system engineer, each of these designs changes what must be modeled. The sidecar converter, the solid state transformer, the facility-level rectifier, and even the final DC/DC stage each contribute to the facility's fault response and its harmonic and oscillatory potential. Solid state transformers in particular are active power-electronic devices with their own control loops — coupled with storage, they can be engineered to deliver ride-through, which makes them both a modeling obligation and a compliance opportunity. Study models built for the conventional architecture cannot simply be reused for a 400 V DC or 800 V DC facility.
3.4 Cooling: The Quiet Ride-Through Liability
Cooling can consume 30 to 40 percent of a data center's electricity at the top of the range, and nearly every fan and pump in a modern facility is driven by a variable frequency drive or electronically commutated motor. VFDs carry their own ride-through settings, programmed independently of the IT equipment — and a cooling system that trips during a fault will force the compute floor down minutes later regardless of how well the servers rode through. Facility ride-through is therefore a chain with two links, and the weaker one governs. VFD parameters at large facilities should be reviewed and set so that normally cleared faults do not remove cooling, and facility-level models must represent the cooling drives, not just the IT power chain. Cooling design also drives PUE and therefore the total energy forecast the interconnecting utility must plan around.
4. AI Workloads: The Most Dynamic Load Ever Connected
AI campuses share the physical building blocks of conventional data centers, but their workloads produce electrical behavior with no precedent at this scale. The distinction begins with the silicon: GPU clusters optimized for matrix mathematics operate in large, synchronized groups, and that synchronization stamps itself onto the facility's power draw.
Training is the extreme case. The backpropagation cycle that dominates model training alternates between phases — a forward pass that spikes compute demand, a loss calculation that relaxes it, a backward pass that spikes it again, and a weight update that relaxes it — and the facility's aggregate load follows this rhythm in a repetitive sawtooth. Training campuses idle at roughly 60 to 70 percent of peak simply to maintain readiness, then swing between partial idle and full load as jobs progress. Because a synchronized training job requires every node, a single machine failure halts the entire run: 30 to 50 percent of active facility load can vanish within microseconds, then return as the job auto-reconfigures and restarts — a cycle that can repeat tens of times per day. At the individual GPU the power step is nearly instantaneous, though the supporting power supply's capacitance and control loops stretch the facility-level ramp to roughly fifty milliseconds.
Inference is gentler but far from benign. Its baseline is low, punctuated by request bursts that swing the load between idle and near-peak; aggregate inference fleets have exhibited power reductions of 80 to 90 percent in under a second. Fine-tuning sits between the two. And the trend line is adverse: rack-level measurements comparing prior-generation and current-generation GPUs show that power-swing potential is growing with each hardware generation, driven in part by liquid-cooled GPU architectures. Aggregation across racks and modules reshapes but does not eliminate the variability seen at the point of interconnection.
Distributed deep learning adds a systemic dimension. Training jobs now span multiple campuses — sometimes in different balancing areas. When one participating site experiences a grid fault and trips, it signals its partners to pause, and multiple multi-hundred-megawatt facilities may reduce demand together. A coordinated, effectively instantaneous loss of several gigawatts of load is an over-frequency event of the first order: it can force generators to run back or trip, and in the extreme, cascade. Planning coordinators need to treat correlated multi-site load loss as a studied contingency, not a hypothetical — and the size of that contingency is a moving target as training fleets grow.
| Aspect | Traditional Compute | AI Workload |
|---|---|---|
| Rack power density | 10–15 kW per rack | 30 kW+ per rack, heading to 500 kW–1 MW |
| Load variability | Stable, predictable | Highly variable, bursty, synchronized |
| Transition drivers | Few; mostly steady | Training / fine-tuning / inference phases |
| Failure signature | Localized, negligible | 30–50% facility load loss in microseconds |
| Grid concern | Aggregate energy | Oscillation forcing, reserve exhaustion, over-frequency |
The variability question ultimately becomes an oscillation question. Repetitive training cycles at the wrong frequency, at gigawatt scale, constitute a forced oscillation source that can excite inter-area modes or torsional modes at nearby synchronous machines. Frequency-domain screening of the facility's expected load spectrum against known system modes belongs in the interconnection study scope for any large AI campus.
4.1 The Flexibility Toolbox
The same characteristics that make AI training disruptive also make it the most promising flexibility resource among large loads. Training is an offline process without enterprise latency commitments: it can pause, throttle, and resume. A 2025 field demonstration in Phoenix by Emerald AI, Nvidia, the Salt River Project, and EPRI showed software-based load shaping using job pausing and dynamic frequency scaling of GPU clocks and voltage. Google has published compiler-level techniques that schedule and balance training jobs across time to smooth power flow, and non-critical jobs can be shifted to data centers on entirely different power systems as a form of demand response.
Hardware complements software. Supercapacitor systems — rack-mounted or facility-level — absorb and inject power over millions of cycles with response speeds that bridge the gap between server power supplies and the UPS, smoothing transients before they reach the grid; commercial offerings now span rack-mounted supercapacitor shelves to transmission-class E-STATCOM solutions. Battery systems, including containerized megapack-class units, add energy depth for longer smoothing horizons and steeper swings. In our assessment, code-level and scheduler-level mitigation is the least capital-intensive first line, with capacitive and battery hardware sized against whatever residual variability the software cannot remove — and the interconnection agreement should specify the performance the combination must achieve at the POI.
Flexibility has limits, and contracts define them. Colocation facilities carry customer uptime obligations, and in multi-tenant buildings the tenant, not the operator, controls the compute — and therefore the megawatts. Grid programs that assume the facility operator can curtail on request will fail at exactly the facilities where contracts say otherwise. Flexibility must be engineered and contracted at interconnection, not assumed afterward.
5. Cryptocurrency Mining: The Price-Following Gigawatt
Cryptocurrency mining is the purest economic load on the grid: an arbitrage that converts energy into currency. That single fact explains nearly all of its electrical behavior. Facilities are built lean — thousands of single-phase ASIC rigs fed through step-down transformers from a 34.5 kV-class distribution intertie, with no UPS and no backup generation, because every dollar of resilience equipment erodes a business that typically returns 20 to 40 percent on investment. Auxiliary load for safety, security, and environmental control runs only 1 to 5 percent of the facility.
Under normal conditions miners run flat out, targeting fleet PUEs as low as roughly 1.04, with load shaped mainly by ambient temperature's effect on cooling. But when energy prices rise above the value of the coin being mined, the load simply leaves. Most large miners in ERCOT participate in Load Acting as a Resource, others clear demand response day-ahead, and essentially all self-curtail on price. Facilities can typically shed to 20 percent of load on request — 5 percent if pressed — and can traverse from near-zero to full load in anywhere from 20 seconds to 20 minutes. Restoration after a trip or curtailment is similarly fast, usually within about 20 minutes as cooling systems re-establish. For the balancing authority, this is a load whose short-term forecast error is driven by commodity prices and whose ramps rival utility-scale batteries — which, not coincidentally, are the resource best suited to buffering them.
Ride-through behavior tracks the ITIC curve, with real hardware measured close to — and in places short of — its boundaries. Experimental testing of a widely deployed ASIC model demonstrated continuous operation from 66 to 130 percent of rated voltage, but a zero-voltage withstand of only 9.5 milliseconds against the 20 milliseconds contemplated by ITIC. Ride-through capability is set by on-board capacitor sizing, and retrofitting deeper capability is economically unattractive; ERCOT has already logged multiple events in which fleets of miners failed to ride through disturbances and dropped in unison, perturbing system frequency.
Simulation work has also shown that harmonic interaction with nearby inverter-based resources — a solar plant, in the published case — can trip mining power supplies in low short-circuit-ratio areas. VFD-driven cooling adds a second trip path: a documented facility tripped three times on single-phase voltage sags before its VFD ride-through parameters were corrected.
Power quality closes the picture. ASIC fleets present a leading power factor near 0.99 and emit characteristic triplen harmonics. With a delta-grounded-wye interconnection transformer, the delta winding traps triplen currents and the transmission system sees compliant distortion — measured facilities have recorded voltage THD near 4.3 percent and current THD near 9.2 percent, inside IEEE 519 limits. Without the delta winding, third and fifth harmonic injection can exceed IEEE 519 and demand filtering. Transformer vector group selection, harmonic screening against IEEE 519, and permanent power quality monitoring at the POI are therefore baseline interconnection requirements for mining facilities, not optional extras.
Keentel Insight
Mining interconnections succeed or fail on three studies: a harmonic assessment that reflects the actual substation transformer vector group, a ride-through review that treats the ITIC curve as a proxy pending vendor data, and an operational characterization that gives the balancing authority honest ramp and restoration parameters. All three are inexpensive relative to the cost of a post-energization mitigation retrofit.
6. Hydrogen Electrolysis: The Electrochemical Large Load
Electrolytic hydrogen remains a small fraction of global production today, but electrolyzer capacity is compounding — global installed capacity reached 1.4 GW in 2023, doubling in a single year, with several times that reaching final investment decision since. Individual projects now enter interconnection queues at 100 MW-plus, built up from modular stacks, and their electrical character differs fundamentally from the compute loads above: the constraint is electrochemistry, not silicon.
The facility's load anatomy is dominated by the stack itself, with the balance spread across conversion, compression, water treatment, and cooling. The rectifier plant is the grid interface and the design decision that matters most for power quality: large facilities have historically used thyristor-based silicon-controlled rectifiers in 6-, 12-, or 24-pulse configurations — robust and cost-effective at high power, but heavy consumers of reactive power, exposed to commutation failure, and reliant on pulse multiplication or DSTATCOM-class mitigation to control characteristic fifth and seventh harmonics. IGBT-based rectifiers deliver better harmonic performance, power factor, and weak-grid behavior, and are gaining share, though with current limits that constrain them at the largest stack ratings, higher switching losses, and higher cost. Paired rectifier transformers with staggered vector groups are the standard tool for canceling low-order harmonics and smoothing DC ripple to the stacks.
| Facility System | Share of Load | Electrical Character |
|---|---|---|
| Electrolyzer stacks | 65–75% | DC via rectifiers; the production load |
| Power conversion | 5–10% | Rectifier/transformer losses, controls |
| H2 compression | 10–15% | VFD-driven motor load; pressure-dependent |
| Water purification | 2–5% | Pumps, deionization; continuous |
| Cooling systems | 5–10% | Pumps, blowers; technology-dependent |
| Controls & auxiliaries | <1–2% | SCADA, safety, HVAC; must never lose power |
Four electrolyzer technologies define the design space. Alkaline units are the mature workhorse, preferred at stable baseload, with liquid electrolytes that slow their response. PEM units use solid polymer membranes and respond fast enough to track renewables and provide frequency service. Solid oxide cells run hot on steam with strict thermal management, and anion exchange membrane technology aims to combine PEM-class response with alkaline-class capital cost. The operating envelope follows the chemistry: PEM ramps on the order of 1 to 20 percent of DC current per second, alkaline more like 0.5 to 2 percent per minute; warm starts recover full load in roughly 5 to 30 minutes while cold starts run from a few minutes for PEM to an hour or two for alkaline; and alkaline plants carry a hard minimum turndown — typically 5 to 25 percent — below which hydrogen-oxygen crossover creates an explosive safety limit, not merely an efficiency preference.
Demonstrations have established that electrolyzers can deliver real grid services: sub-second setpoint following, primary frequency response in both directions, synthetic inertial response, and reactive power support have all been shown in laboratory hardware-in-the-loop environments and at operating megawatt-scale plants. Whether those capabilities are compensated as ancillary services or mandated through interconnection requirements is a jurisdictional question — but the technical capability exists, and facility control hierarchies can be architected for it from day one.
Ride-through is the open frontier. Unlike computer loads with their de facto ITIC basis, electrolyzer facilities have no unified ride-through standard; capability is limited by the electrochemical process behind the stack rather than by the converters, jurisdictional requirements vary, and published example envelopes — riding through deep sags for tenths of a second and wide frequency bands for defined durations, with post-fault recovery ramps around 10 to 15 percent per second — are illustrative rather than prescriptive. Supplementary storage can extend capability at a project-specific cost. Interconnection agreements for hydrogen must therefore negotiate ride-through explicitly, informed by the specific stack technology, rectifier design, and safety chain — a genuinely bespoke engineering exercise on every project.
7. What This Means for Interconnection Engineering
Pull the threads together and a clear engineering agenda emerges for any party interconnecting — or hosting — a large load.
Modeling must reach inside the fence. Positive-sequence dynamic models remain necessary for planning studies, but they cannot capture rectifier PFC instability, harmonic interaction with nearby inverter-based resources, or sub-cycle trip behavior. For large facilities, especially in low short-circuit-ratio regions, validated EMT models representing the actual power conversion chain — UPS stages, sidecar converters, solid state transformers, VFD-driven cooling, rectifier plants — are becoming the standard of care, exactly as they did for inverter-based generation. Where the facility transfers to backup generation, minimum run times belong in restoration modeling.
Performance requirements must be written from the grid's perspective. The ITIC curve is a design convention, not a reliability standard. Utilities and ISOs are moving to dedicated large-load ride-through requirements, harmonic limits enforced at the POI under IEEE 519, oscillation screening, and telemetry obligations including PMU-class monitoring. Developers who engage these requirements at design — selecting transformer vector groups, specifying VFD ride-through parameters, sizing supplementary storage, architecting control hierarchies — interconnect faster and cheaper than those who retrofit.
Flexibility should be engineered, not assumed. AI training, crypto mining, and electrolysis each offer genuine flexibility, but bounded by contracts, chemistry, and economics respectively. The honest path is to characterize what the facility can actually deliver — ramp rates, notice requirements, minimum loads, restoration times — and embed it in the interconnection agreement and market registration.
Keentel Engineering works both sides of this problem: for developers, we prepare interconnection applications, facility one-lines, PSS/E and PSCAD/EMTDC models, ride-through assessments, harmonic and oscillation studies, and NERC compliance programs; for utilities and owners, we serve as owner's engineer reviewing large-load interconnection requests, drafting performance requirements, and validating the models submitted to us. Gigawatt-class loads are the defining interconnection challenge of this decade. The engineering to integrate them reliably exists — it simply has to be applied early, and applied well.
Work With Keentel Engineering
Planning a data center, AI campus, mining facility, or hydrogen plant interconnection — or receiving one into your system? Contact our power systems team at contact@keentelengineering.com or (813) 389-7871 to scope the studies, models, and compliance program your project needs.
Part 2 — Frequently Asked Questions: Large Load Interconnection
The questions below reflect what developers, utilities, and facility operators most often ask Keentel Engineering about interconnecting
data centers AI campuses, cryptocurrency mining facilities, and hydrogen electrolysis plants to the bulk power system.
1. Why are large loads suddenly a grid reliability issue when load has always existed?
Scale and technology changed at the same time. Historically, load was an aggregate of millions of small devices whose behavior averaged out; no single customer could move system frequency. Today a single site can draw 500 MW to 1.5 GW — comparable to a large power plant — and it connects through power electronics with millisecond-scale control and protection. When one facility can ramp, oscillate, or trip at that scale, it becomes a contingency in its own right, and it needs the same modeling, performance, and study rigor the industry applies to large generators.
2. What are the four main operational risks large electronic loads create?
First, speed: power-electronic loads can ramp hundreds of megawatts within seconds, stressing balancing reserves. Second, trip sensitivity: protection tuned to save IT equipment can shed many facilities simultaneously during a fault, creating over-frequency and over-voltage conditions with cascading potential. Third, forecastability: price-following miners and scheduler-driven AI training defeat conventional load forecasting. Fourth, power quality: rectifiers, PFC stages, and VFDs emit harmonics and can source forced or converter-driven oscillations that interact with nearby generators.
3. What is the ITIC curve, and why does "ITIC-compliant" not mean "grid-friendly"?
The ITIC (formerly CBEMA) curve defines the voltage magnitude and duration envelope that information technology equipment should withstand without damage or shutdown. Nearly all data center and mining hardware is designed to it. But the curve was written to protect computers, not to keep load connected through power system disturbances — its tolerances are misaligned with real transmission fault profiles. A normally cleared fault can push voltage outside the ITIC envelope long enough to disconnect an entire campus even though every device performed exactly as designed. That is why grid operators are developing dedicated large-load ride-through requirements written from the reliability perspective, and why interconnection studies should treat ITIC only as a default proxy until the facility provides its actual ride-through characterization.
4. What happens electrically inside a data center when grid voltage sags?
The double-conversion UPS rectifier regulates a DC bus; when grid voltage drops, the DC bus drops with it. Because IT equipment is a constant-power load, current rises as voltage falls. If the rectifier reaches its current limit it blocks and shuts down, transferring the load to UPS battery power. If voltage recovers quickly, the UPS transfers back to the grid and recharges within seconds. If the disturbance persists beyond the UPS runtime — roughly one to two minutes at hyperscale sites, five minutes for cloud and colocation, ten to fifteen minutes for financial-grade facilities — the site transfers to backup generation, and minimum generator run times of about twenty to thirty minutes prevent immediate reconnection.
5. Can a data center really cause oscillations on the power system?
Yes — this has been measured in the field, not just theorized. In one documented case, forty UPS units arranged in twenty pairs began oscillating at high server load; the onset depended on feed inductance and unit loading, the behavior was replicated in models and factory tests, and the fix was reducing the loop gain of the rectifier power factor correction circuit to restore phase margin. A second instability appeared in a power supply PFC stage in the ninth-to-eleventh harmonic range and was fixed through a vendor control modification. A third event was triggered by the utility removing one of two parallel transformers, which raised the source impedance. The common thread: these are impedance-sensitive converter control interactions, which means they depend on the interconnection itself and can only be screened with models that represent the power conversion stages.
6. Why do interconnection studies for large loads now require EMT modeling in addition to PSS/E-class models?
Positive-sequence phasor-domain models represent the network at fundamental frequency with simplified dynamics; they are essential for planning but structurally blind to sub-cycle behavior, rectifier control instability, harmonic interaction, and PFC loop dynamics. The documented data center oscillation cases could only be replicated in models that included the UPS PFC stage and realistic utility-side inductance. For large facilities — particularly in low short-circuit-ratio areas or near other inverter-based resources — validated EMT models in tools such as PSCAD/EMTDC, representing the actual conversion chain (UPS, sidecar converters, solid state transformers, rectifier plants, VFD cooling), are becoming the standard of care, mirroring what the industry already requires of inverter-based generation.
7. How do AI training workloads differ electrically from conventional data center loads?
Conventional enterprise and cloud loads are stable and uptime-driven. AI training runs synchronized GPU clusters through the backpropagation cycle — forward pass, loss calculation, backward pass, weight update — producing a repetitive sawtooth power profile. Training campuses idle around 60 to 70 percent of peak to stay ready, and because a synchronized job needs every node, a single machine failure can drop 30 to 50 percent of active facility load within microseconds, then restore as the job restarts — potentially tens of times per day. Inference swings between idle and near-peak as request bursts arrive, with aggregate reductions of 80 to 90 percent observed in under a second. Rack-level data also shows power-swing potential increasing with each GPU generation.
8. What is the distributed training risk that grid operators worry about?
Large models are increasingly trained across multiple data centers simultaneously. If one participating site trips on a grid fault or communication failure, it signals partner sites to pause the shared job — so several multi-hundred-megawatt facilities can reduce demand at effectively the same moment, potentially across a whole balancing area or interconnection. An abrupt multi-gigawatt load loss is an over-frequency event that can force generators to run back or trip and, in the extreme, cascade. Planning coordinators should study correlated multi-site load loss as a defined contingency, recognizing that its credible size grows as training fleets expand.
9. Do AI data centers use UPS systems like conventional data centers?
Often not for the IT load. Training facilities checkpoint their work — saving model state to protected storage — so a power loss costs only the progress since the last snapshot. At campus scale, the capital cost of a UPS fleet rarely justifies the training progress it would preserve, so many AI facilities omit it (mixed-use campuses may still install UPS for their traditional tenants). The grid-facing consequence is less inherent ride-through capability, which must be reflected honestly in interconnection models and, where required, compensated with facility-level storage or solid-state-transformer-plus-storage designs.
10. What options exist to smooth AI-driven power fluctuations?
Software first: job pausing and dynamic frequency scaling of GPU clock and voltage were demonstrated in a 2025 utility field pilot; compiler-level scheduling can balance training jobs across time; and non-critical jobs can shift to data centers on other power systems as demand response. Hardware second: supercapacitor systems at rack or facility level absorb and inject power over millions of cycles with response speeds that bridge server power supplies and the UPS, while battery systems add energy depth for longer smoothing. The economical design usually applies code- and scheduler-level mitigation first, then sizes capacitive or battery hardware against the residual — with the required performance defined at the point of interconnection in the interconnection agreement.
11. How do the new 400 V DC and 800 V DC data center architectures affect interconnection studies?
Each architecture generation changes the facility's dynamic signature. The sidecar approach converts low-voltage AC to 400 V DC in a dedicated power rack serving adjacent compute racks; building-level designs use a solid state transformer or large rectifier to convert medium voltage directly to 400 V DC; and proposed 800 V DC ecosystems convert 13.8 kV AC to 800 V DC at the facility perimeter for megawatt-class racks. Fewer conversion stages improve efficiency, but the site-level converter becomes the dominant grid interface — an active power-electronic device with its own control loops, fault behavior, and harmonic profile. Models built for conventional UPS-based architectures cannot be reused; the sidecar converter, SST, and even the 400/800-to-54 V DC stage may each need representation depending on the design.
12. Why does the cooling system matter to ride-through?
Nearly all data center and mining cooling fans and pumps are driven by variable frequency drives or electronically commutated motors, and VFDs carry their own ride-through settings programmed independently of the IT equipment. If cooling trips during a fault, the compute floor must shut down shortly afterward to protect the hardware — regardless of how well the servers rode through. Facility ride-through is a two-link chain and the weaker link governs. Documented mining facility trips have been traced to VFD low-voltage settings on single-phase sags and corrected by reparameterization. VFD ride-through review should be a standard item in large-load interconnection and commissioning scopes.
13. How flexible is cryptocurrency mining load, really?
Extremely — it is the most flexible large load class on the system, because mining is an energy-price arbitrage. Most facilities can reduce consumption on request to about 20 percent of load (auxiliary and environmental systems), curtail to 5 percent if needed, and traverse from near-zero to full load in 20 seconds to 20 minutes; restoration after a trip typically completes within about 20 minutes as cooling re-establishes. In ERCOT, most large miners participate in the Load Acting as a Resource program and self-curtail whenever energy cost exceeds mining revenue. The planning caveats: some facilities need hours of notice, ramps at this speed challenge balancing reserve procurement, and price-driven behavior injects commodity-market volatility into short-term load forecasts.
14. What power quality issues are characteristic of mining facilities?
ASIC fleets are single-phase rectifier loads operating at a leading power factor near 0.99 and emitting triplen (third-order multiple) harmonics. With a delta-grounded-wye interconnection transformer, triplen currents circulate in the delta winding and the transmission system sees compliant distortion — measured large facilities have recorded voltage THD near 4.3 percent and current THD near 9.2 percent, within IEEE 519. Without a delta winding, third and fifth harmonic injection can exceed IEEE 519 and require filtering; some mining unit models have tripped offline in the field under harmonic distortion and voltage fluctuation. Transformer vector group selection, an IEEE 519 harmonic study, and permanent power quality monitoring at the POI should be treated as baseline interconnection requirements.
15. Do cryptocurrency miners ride through faults?
Approximately to the ITIC envelope, and sometimes short of it. Experimental testing of a widely deployed ASIC model showed continuous operation from 66 to 130 percent of rated voltage but a zero-voltage withstand of only 9.5 milliseconds versus the 20 milliseconds contemplated by ITIC. Ride-through depth is set by on-board capacitor sizing, and adding capacitors or batteries for deeper capability is generally uneconomic for miners. ERCOT has recorded multiple events in which mining fleets failed to ride through disturbances and dropped in unison, perturbing frequency; simulation has also shown harmonic interaction with nearby solar plants tripping miner power supplies in low short-circuit-ratio areas. For studies, use the ITIC curve as the ride-through proxy unless the facility provides measured data.
16. How do the main electrolyzer technologies compare for grid purposes?
Alkaline (AEL) is the mature, lowest-cost workhorse, preferred at stable baseload, with liquid electrolytes that slow response (ramp roughly 0.5 to 2 percent per minute) and a hard minimum turndown of typically 5 to 25 percent below which hydrogen-oxygen crossover creates an explosive safety limit. PEM uses solid polymer membranes, ramps roughly 1 to 20 percent of DC current per second, tolerates pressure, and suits renewable-following and frequency services. Solid oxide (SOEC) runs at high temperature on steam with strict thermal management and can also convert CO2 and steam to syngas. Anion exchange membrane (AEM) is developmental, targeting PEM-class response at alkaline-class cost. Warm starts recover full load in roughly 5 to 30 minutes; cold starts range from a few minutes (PEM) to one or two hours (alkaline).
17. What drives rectifier selection at a hydrogen plant, and why does it matter to the utility?
The rectifier plant is the facility's grid interface. Thyristor-based SCR rectifiers in 6-, 12-, or 24-pulse configurations dominate large installations — robust and cost-effective at high power, but heavy reactive power consumers exposed to commutation failure, whose characteristic fifth and seventh harmonics must be managed through pulse multiplication, staggered rectifier-transformer vector groups, or DSTATCOM-class mitigation. IGBT rectifiers offer better harmonic performance, power factor, and weak-grid behavior and are gaining share, but are current-limited at the largest stack ratings and carry higher switching losses and cost. The choice determines the harmonic study results, reactive compensation requirements, and minimum short-circuit strength the interconnection must provide — line-commutated designs in particular need adequate short-circuit power at the POI.
18. Can electrolyzers provide grid services?
Technically, yes — demonstrations have shown sub-second setpoint following, primary frequency response in both directions, synthetic inertial response, and reactive power/voltage support in hardware-in-the-loop environments and at operating megawatt-scale plants. Post-fault recovery ramps around 10 to 15 percent per second have been characterized. The constraints are electrochemical (alkaline response speed, minimum turndown) and commercial (hydrogen offtake contracts and production economics). Whether services are compensated through markets or mandated through interconnection requirements varies by jurisdiction, but the control hierarchy to deliver them can and should be architected into the facility from initial design.
19. Is there a ride-through standard for hydrogen facilities?
No unified standard exists — requirements are jurisdiction-dependent, and capability is limited primarily by the electrochemical process behind the stacks rather than by the rectifiers. Published example envelopes ride through deep voltage sags for tenths of a second and wide frequency bands for defined durations, but these are illustrative, not prescriptive. Supplementary storage or UPS can extend ride-through for safety-critical loads and support controlled shutdown, at project-specific cost. Practically, ride-through for a hydrogen interconnection must be negotiated explicitly in the interconnection agreement, informed by stack technology, rectifier design, and the plant safety chain.
20. What should utilities require of large loads at interconnection?
A defensible baseline includes: dedicated voltage and frequency ride-through requirements written from the grid's perspective rather than deferring to ITIC; validated PSPD and EMT models of the actual power conversion architecture, updated when the facility design changes; an IEEE 519 harmonic assessment reflecting the real transformer vector groups; oscillation screening against known system modes; disclosure of UPS runtimes, backup generation transfer logic, and minimum run times for restoration planning; characterized flexibility parameters (ramp rates, notice, minimum load, restoration time); and PMU-class high-resolution monitoring at the POI, complemented where warranted by monitoring inside the facility. Requirements engaged during facility design cost a fraction of post-energization retrofits.
21. How does a large-load interconnection differ from a generator interconnection in practice?
The physics rhyme — both are converter-interfaced devices whose control loops interact with grid impedance — but the institutional maturity differs. Generator interconnection has two decades of standardized processes, model quality requirements, and performance standards (and, for ride-through, standards such as IEEE 2800 and the PRC-series NERC standards). Large-load frameworks are still forming: study scopes vary by region, model fidelity requirements are inconsistent, and performance requirements are actively being written in forums at NERC, ERCOT, and elsewhere. That fluidity is a schedule risk for developers and a reliability risk for hosts, and it is exactly where early, well-documented engineering — accurate one-lines, honest models, measured ride-through data — pays for itself.
22. Where does Keentel Engineering fit into a large-load project?
Keentel Engineering supports large-load projects across the full interconnection lifecycle. For developers and operators: interconnection application engineering, facility one-line and power distribution design review, PSS/E and PSCAD/EMTDC model development and validation, ride-through and protection coordination assessments, IEEE 519 harmonic and oscillation studies, reactive compensation and power quality mitigation design, and NERC compliance program development. For utilities and asset owners: owner's engineer review of large-load interconnection requests, drafting of interconnection performance requirements, independent model validation, and commissioning support. Contact us at contact@keentelengineering.com or (813) 389-7871.
About Keentel Engineering
Keentel Engineering is a power systems and grid interconnection consulting firm headquartered in Tampa, Florida, with offices in Austin, Sacramento, and Baltimore. Our service lines span grid interconnection engineering, substation and transmission design, power system studies, NERC compliance, renewables and battery energy storage engineering, EMT modeling, and owner's engineer services. We help developers, utilities, and large energy users treat interconnection as a first-order engineering input — because on today's grid, that is exactly what it is.
Keentel Engineering | 400 N Ashley Dr STE 2600, Tampa, FL | (813) 389-7871 | contact@keentelengineering.com | FL Firm Registration No. 36853
Disclaimer
This document is provided for general informational and educational purposes only and does not constitute engineering advice for any specific project. Interconnection requirements, study scopes, and performance standards vary by jurisdiction and change over time; consult a licensed professional engineer regarding your specific facility. Keentel Engineering is not affiliated with ESIG, NERC, ERCOT, or any organization, standard body, or vendor referenced herein.

About the Author:
Sandip "Sonny" R. Patel, P.E.
IEEE Senior Member · Founder & CEO, Keentel Engineering
In 1995, Sonny Patel earned his Electrical Engineering degree from the University of Illinois. But degrees don't build legacies — action does.
For three decades, he has worked the power industry from every side of the table: 16 years as a utility engineer at Exelon/Commonwealth Edison; generation leadership across hydroelectric, industrial steam turbine, and a 9 GW renewable fleet; NERC Regional Entity Senior Compliance Engineer and Audit Team Lead, auditing some of the nation's largest utilities; and testing and commissioning lead on equipment up to 765 kV — the very top of the North American grid.Utility. Generator. Regulator. Consultant. Few engineers have seen all four seats. Fewer still have sat in them.
His experience spans nuclear, hydro, conventional generation, renewables, oil and gas, mining — and today's data centers, where he is authoring a three-book series on data center design. He is a Licensed Professional Engineer in six states and a Licensed Electrical Contractor in Florida (Unlimited EC) — he doesn't just design the work; he's qualified to stand behind its execution.Today, as Founder and CEO of Keentel Engineering, Sonny leads a nationwide team of engineers delivering substation design, power system studies, NERC compliance, and commissioning — done right, coast to coast.Three decades. Every side of the table. One standard: accountable engineering.
Services

Let's Discuss Your Project
Let's book a call to discuss your electrical engineering project that we can help you with.
About the Author:
Sandip "Sonny" R. Patel, P.E.
IEEE Senior Member · Founder & CEO, Keentel Engineering
In 1995, Sonny Patel earned his Electrical Engineering degree from the University of Illinois. But degrees don't build legacies — action does.
For three decades, he has worked the power industry from every side of the table: 16 years as a utility engineer at Exelon/Commonwealth Edison; generation leadership across hydroelectric, industrial steam turbine, and a 9 GW renewable fleet; NERC Regional Entity Senior Compliance Engineer and Audit Team Lead, auditing some of the nation's largest utilities; and testing and commissioning lead on equipment up to 765 kV — the very top of the North American grid.
Utility. Generator. Regulator. Consultant. Few engineers have seen all four seats. Fewer still have sat in them.
His experience spans nuclear, hydro, conventional generation, renewables, oil and gas, mining — and today's data centers, where he is authoring a three-book series on data center design. He is a Licensed Professional Engineer in six states and a Licensed Electrical Contractor in Florida (Unlimited EC) — he doesn't just design the work; he's qualified to stand behind its execution.
Today, as Founder and CEO of Keentel Engineering, Sonny leads a nationwide team of engineers delivering substation design, power system studies, NERC compliance, and commissioning — done right, coast to coast.Three decades. Every side of the table. One standard: accountable engineering.
Leave a Comment
Thank you for contacting us.
We will get back to you as soon as possible.
We will get back to you as soon as possible.
Oops, there was an error sending your message.
Please try again later.
Please try again later.
Related Posts
By SANDIP R PATEL
•
October 11, 2026
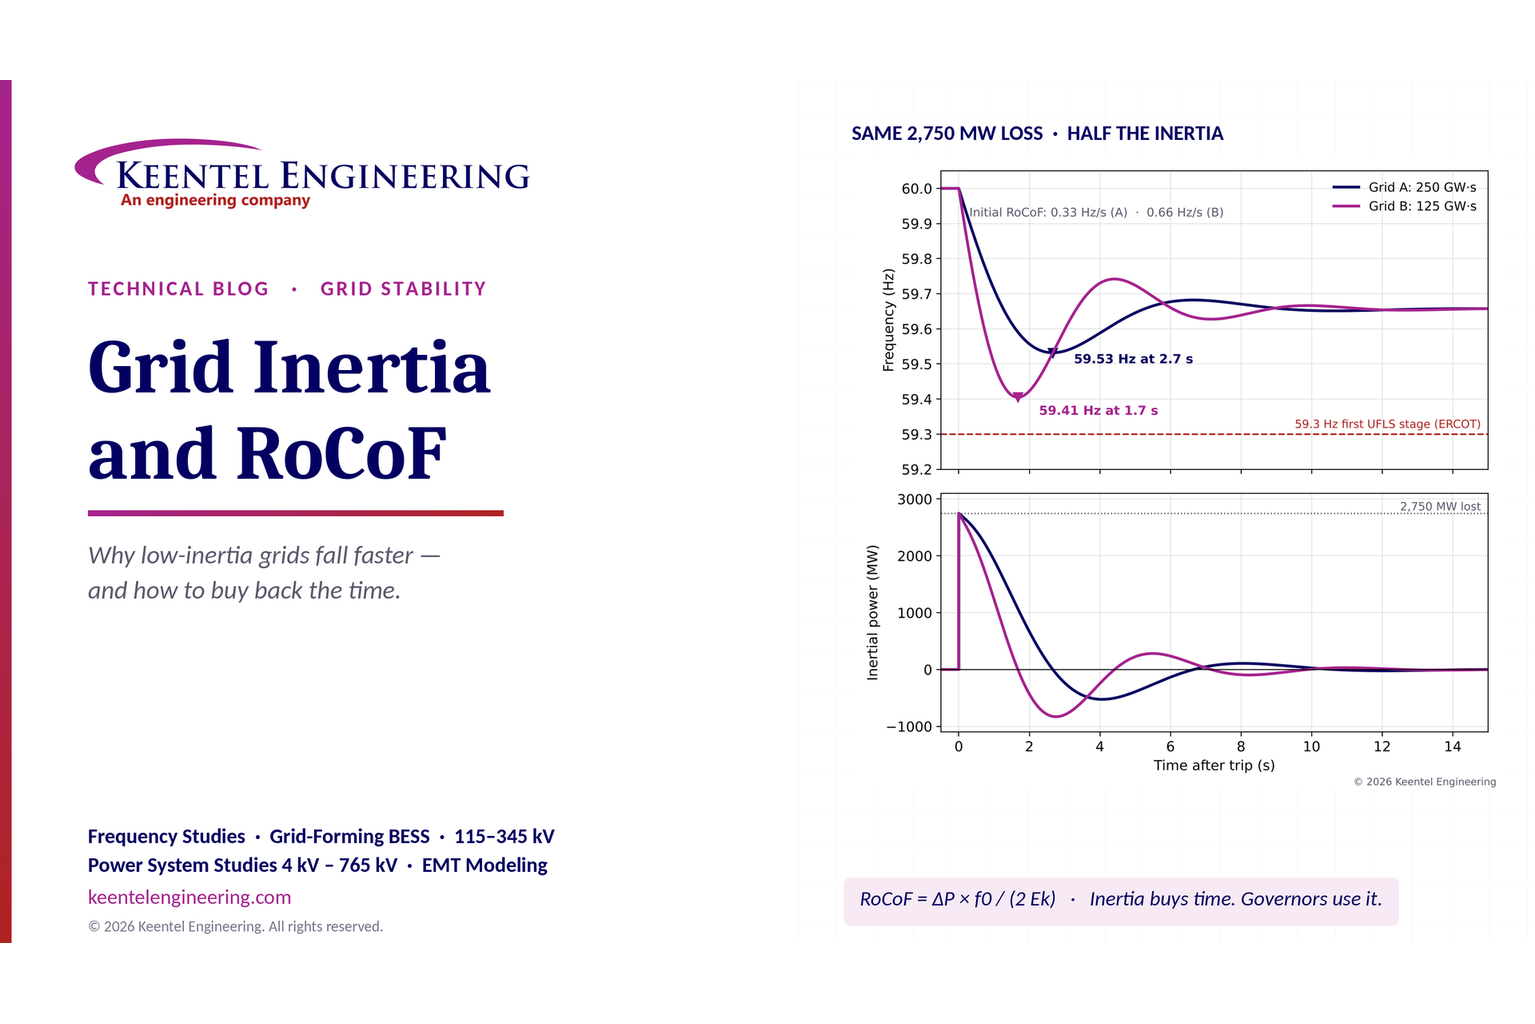
Explore grid inertia, RoCoF and frequency response, with swing equation calculations, frequency nadir analysis and US power system simulation examples.
By SANDIP R PATEL
•
October 10, 2026
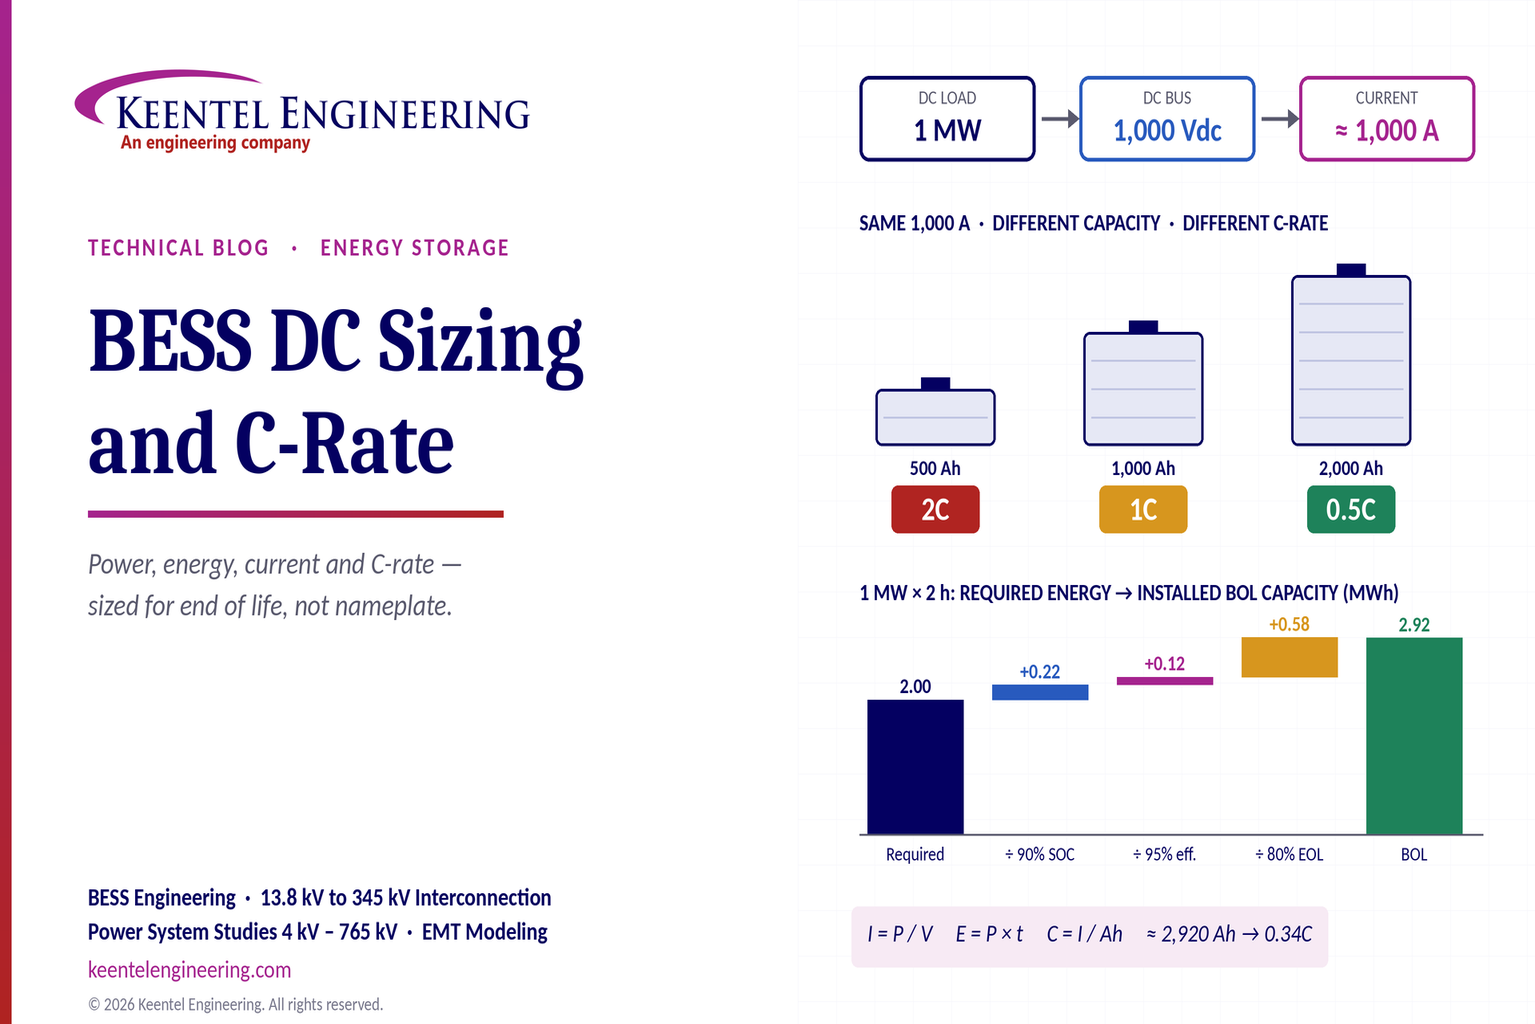
Learn BESS DC sizing with power, energy, current and C-rate calculations, battery losses, degradation and a 100 MW/400 MWh utility-scale example.
By SANDIP R PATEL
•
October 10, 2026
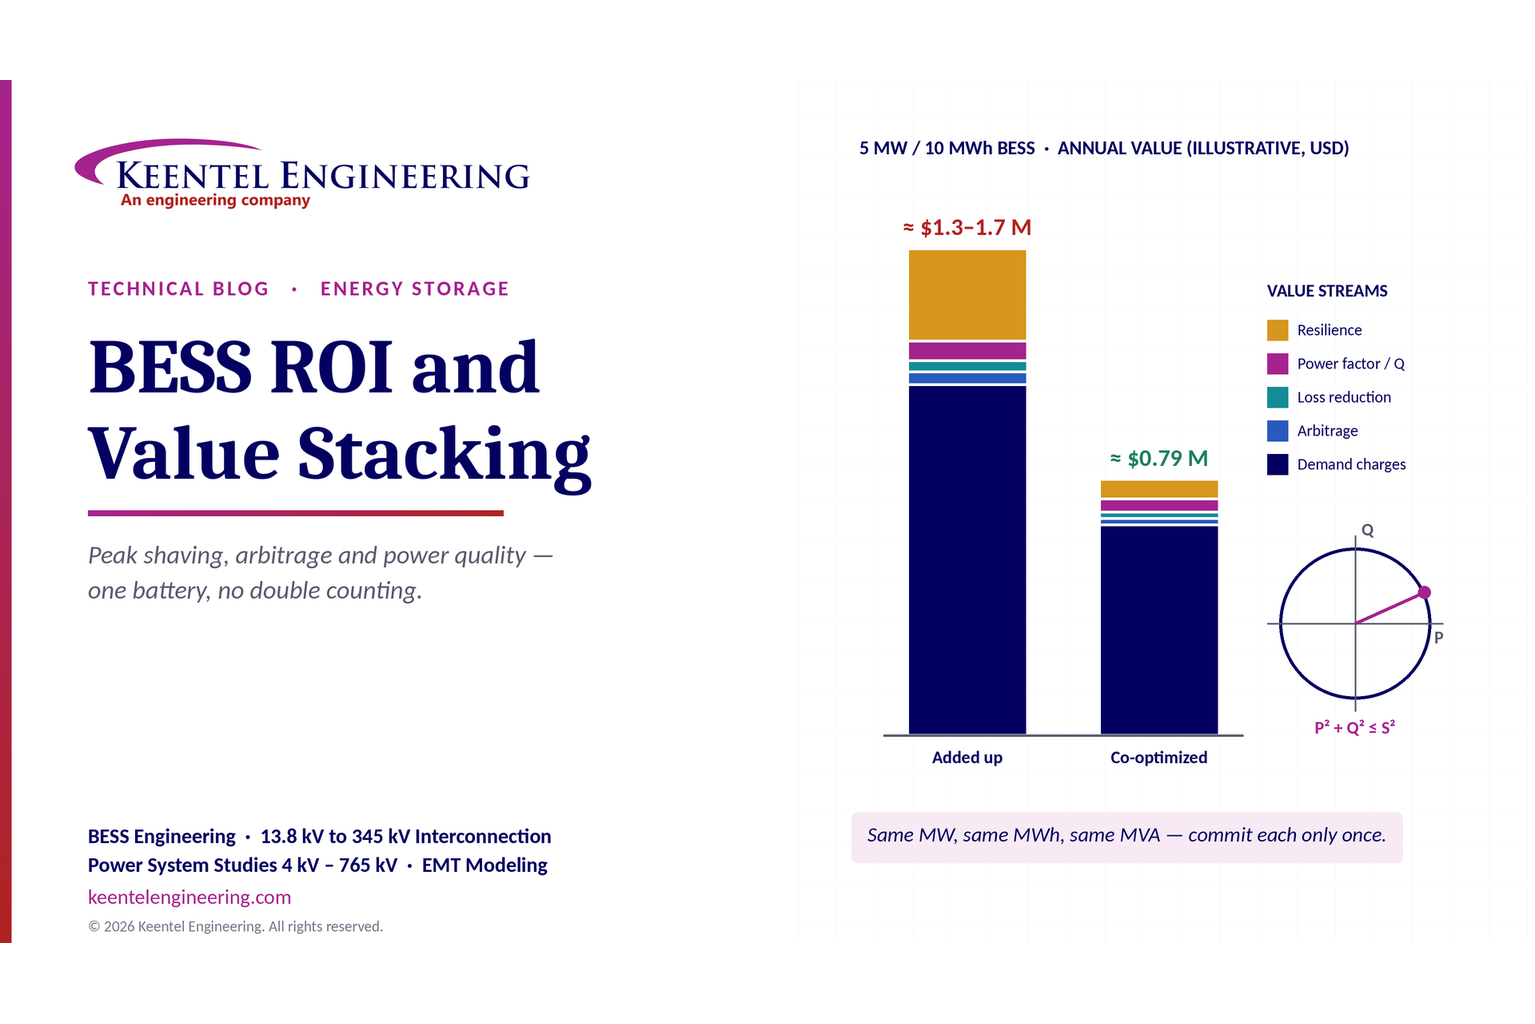
Learn how BESS ROI is calculated using peak shaving, energy arbitrage, power quality and battery storage economics, with a practical 5 MW/10 MWh example.
By SANDIP R PATEL
•
October 10, 2026
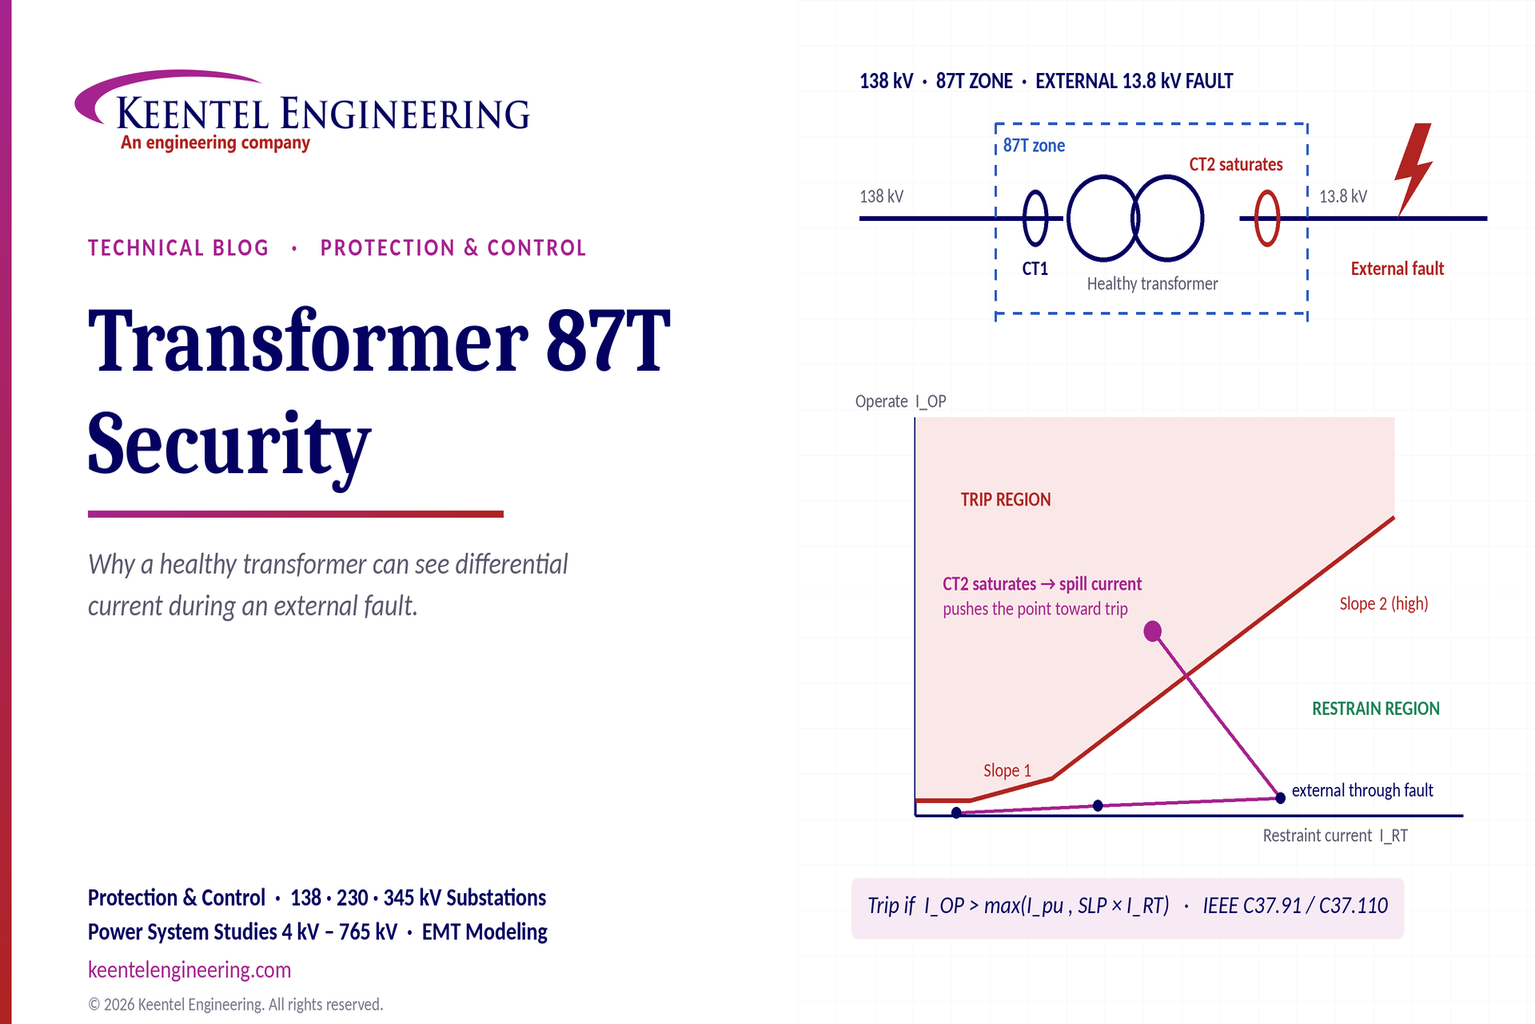
Learn why transformer differential relays detect current during external faults, how CT saturation causes spill current, and how secure 87T protection prevents trips.
By SANDIP R PATEL
•
October 10, 2026
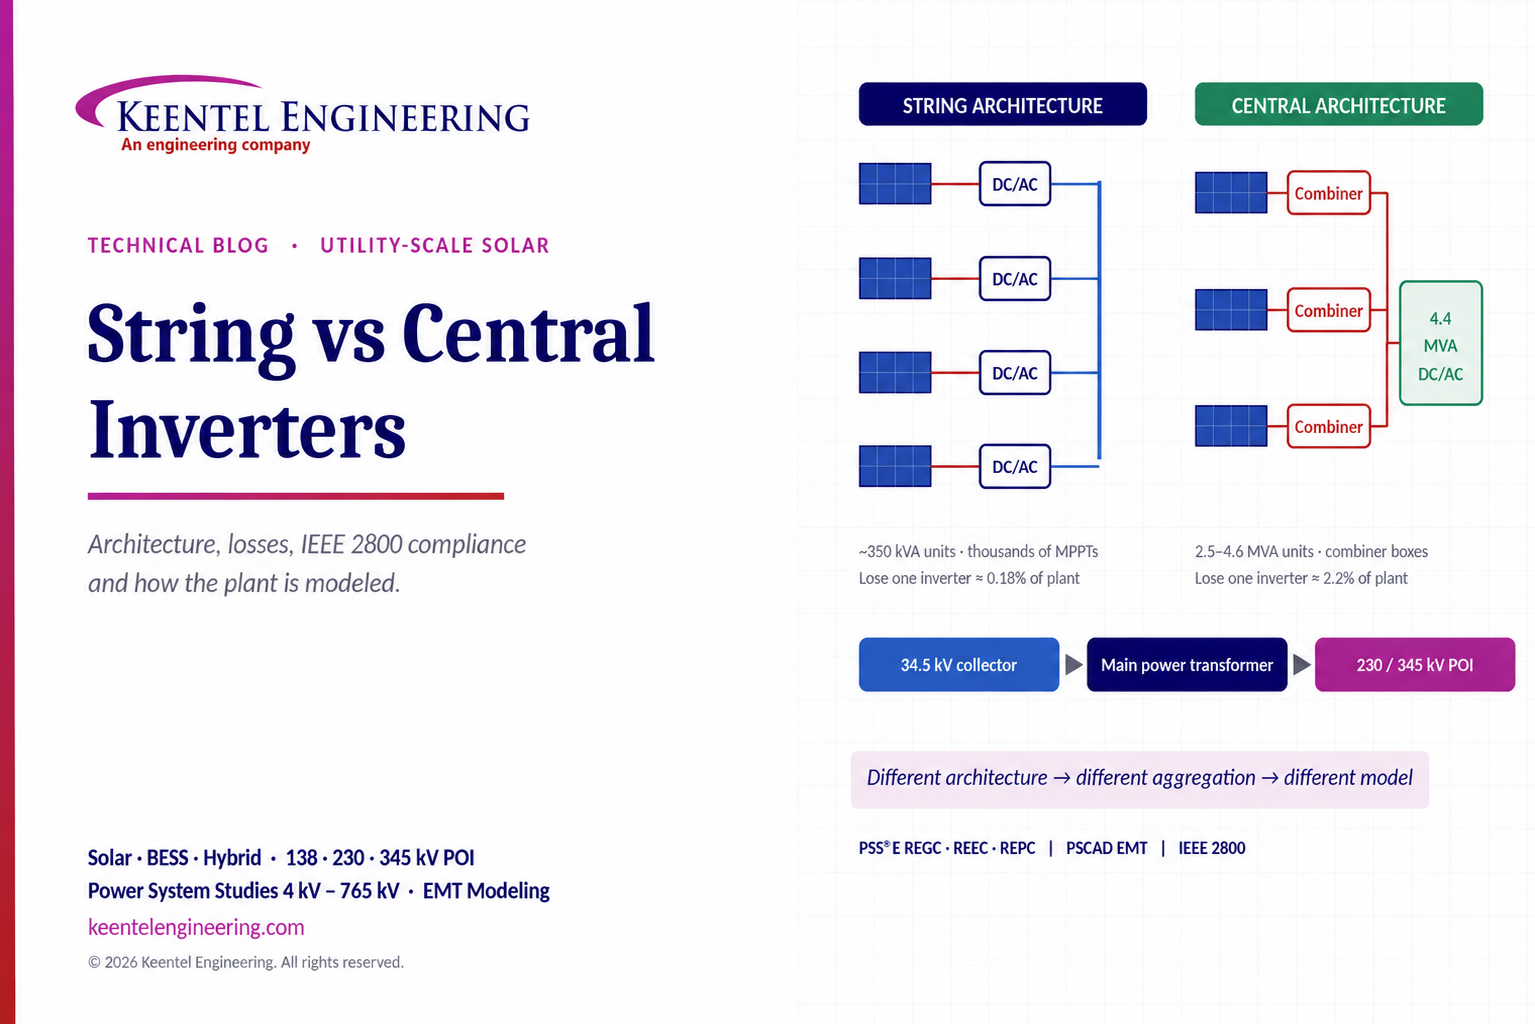
Compare string vs central inverters for utility-scale solar, including efficiency, maintenance, grid compliance, reactive power and interconnection studies.
By SANDIP R PATEL
•
October 9, 2026
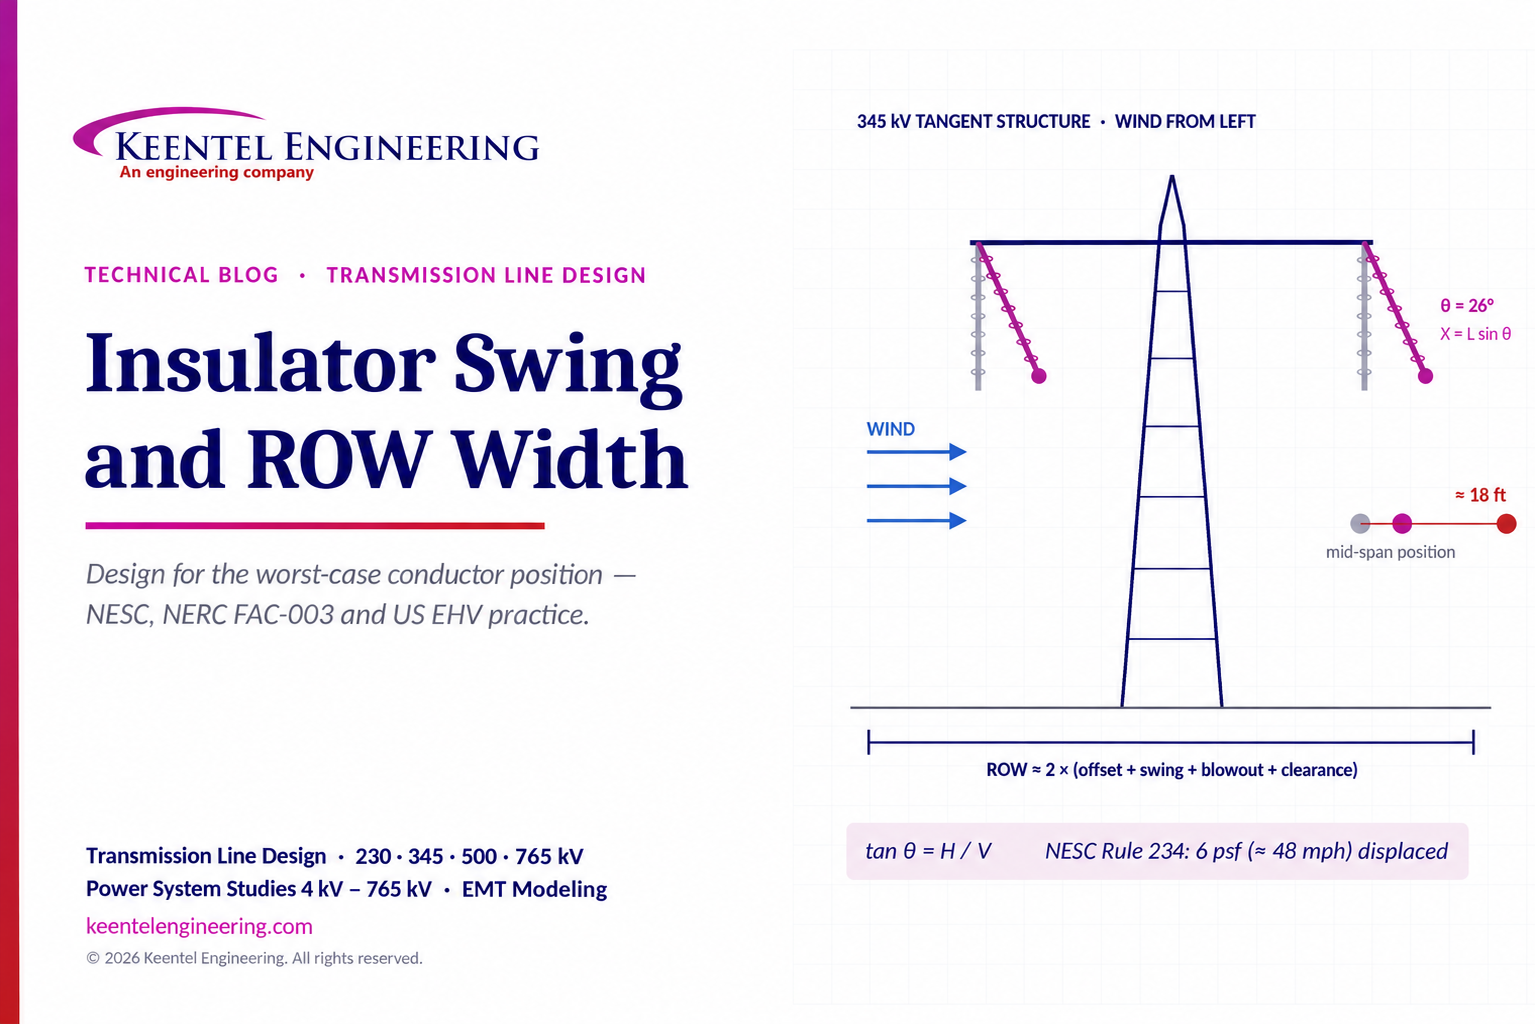
Learn how insulator swing angle and conductor blowout affect transmission line ROW width, with NESC clearances, NERC FAC-003 guidance, and a 345 kV example.
Copy
By SANDIP R PATEL
•
October 3, 2026
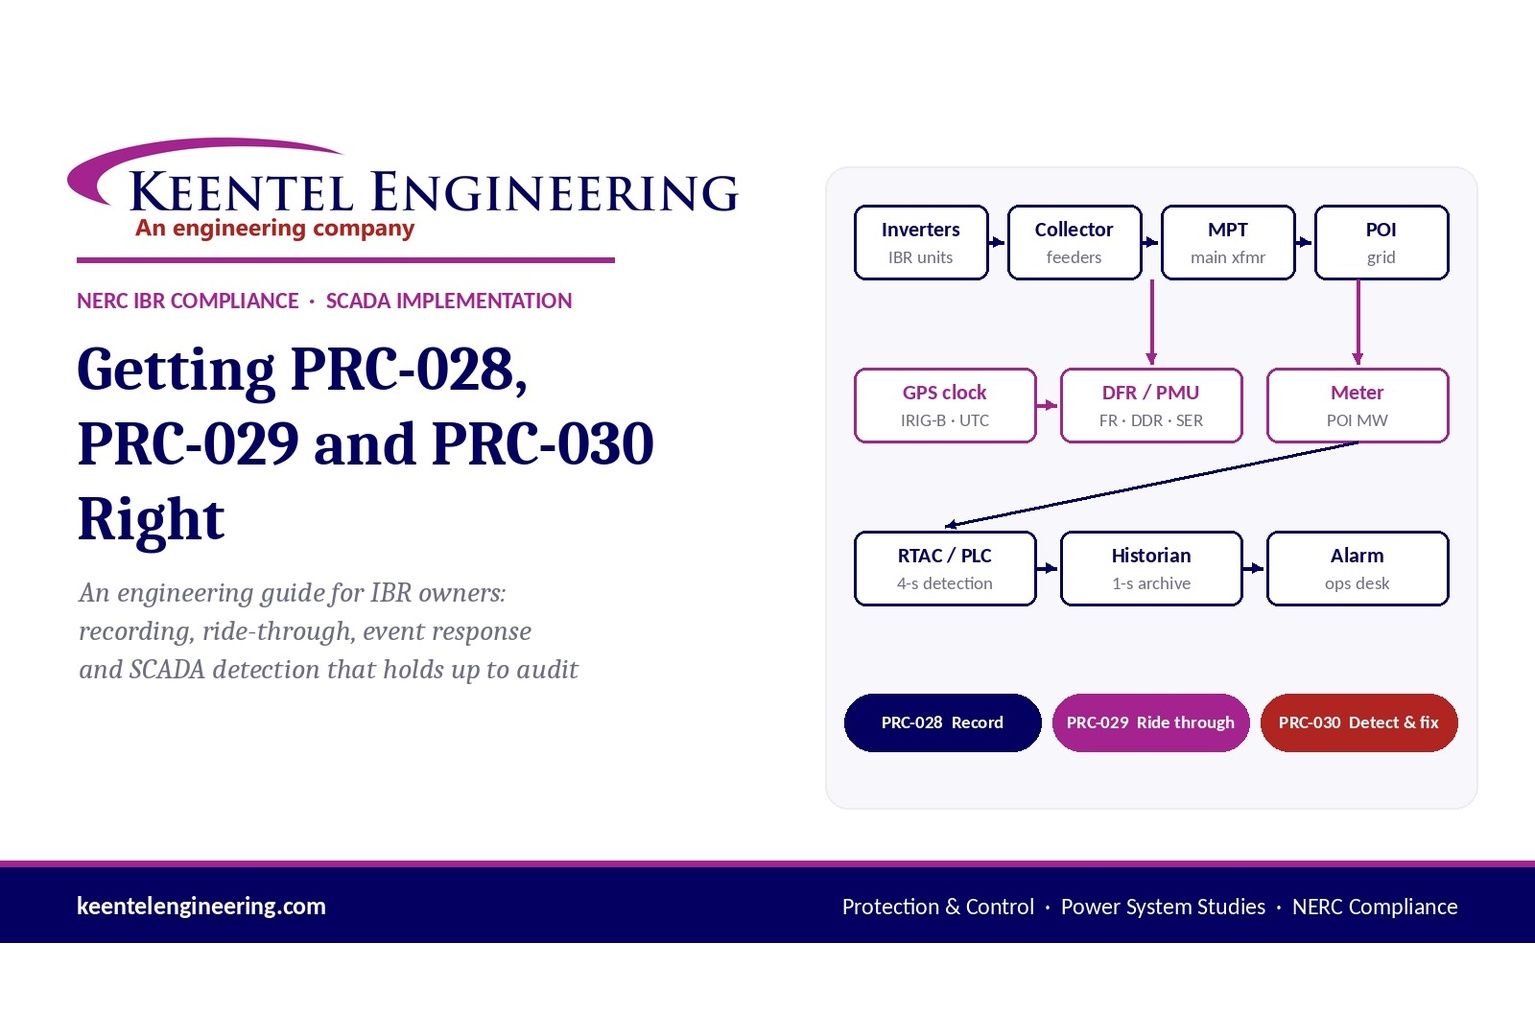
Engineering guide to PRC-028 disturbance recording, PRC-029 ride-through and PRC-030 event detection for inverter-based resources.
By SANDIP R PATEL
•
October 3, 2026
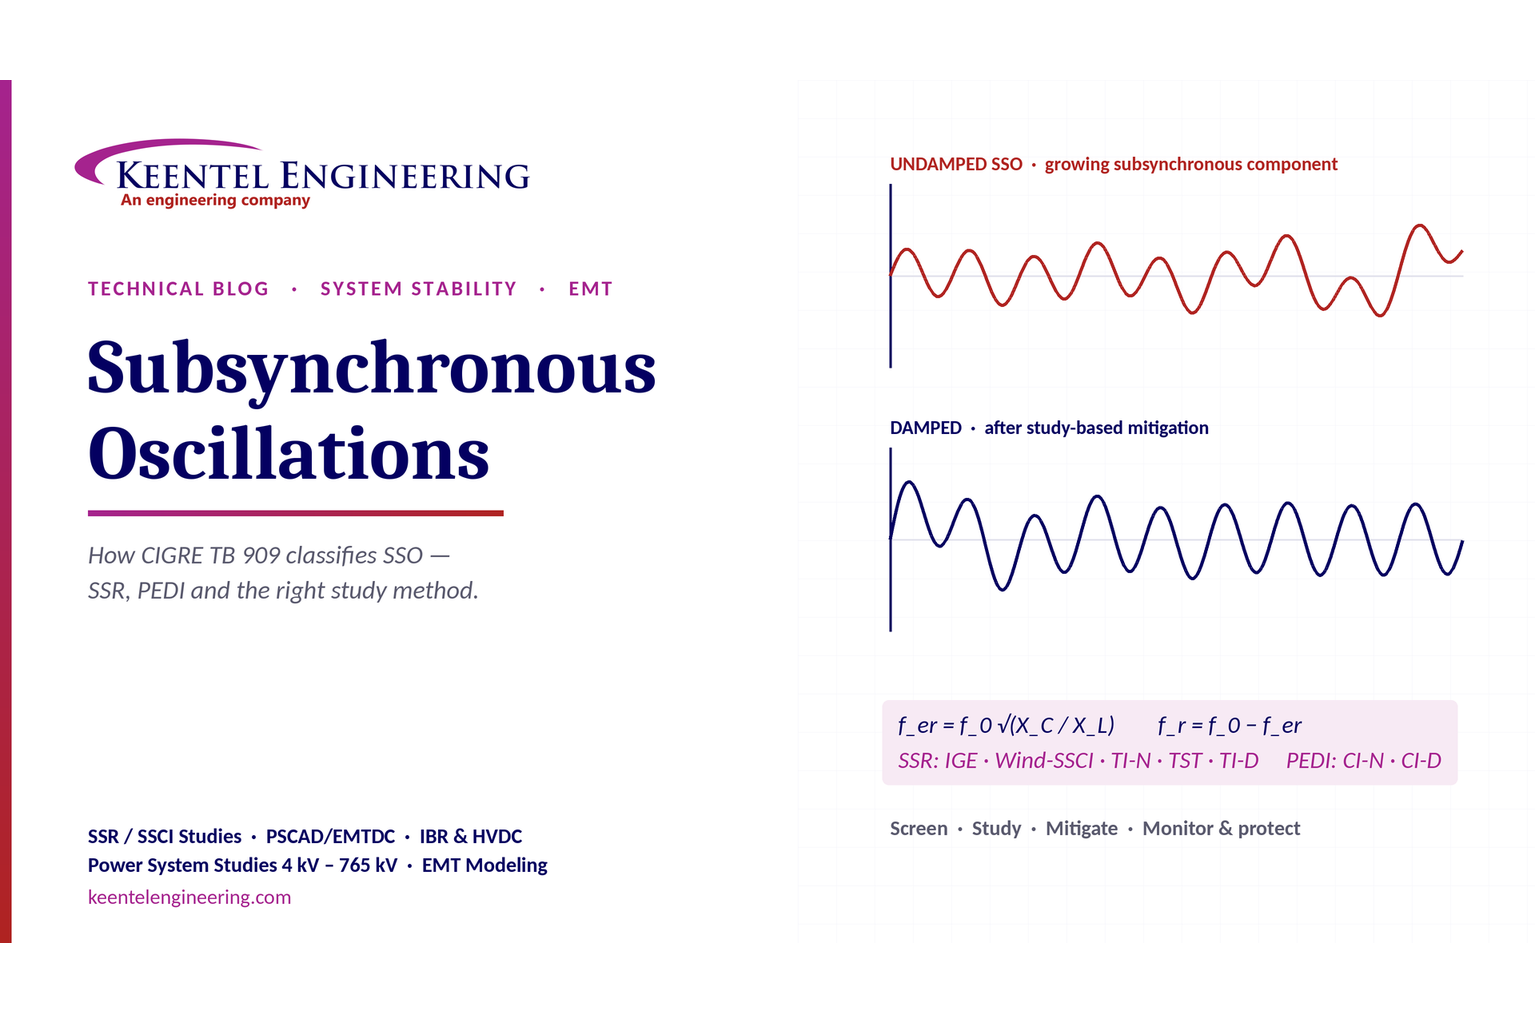
A practical guide to SSO classification, SSR, PEDI, Wind-SSCI, EMT analysis, mitigation and protection based on CIGRE TB 909.
By SANDIP R PATEL
•
October 3, 2026
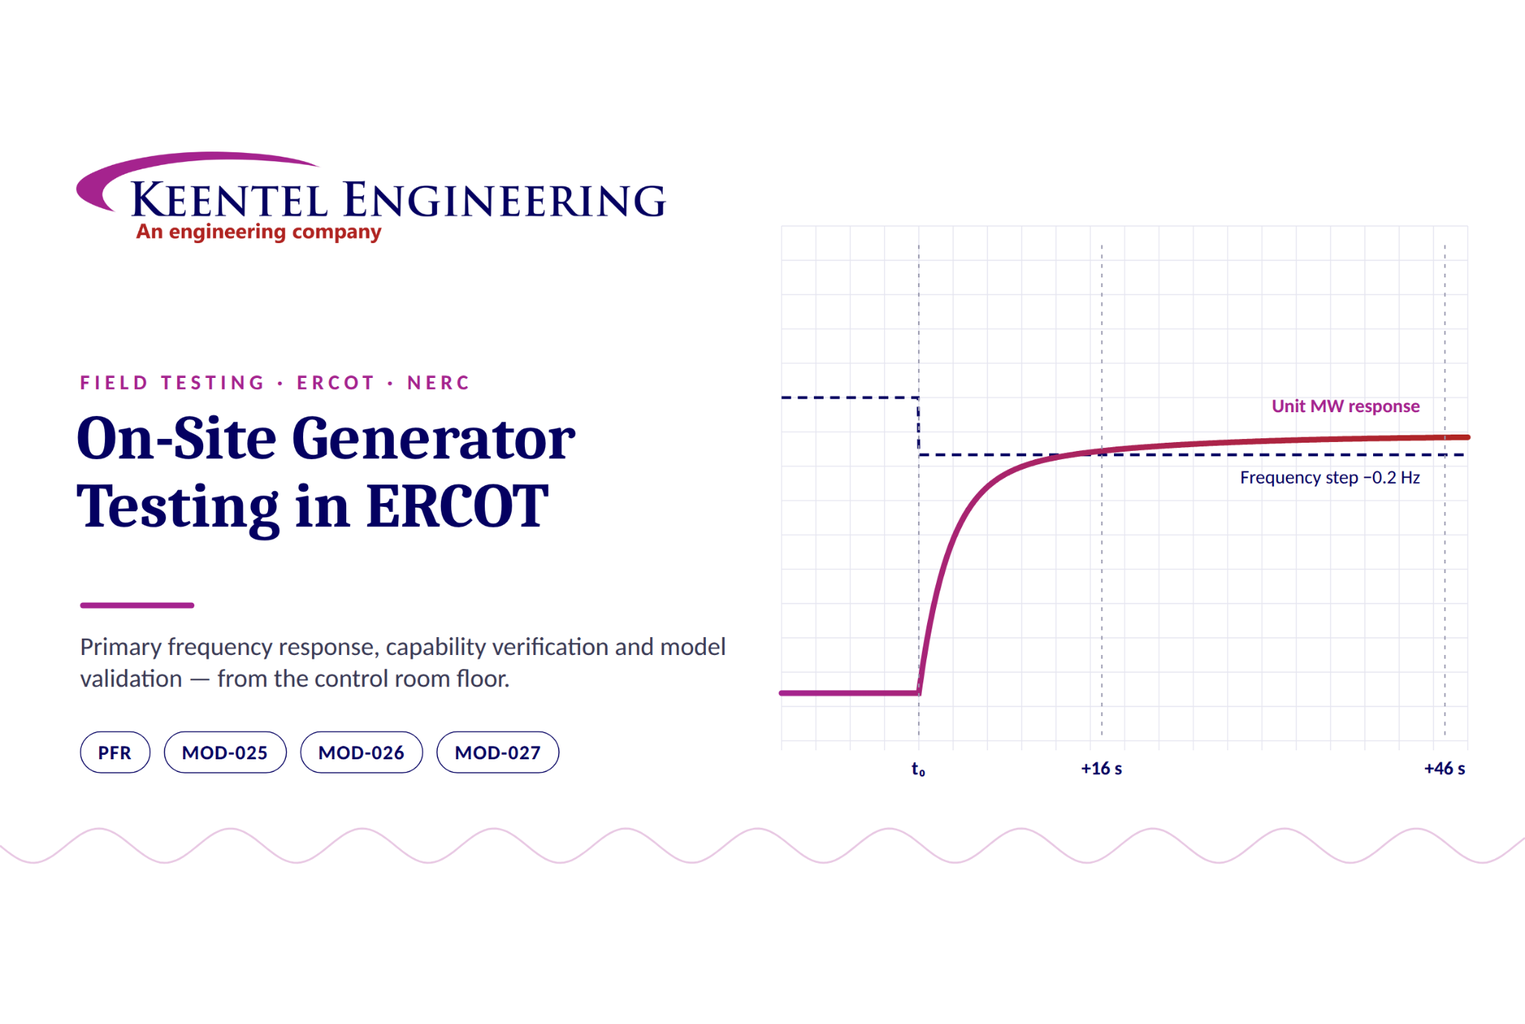
Learn ERCOT generator testing for PFR, MOD-025 and MOD-026/027, including staged tests, capability verification, dynamic models and field testing.





