
A Coordinated Electric System Interconnection Review—the utility’s deep-dive on technical and cost impacts of your project.
Challenge: Frequent false tripping using conventional electromechanical relays
Solution: SEL-487E integration with multi-terminal differential protection and dynamic inrush restraint
Result: 90% reduction in false trips, saving over $250,000 in downtime
The three operating regions you have to design to
What ERCOT Frequency Response Testing Actually Involves
September 3, 2026 | Blog
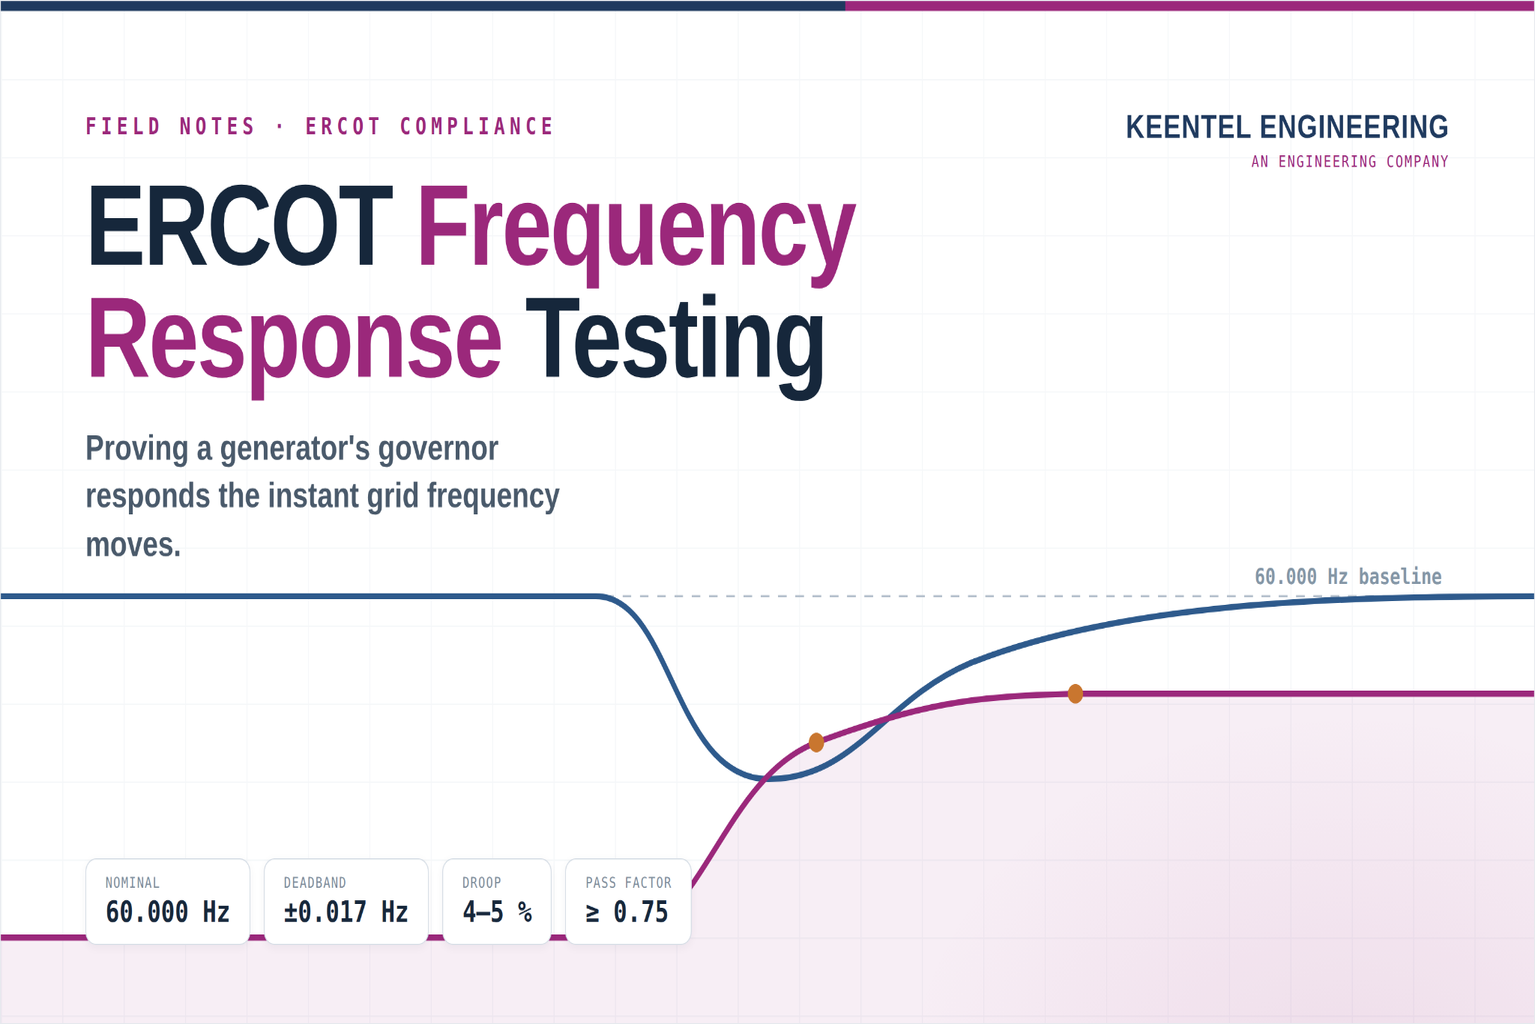
A field engineer's guide to proving a generator's governor does its job when grid frequency moves — the standards, the procedure, and how the test is run onsite and remotely.
Every generator connected to the ERCOT grid makes an implicit promise: when frequency drops, it will push more power onto the system, automatically, within seconds. Frequency response testing is how that promise is proven.
ERCOT runs an electrically islanded interconnection. Unlike the Eastern or Western grids, it cannot lean on neighbors to arrest a frequency excursion — the resources spinning inside Texas are the whole of the reserve. That makes Primary Frequency Response (PFR) — the immediate, governor-driven output change that opposes a frequency deviation — a load-bearing part of grid reliability, not a formality. When a large unit trips, PFR from every other governor on the system is what keeps frequency from collapsing in the seconds before deployed reserves can take over.
Because it matters that much, ERCOT and Texas RE require each generation resource to demonstrate that its governor responds correctly. Most of the time that demonstration comes from watching how a unit behaves during real grid disturbances. When those disturbances haven't given enough evidence, the resource has to prove itself through a controlled test. This article walks through the standards behind that requirement and the procedure for running the test.
The Regulatory Backbone — Three Documents Govern the Work
Frequency response obligations in ERCOT sit across a regional reliability standard and the ERCOT Operating Guides. An engineer running a test works to the current published versions of all three.
| Reference | What it governs |
|---|---|
| NERC BAL-001-TRE-2 — Primary Frequency Response in the ERCOT Region | The performance standard: governor settings (droop and deadband limits by unit type), the governor-in-service obligation, and the two performance measures — initial and sustained PFR — each against a minimum rolling factor of 0.75. |
| ERCOT NOG Section 2.2.7 | Carries the operational PFR obligations and the provision that a resource which has not participated in enough Frequency Measurable Events must demonstrate its capability through a controlled staged test in lieu of those events. |
| ERCOT NOG Section 8, Attachment C — Generation Frequency Response Test Procedure | The controlling field procedure: load conditions, the simulated-frequency profile applied to the governor, the data recorded, and how initial and sustained response are evaluated. On test day, this document governs. |
What “Good” Looks Like — Droop, Deadband, and the Two Windows
A governor's job is described by two settings.
Droop is the slope:The percentage change in frequency that would drive the unit from no output to full output. A 5% droop means a 5% frequency change (3 Hz) commands a 100% output change — so a realistic 0.1 Hz dip commands a small, precise increase.
Deadband is the window around 60.000 Hz inside which the governor deliberately ignores frequency, to avoid chasing normal grid noise. Beyond the deadband, it must act.
| Parameter | Typical ERCOT limit | What the test confirms |
|---|---|---|
| Deadband | ±0.017 Hz | Response begins just beyond the deadband, not later |
| Droop — simple-cycle / single-shaft CT | ≤ 5 % | Output change matches the registered slope |
| Droop — combined-cycle CT | ≤ 4 % | Aggregate block response matches expected |
| Initial PFR window | ~20–52 s | Actual ÷ Expected response ≥ 0.75 |
| Sustained PFR window | ~46–60 s | Response held, not withdrawn; ≥ 0.75 |
Performance is scored as a ratio: the resource's actual real-power response divided by the expected response for the measured frequency deviation and the unit's rating. Both the initial window (roughly 20 to 52 seconds after the event) and the sustained window (roughly 46 to 60 seconds) must land at or above 0.75. A unit that jumps and then quietly walks its output back — a “withdrawn” or “squelched” response — fails the sustained measure even if the initial spike looked fine.
Why a Staged Test Exists — When Real Events Don’t Give Enough Evidence
ERCOT measures most PFR from Frequency Measurable Events (FMEs) — real disturbances large enough to push frequency past the deadband and force governors to respond. A resource's compliance is scored on a rolling average across a minimum of eight successful FMEs.
But a unit that runs infrequently — a peaker, a seasonal resource, a unit returning from a long outage or a controls upgrade — may simply not be online for enough qualifying events to build that record. Frequency doesn't wait for a unit to be running. When a resource can't accumulate the required FMEs, ERCOT's rules let it demonstrate the same capability deliberately, through the staged Generation
Frequency Response Test. The staged test reproduces, under controlled conditions, exactly what an FME would reveal — and the result is submitted to ERCOT in place of the missing events.
The staged test isn't a lesser substitute — it's a cleaner, purpose-built version of the same measurement, run when and where the engineer controls the conditions instead of waiting on the grid.
The Procedure — How a Frequency Response Test Is Run
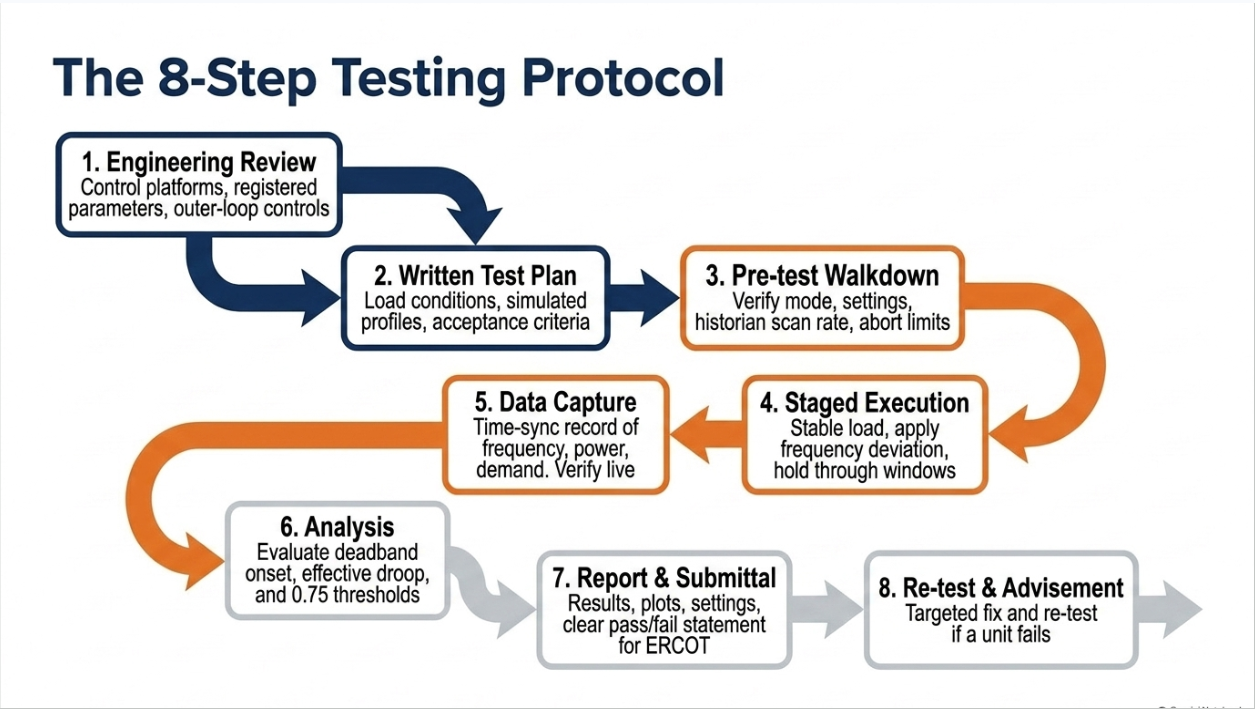
A staged test is a disciplined sequence. The magnitudes and pass thresholds come from the controlling ERCOT procedure; the workflow below is the shape of the engagement from engineering review to accepted report.
01 Engineering & registration review
Confirm the unit's control platform, governor droop and deadband, capability, and the parameters registered with ERCOT. Identify any outer-loop controls (unit load control, plant-level dispatch) that could mask the governor during the test.
02 Written test plan
Build the unit-specific test-point plan from the ERCOT procedure — load conditions, the simulated under- and over-frequency steps, dwell times, and acceptance criteria — and submit it so the plant can schedule test time.
03 Pre-test walkdown
Verify governor mode and settings, confirm the data historian is capturing the right signals at an adequate scan rate, agree protection limits and abort criteria, and set a common time reference.
04 Staged test execution
With the unit stable at the agreed load, a simulated frequency deviation is applied to the governor's frequency input — below 60 Hz to command more output, above to command less — beyond the deadband, held through the sustained window, and repeated in both directions and at the required points.
05 Data capture
Frequency and applied signal, real-power output, governor/fuel demand, and unit status are recorded time-synchronized. Capture is verified on the spot — a test point with bad or missing data is re-run before crews leave.
06 Analysis
Recorded data is evaluated against the initial and sustained windows: response direction and onset at the deadband, effective droop, and the actual-to-expected factor in each window against the 0.75 threshold.
07 Report & submittal
A results report per resource — measures, plots, settings, and a clear pass/fail statement — is delivered to support the owner's ERCOT submittal, typically within a business week of the test.
08 Re-test & advisement
If a unit doesn't pass, the same data usually shows why. Engineering advisement on settings or control behavior, followed by a targeted re-test, closes the gap.
Onsite & Remote — The Test Has a Physical Half and a Data Half
Modern historian-based testing splits cleanly. The unit still has to be exercised in the plant — but much of the engineering that surrounds the test travels over a network. Knowing which work belongs where is how a compliance deadline gets met without a crew idling on site.
On site
- Pre-test walkdown — confirming settings, signals, and protection limits with plant staff.
- Test direction — coordinating each simulated-frequency step with operations and controls in real time.
- Live verification — watching the response point-by-point and calling re-runs on the spot.
- Field test log — the ground-truth record of load, applied signal, and observed output per point.
Remote
- Engineering & test-plan development — built from settings and registration data before anyone mobilizes.
- Historian-based capture — when the plant's data system resolves the response windows, the record comes off the historian, not a truck of instruments.
- Analysis & reporting — the actual-to-expected evaluation and the compliance report are desk work.
- Remote witnessing & support — an engineer can direct or witness a test over a live link when a site visit isn't warranted.
The practical payoff: a single mobilization can cover the physical testing while the heavier engineering — planning, analysis, and reporting — happens before and after, off site. For an owner staring at a filing deadline, that's the difference between a scramble and a schedule.
Why Keentel — Built for ERCOT Testing, Onsite and Remote
Frequency response testing sits at an awkward intersection: it's a field service, a controls exercise, and a regulatory filing all at once. Firms that only do one of those leave the owner to stitch the rest together. Keentel Engineering is built to carry the whole span.
Engineering-led — a licensed engineer owns the result
Every test is directed and every report certified by a professional engineer, so the analysis and the submittal meet ERCOT and Texas RE expectations — not just a data dump handed back to the owner.
Turnkey — plan, test, analyze, report, one firm
From the registration review and test plan through execution, analysis, and the compliance-ready report, it's a single accountable scope. No handoff between a test crew and a separate modeling consultant.
Onsite + remote — the right work in the right place
We run the physical test on site and keep the engineering — planning, historian-based analysis, reporting, and remote witnessing — off site, compressing mobilizations and hitting tight filing windows.
Vendor-neutral — we work with your controls team
The plant keeps control of its unit. We direct the test while your controls staff or OEM make any parameter changes — a clean division of responsibility that protects the machine and the schedule.
ERCOT-fluent — we speak the standards
BAL-001-TRE-2, the Nodal Operating Guides, FME accounting, droop and deadband, QSE coordination — the language of an ERCOT filing is our working vocabulary, which de-risks the submittal.
Multi-office — Texas presence, national reach
With engineering offices including Austin, we mobilize into the ERCOT footprint quickly and support fleets across regions with a consistent method and reporting standard.
Frequently Asked Questions
Q1 Why would a unit need a staged test instead of relying on real events?
Because compliance is scored across a minimum number of Frequency Measurable Events, and a unit that runs infrequently — or has been offline for an outage or a controls change — may not be online for enough qualifying events. The staged test demonstrates the same capability on demand and is submitted in place of the missing events.
Q2 What does the test physically do to the unit?
Nothing damaging. With the unit online and stable, a simulated frequency deviation is introduced at the governor's frequency input so the control system responds as if grid frequency had moved. The unit adjusts output within its normal operating range; protection limits and abort criteria are agreed beforehand.
Q3 Who changes the governor parameters — the test firm or the plant?
The plant. Keentel directs the test and specifies each step, while the plant's controls staff or the OEM make any actual parameter changes on the control system. This keeps the unit under plant control and cleanly separates responsibility.
Q4 Does the test require bringing in external instrumentation?
Not always. When the plant's data historian can record the required signals at a fast enough scan rate to resolve the response windows, the data comes off the historian. If it can't, portable high-speed recording at plant test points is the fallback — a question worth settling early.
Q5 What signals have to be recorded?
At minimum, the applied/measured frequency and the unit's real-power output, ideally alongside governor or fuel demand, and unit breaker status — all time-synchronized, from before each step through the full sustained window.
Q6 How is a combined-cycle block handled?
Where ERCOT treats a combined-cycle plant as a single resource, the test captures the aggregate real-power response of the block, with data from each contributing machine, and the analysis evaluates the combined output at the point of interconnection.
Q7 What defines a passing result?
A correct-direction response beginning just beyond the deadband, an effective droop consistent with the registered value, and an actual-to-expected response factor of at least 0.75 in both the initial (~20–52 s) and sustained (~46–60 s) windows, with the response held rather than withdrawn.
Q8 How much can be done remotely?
The engineering that surrounds the test — test-plan development, data analysis, and the compliance report — is desk work, and an engineer can witness or direct a test over a live link. The physical exercise of the unit and the pre-test walkdown are the parts that belong on site.
Q9 What happens if a unit fails?
The recorded data usually shows why — a setting out of tolerance, an outer-loop control overriding the governor, or a withdrawn response. Keentel provides engineering advisement on the fix and performs a targeted re-test to close the gap before the filing deadline.
Keentel Engineering · An engineering company
Professional engineering & field testing for power generation. Generator frequency response testing and ERCOT / NERC compliance support, delivered onsite and remotely. Offices in Tampa (Head Office), Austin, Sacramento, and Baltimore. NSPE Member · D-U-N-S Registered · IEEE Senior Member · BBB Accredited Business (A+).
General technical information on ERCOT frequency response testing. Test parameters and acceptance criteria follow the current ERCOT and
NERC standards
in effect at the time of testing.

About the Author:
Sandip "Sonny" R. Patel, P.E.
IEEE Senior Member · Founder & CEO, Keentel Engineering
In 1995, Sonny Patel earned his Electrical Engineering degree from the University of Illinois. But degrees don't build legacies — action does.
For three decades, he has worked the power industry from every side of the table: 16 years as a utility engineer at Exelon/Commonwealth Edison; generation leadership across hydroelectric, industrial steam turbine, and a 9 GW renewable fleet; NERC Regional Entity Senior Compliance Engineer and Audit Team Lead, auditing some of the nation's largest utilities; and testing and commissioning lead on equipment up to 765 kV — the very top of the North American grid.Utility. Generator. Regulator. Consultant. Few engineers have seen all four seats. Fewer still have sat in them.
His experience spans nuclear, hydro, conventional generation, renewables, oil and gas, mining — and today's data centers, where he is authoring a three-book series on data center design. He is a Licensed Professional Engineer in six states and a Licensed Electrical Contractor in Florida (Unlimited EC) — he doesn't just design the work; he's qualified to stand behind its execution.Today, as Founder and CEO of Keentel Engineering, Sonny leads a nationwide team of engineers delivering substation design, power system studies, NERC compliance, and commissioning — done right, coast to coast.Three decades. Every side of the table. One standard: accountable engineering.
Services

Let's Discuss Your Project
Let's book a call to discuss your electrical engineering project that we can help you with.
About the Author:
Sandip "Sonny" R. Patel, P.E.
IEEE Senior Member · Founder & CEO, Keentel Engineering
In 1995, Sonny Patel earned his Electrical Engineering degree from the University of Illinois. But degrees don't build legacies — action does.
For three decades, he has worked the power industry from every side of the table: 16 years as a utility engineer at Exelon/Commonwealth Edison; generation leadership across hydroelectric, industrial steam turbine, and a 9 GW renewable fleet; NERC Regional Entity Senior Compliance Engineer and Audit Team Lead, auditing some of the nation's largest utilities; and testing and commissioning lead on equipment up to 765 kV — the very top of the North American grid.
Utility. Generator. Regulator. Consultant. Few engineers have seen all four seats. Fewer still have sat in them.
His experience spans nuclear, hydro, conventional generation, renewables, oil and gas, mining — and today's data centers, where he is authoring a three-book series on data center design. He is a Licensed Professional Engineer in six states and a Licensed Electrical Contractor in Florida (Unlimited EC) — he doesn't just design the work; he's qualified to stand behind its execution.
Today, as Founder and CEO of Keentel Engineering, Sonny leads a nationwide team of engineers delivering substation design, power system studies, NERC compliance, and commissioning — done right, coast to coast.Three decades. Every side of the table. One standard: accountable engineering.
Leave a Comment
Thank you for contacting us.
We will get back to you as soon as possible.
We will get back to you as soon as possible.
Oops, there was an error sending your message.
Please try again later.
Please try again later.
Related Posts
By SANDIP R PATEL
•
October 13, 2026
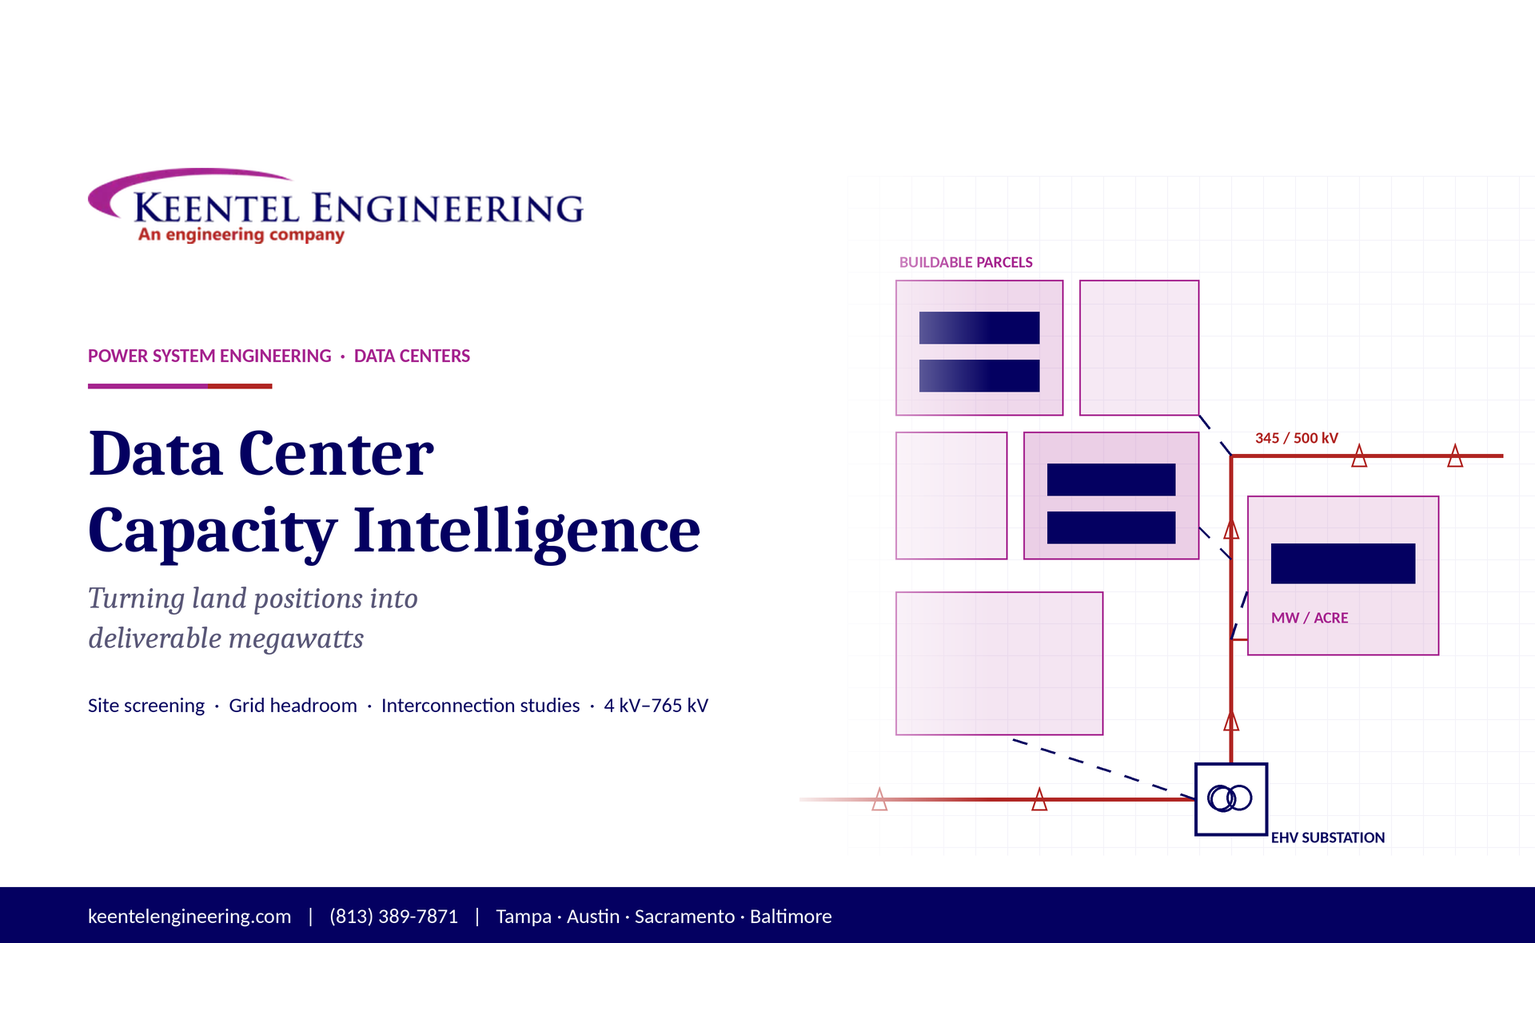
Plan data center capacity with land screening, MW-per-acre estimates, grid power availability and interconnection feasibility studies from Keentel Engineering.
By SANDIP R PATEL
•
October 11, 2026
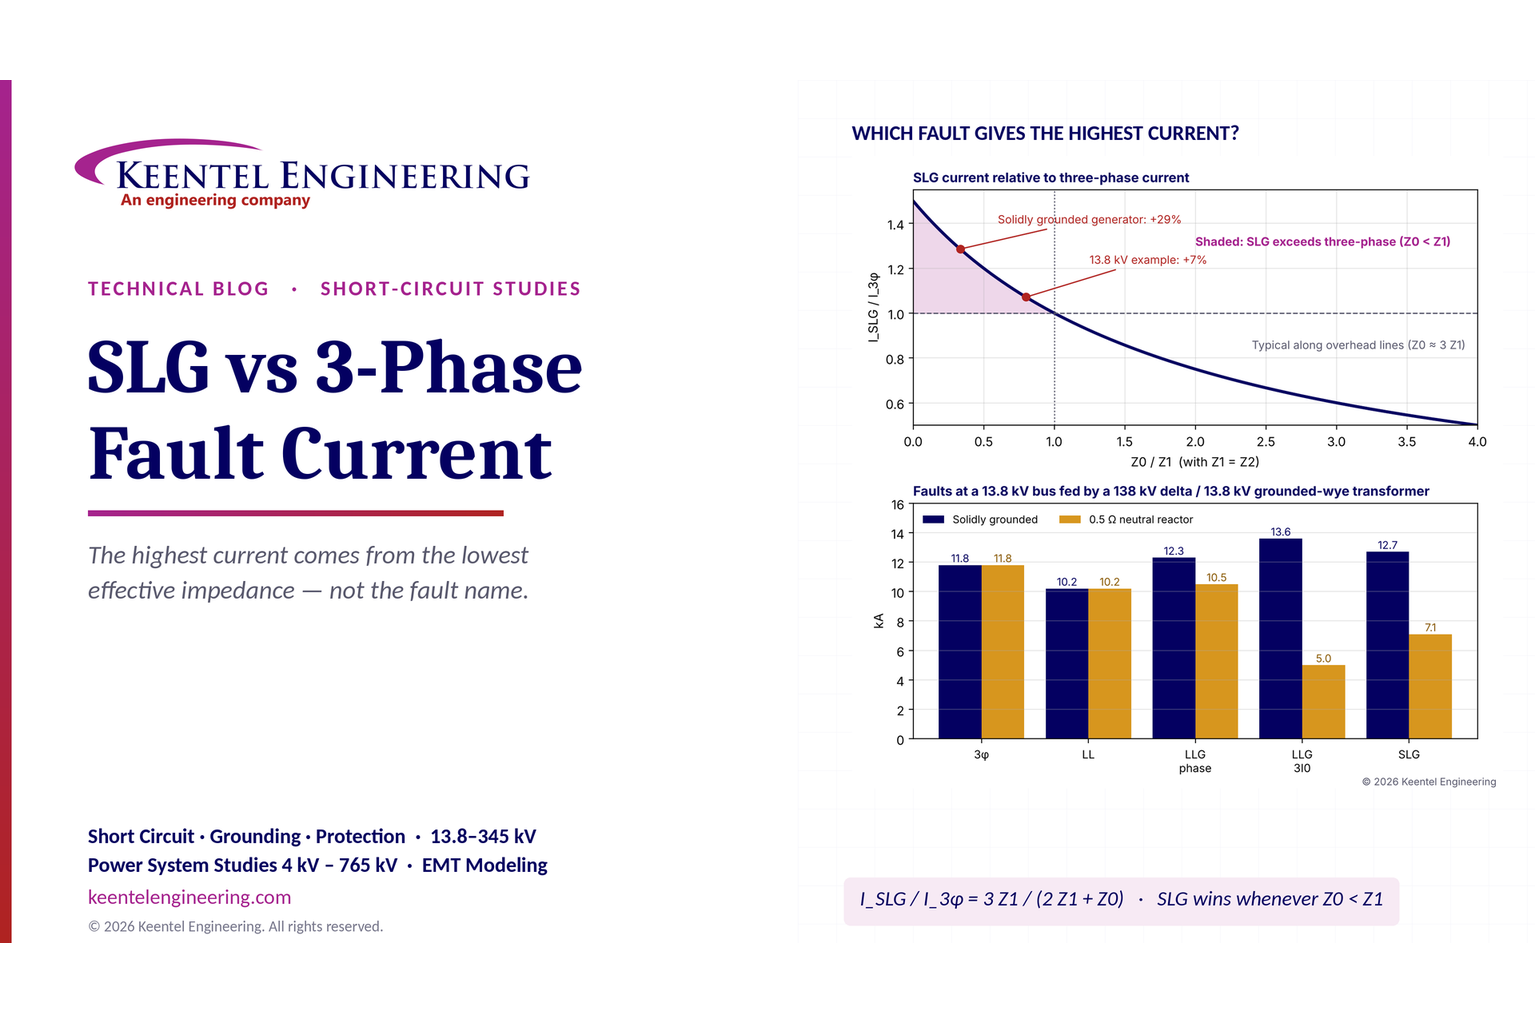
Learn which fault produces the highest current at a bus, why SLG faults can exceed three-phase faults, and how symmetrical components determine fault duty.
By SANDIP R PATEL
•
October 11, 2026
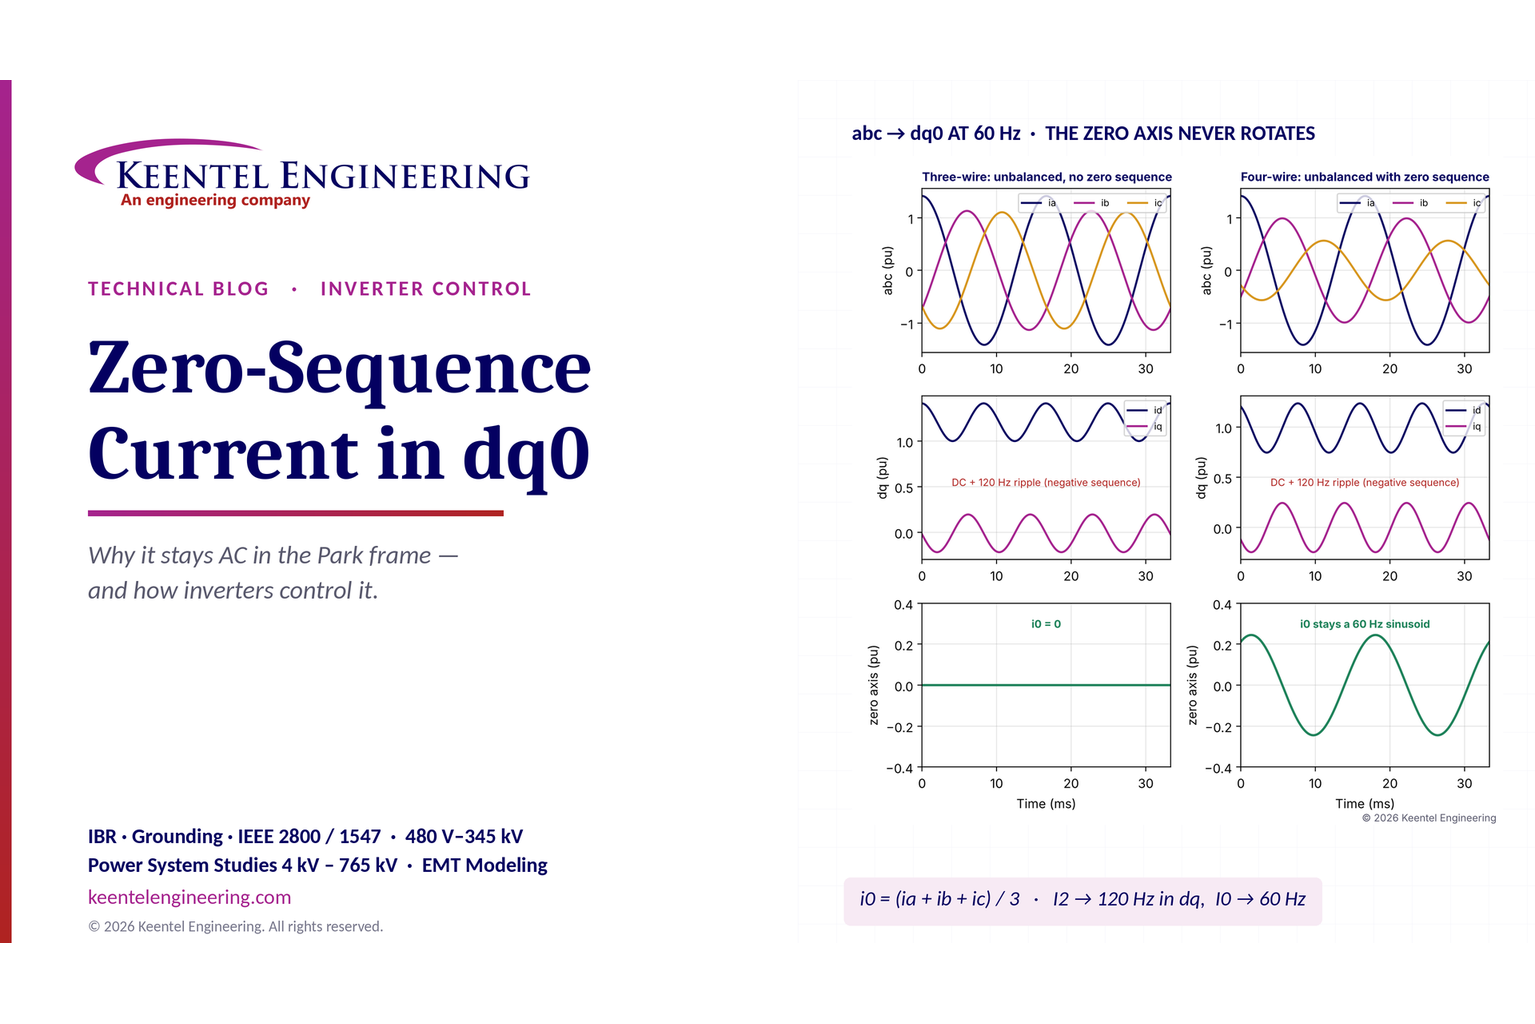
Learn why zero-sequence current pulsates in the dq0 frame, how Park's transformation works, and how inverter controls handle unbalance and ground faults.
By SANDIP R PATEL
•
October 11, 2026
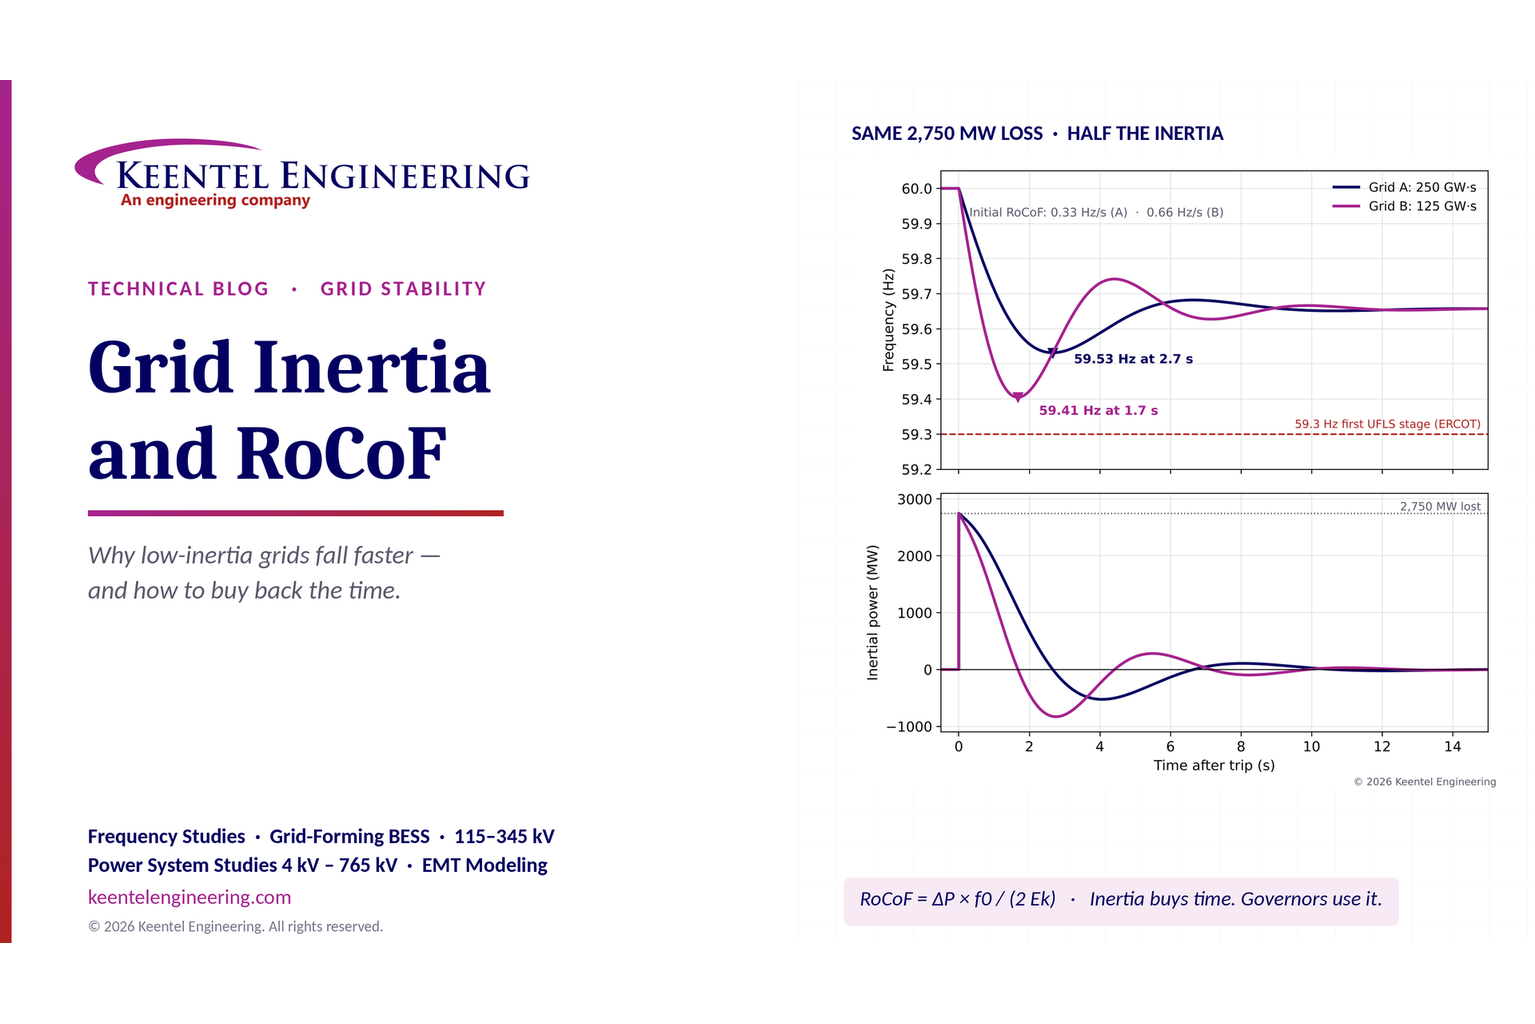
Explore grid inertia, RoCoF and frequency response, with swing equation calculations, frequency nadir analysis and US power system simulation examples.
By SANDIP R PATEL
•
October 11, 2026
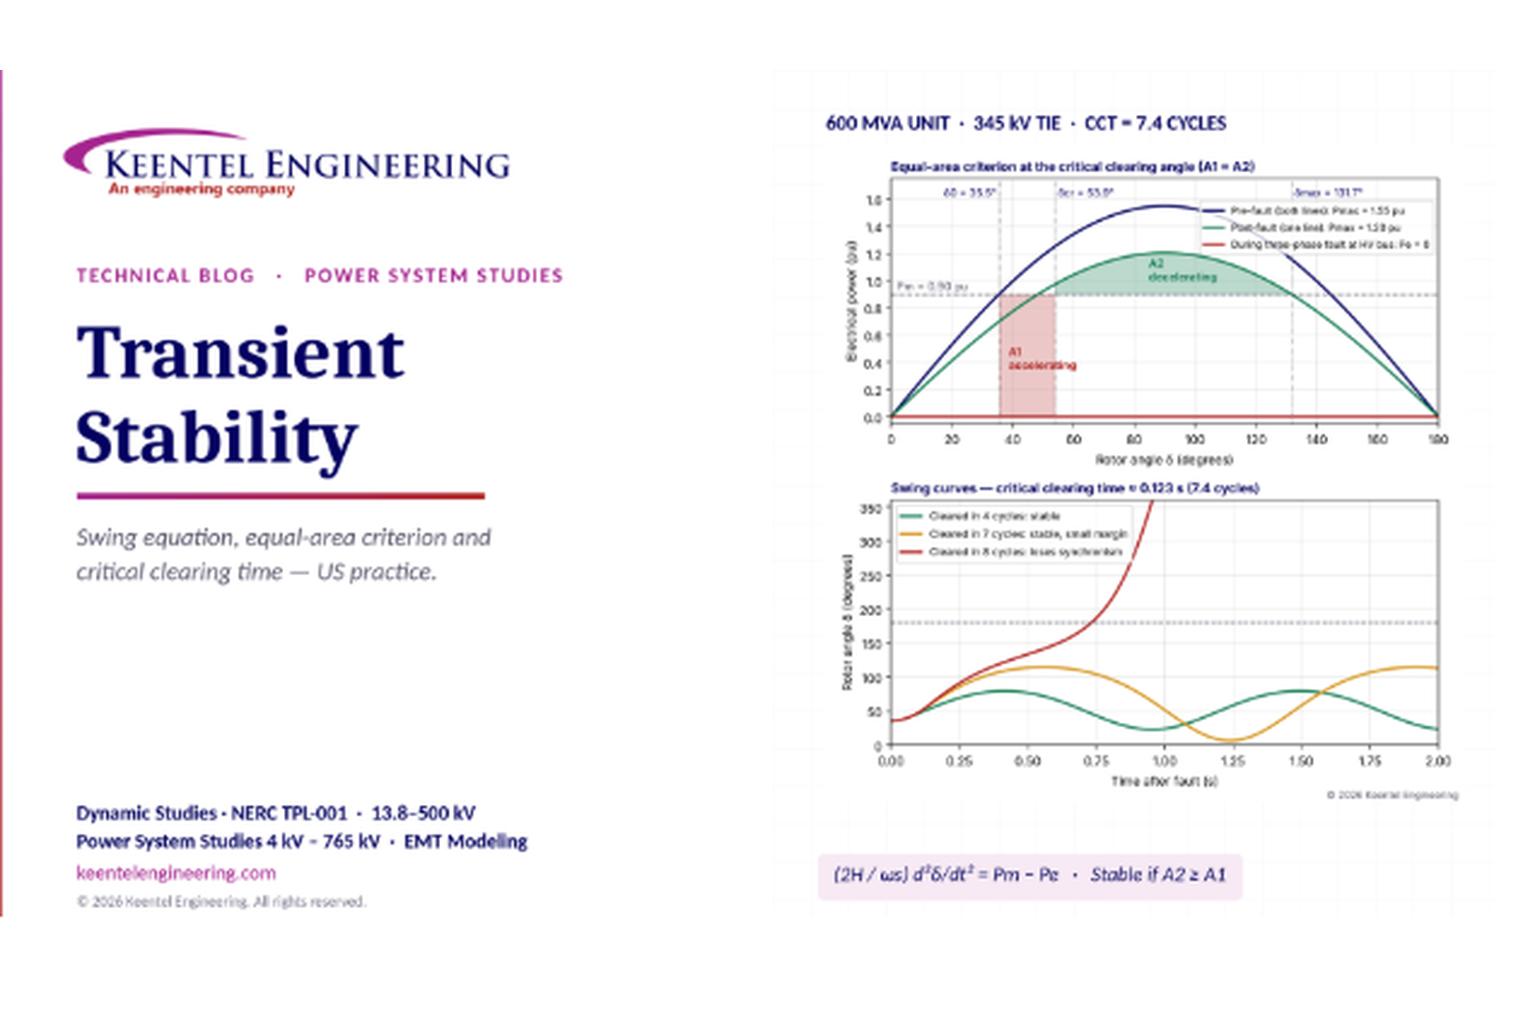
Learn transient stability analysis, swing equation, equal-area criterion and critical clearing time with a 345 kV worked example and NERC TPL-001 guidance.
By SANDIP R PATEL
•
October 11, 2026
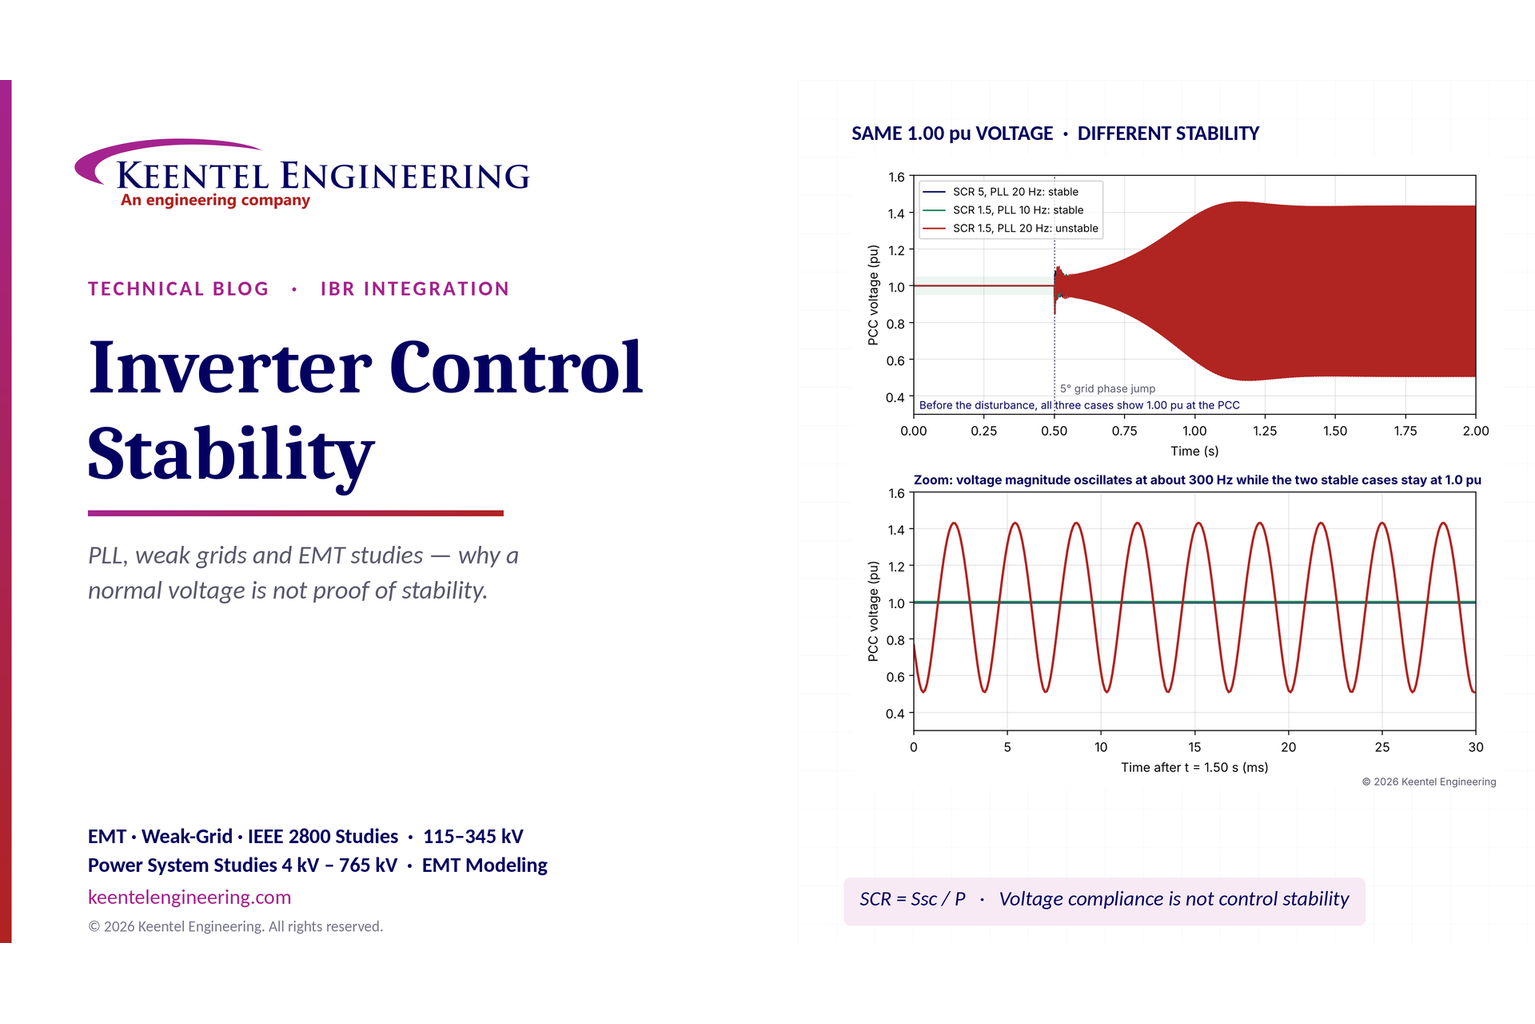
Learn why inverter controls become unstable in weak grids, how PLL bandwidth and SCR affect stability, and how PSCAD EMT studies identify and mitigate oscillations.
By SANDIP R PATEL
•
October 11, 2026
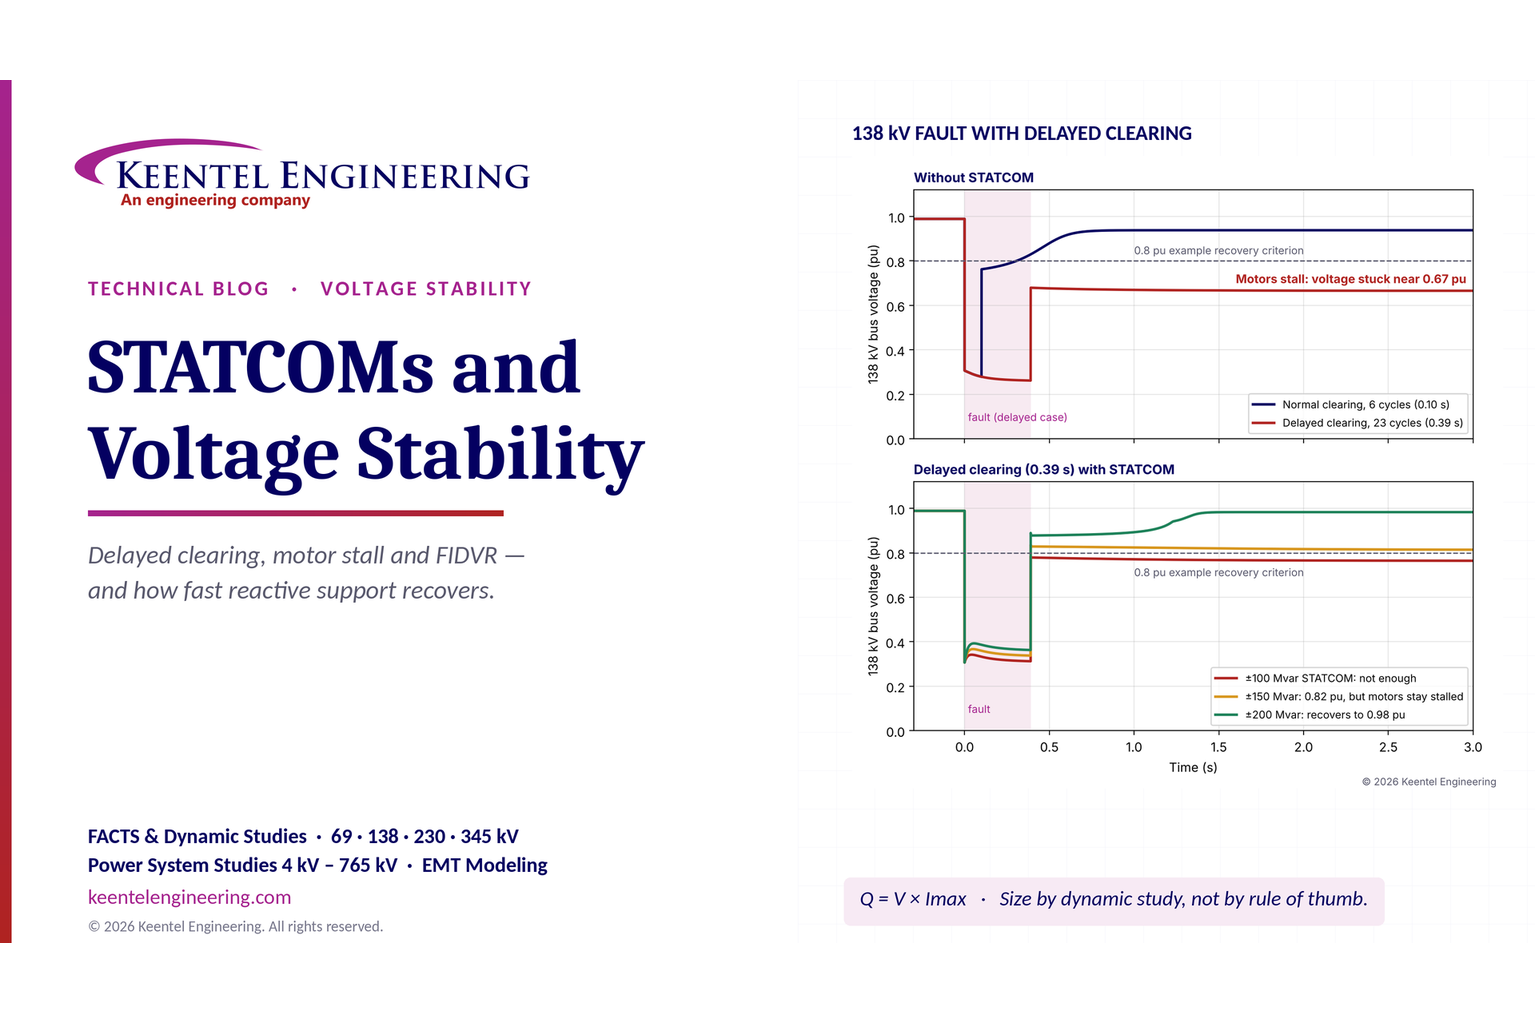
Learn how STATCOMs improve voltage stability and prevent FIDVR. Explore reactive power sizing, delayed fault clearing, NERC criteria and 138 kV simulation results.
By SANDIP R PATEL
•
October 10, 2026
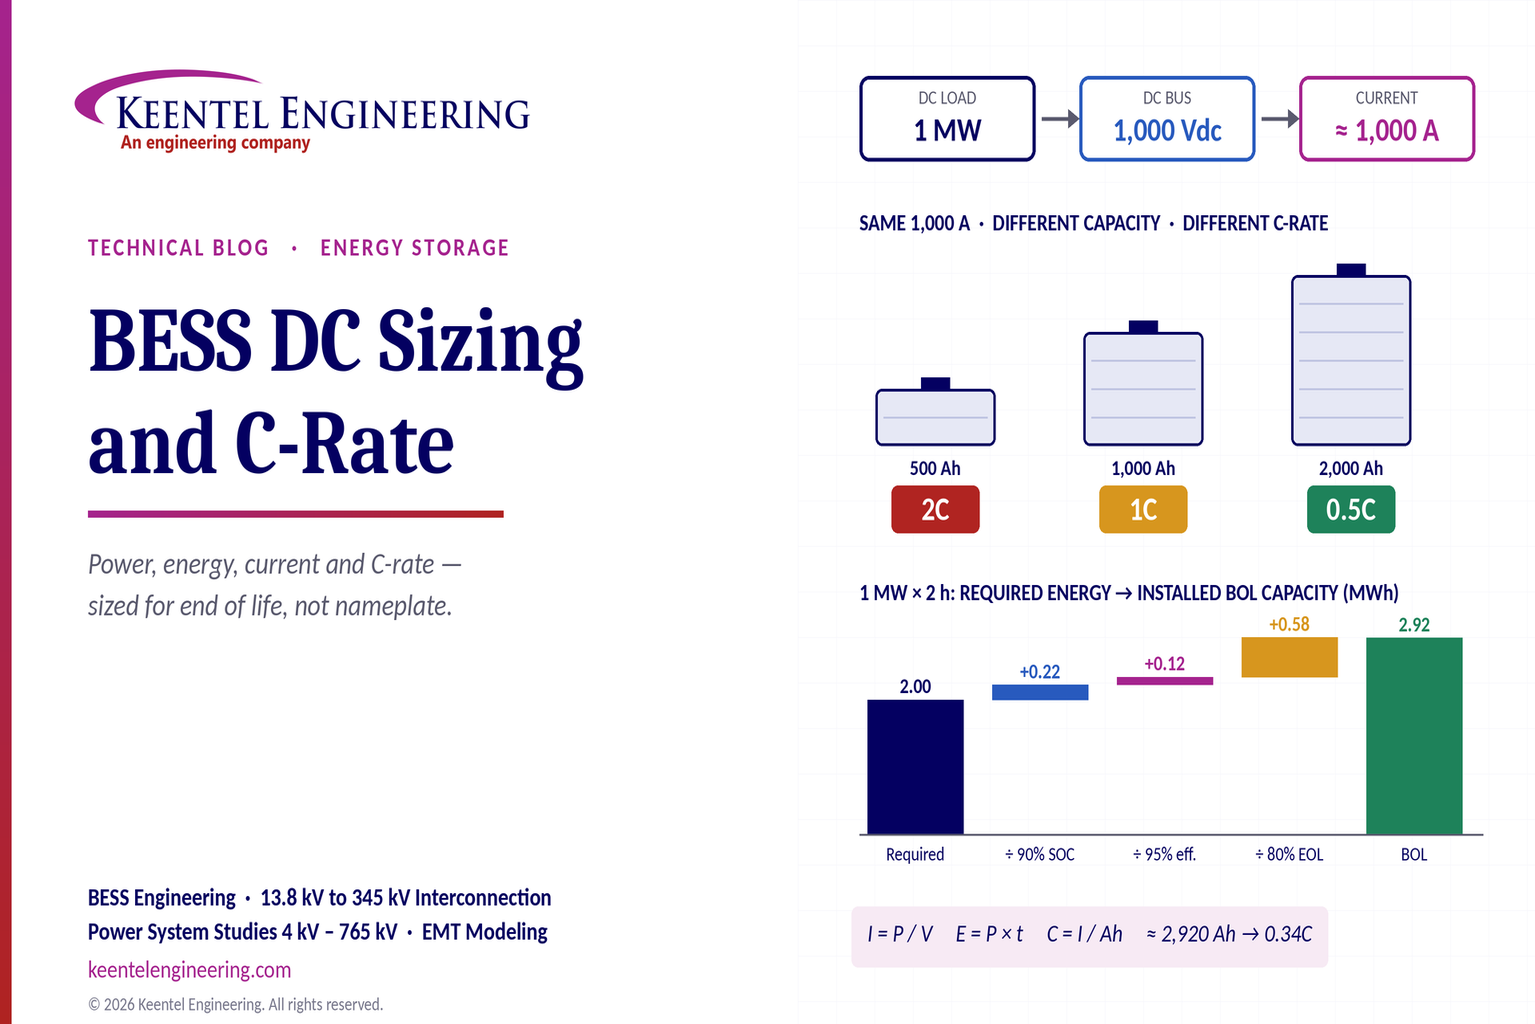
Learn BESS DC sizing with power, energy, current and C-rate calculations, battery losses, degradation and a 100 MW/400 MWh utility-scale example.
By SANDIP R PATEL
•
October 10, 2026
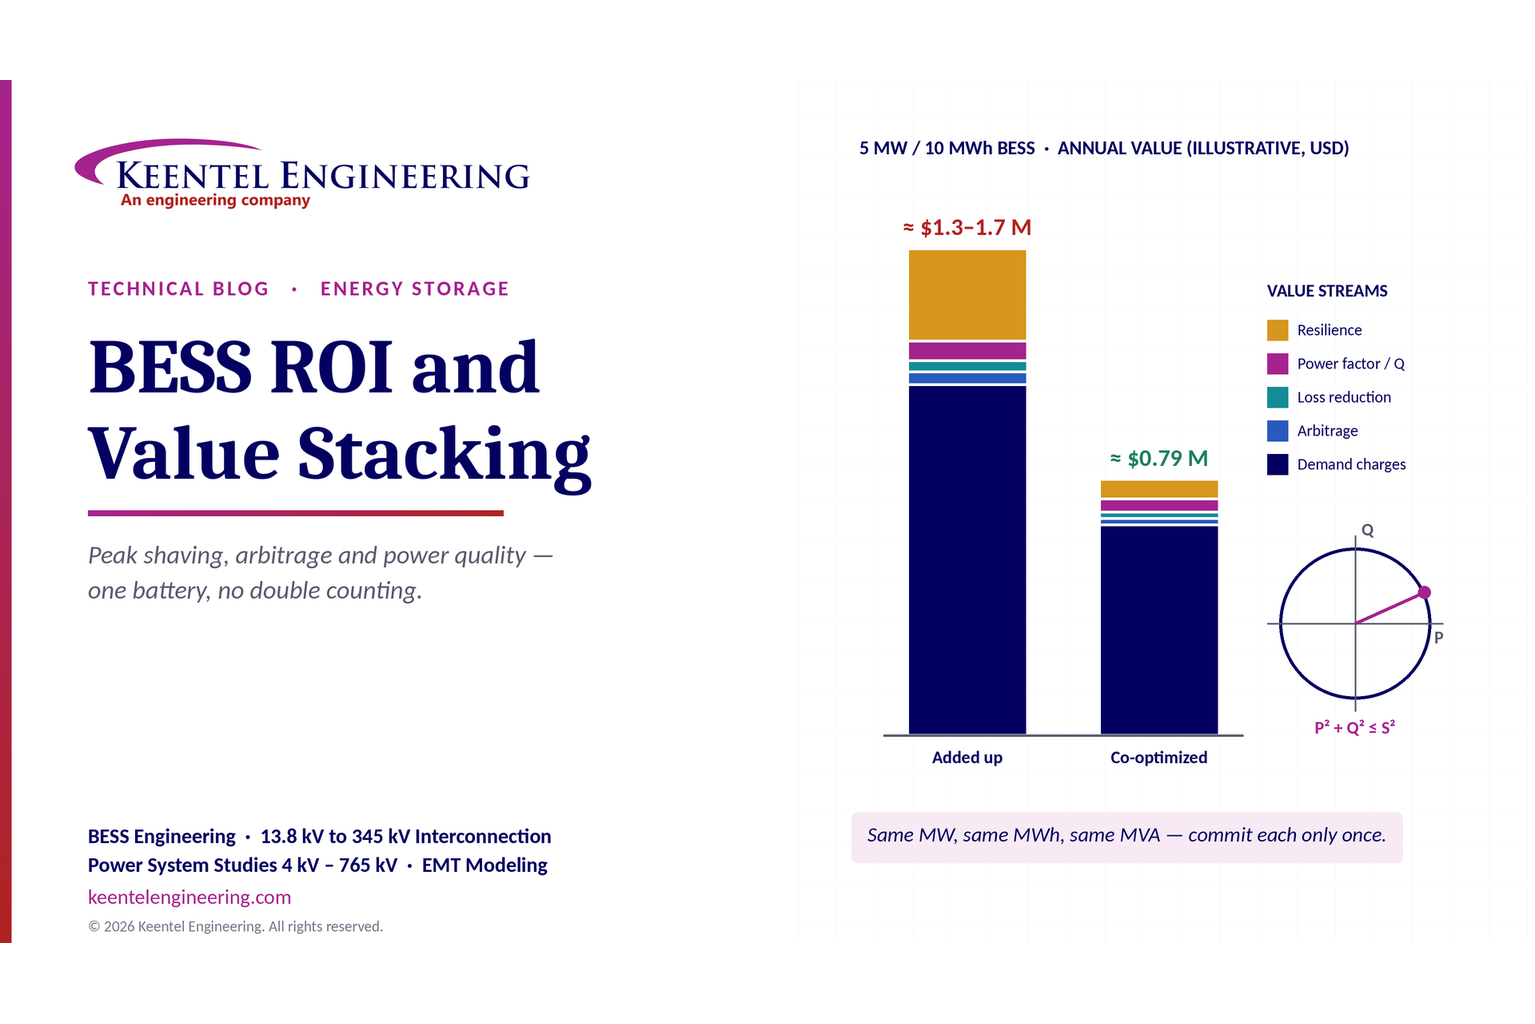
Learn how BESS ROI is calculated using peak shaving, energy arbitrage, power quality and battery storage economics, with a practical 5 MW/10 MWh example.





