
A Coordinated Electric System Interconnection Review—the utility’s deep-dive on technical and cost impacts of your project.
Challenge: Frequent false tripping using conventional electromechanical relays
Solution: SEL-487E integration with multi-terminal differential protection and dynamic inrush restraint
Result: 90% reduction in false trips, saving over $250,000 in downtime
ERCOT enforces all of the above through simulation, which means your model is your compliance case. The bar is now high:
- Whole-facility scope. The model must represent everything the IT load, the UPS and power conversion, the cooling plant, the protection and control systems in formats compatible with ERCOT's study platforms (PSS/E, PSCAD, TSAT).
- Real control loops, not approximations. Generic textbook representations are unacceptable. The model must capture the actual inner control behavior of your power electronics.
- Hardware-validated converter models. For electronic loads, the PSCAD model must be benchmarked against actual hardware testing including voltage ride-through and subsynchronous response. A model assembled from standard PSCAD library blocks fails by definition, because a generic block has never been tested against your vendor's hardware. The good news: validation is a hardware-type test, so results for a given converter product are reusable across every facility that uses it.
- Format migration. Facilities that previously submitted the older composite load model (CMLD) format must transition to EPRI's PERC1 format.
- Three checkpoints. Models are reviewed before the stability study begins (no model, no study), before each quarterly stability assessment, and for electronic loads one final time before energization, when you must submit as-built models with a documented comparison against the previously studied data and a sworn attestation that the model matches actual field settings. ERCOT's review takes 10 business days, extendable by 20 put it on your critical path.
- A living obligation. Change your technology, controls, or relay settings in a way that affects ride-through including converting a crypto mining site to an AI data center — and you've triggered a new interconnection study, even if your megawatts don't change.
| Parameter | Detail |
|---|---|
| System | 230 kV / 138 kV transmission corridors, wind and wet-snow icing exposure |
| Data basis | 15 years of minute-resolution forced-outage records + regional weather observations |
| Core methods | Event grouping, MVA performance curves, time-to-95%-restore, area outage rate curves, fragility modeling, rerun-history benefits, exceedance and log-domain risk metrics |
| Headline result | ≈85% of maximum resilience benefit at 60% of original capital; worst-event restoration window cut from 11 days to 5 in rerun-history terms |
| Decision supported | Capital portfolio selection; resilience plan filing; post-investment verification framework |
| System / Topic | Governing Standard(s) | What It Controls |
|---|---|---|
| Overall plant electrical distribution | IEEE 141 (Red Book); IEEE 666 | Distribution architecture, voltage selection, design of generating station auxiliary service systems |
| Power system studies | IEEE 399 (Brown Book); IEEE 551 | Load flow, symmetrical/asymmetrical short circuit, motor starting methodologies down to the lowest LV panelboard |
| Protection & coordination | IEEE 242 (Buff Book); IEEE 3004.5; IEEE C37 series | Generator relaying (21, 59N, 87G), time-current coordination, selective clearing between LV and MV tiers |
| GSU / UAT / SST transformers | IEEE C57.12.00 and C57 family | Transformer ratings, impedance, testing, loading |
| HV switchyard breakers | IEEE C37.06 | AC high-voltage circuit breaker preferred ratings |
| MV switchgear (13.8 kV) | IEEE C37.20.2; IEEE C37.20.7 | Metal-clad construction, compartmentalization, vacuum breakers; arc-resistant design with plenum venting |
| MV cable | UL 1072; ICEA S-93-639 (NEMA WC 74) | Type MV-105 shielded cable, 133% insulation level for HRG systems |
| LV switchgear (480 V) | IEEE C37.13; UL 1558 | Metal-enclosed LV power circuit breaker switchgear to 635 V, draw-out ACBs with electronic trip units |
| Motor control centers | UL 845; NEMA ICS 18 | LV-MCC construction, MCCB/MCP protection for motors under ~200 HP |
| Motors | NEMA MG-1 | Motor performance, starting characteristics, service factors |
| DC & battery systems | IEEE 485; IEEE 946 | Lead-acid battery sizing (125/250 VDC), DC auxiliary system design |
| Grounding | IEEE 80; IEEE 142 (Green Book) | Ground grid step/touch potential limits; system grounding including high-resistance grounding |
| Lightning protection | IEEE 998 | Direct-stroke shielding of switchyard and outdoor generator structures |
| Arc flash & electrical safety | IEEE 1584; NFPA 70E | Incident energy calculation; worker safety boundaries and PPE |
| Fire protection | NFPA 850 | Fire protection and risk management for combustion turbine generating plants |
| Installation code | NEC (NFPA 70); NESC | Wiring methods inside the plant fence; overhead/outdoor clearances at the switchyard |
| Interconnection & compliance | FERC LGIP; NERC MOD-025/026/027, PRC-019/024/029, FAC-008 | Interconnection process, model validation, protection/ride-through coordination, facility ratings |
| IFC / Construction Deliverable | Purpose |
|---|---|
| Stamped IFC packages | Legal basis for construction; P.E. responsible charge |
| Final relay settings & TCCs | Protection as-installed matches the coordination study |
| Calculation archive | Owner records; NERC audit evidence trail |
| Commissioning procedures | Safe, sequenced energization; MOD field testing |
| Construction support | RFIs, field changes, FAT/SAT witness |
| As-builts & model handoff | Operating baseline; future study currency |
| Metric | Outcome |
|---|---|
| Defects found pre-occupancy | Three topology defects and one settings-mismatch family corrected before load migration; the shared-switchboard defect alone would have invalidated the concurrently-maintainable claim on day one |
| IST findings | Fourteen additional discrepancies surfaced under scenario testing (control logic, alarm mapping, one generator sequencing fault) — all closed before handover instead of during operations |
| Black-building test | Passed on second execution; the first attempt exposed the generator sequencing fault under true block load, exactly the failure the compressed plan would never have found |
| Handover quality | Operations team certified on the actual failure scenarios; corrected EOPs and settings documentation delivered as controlled documents |
| Business outcome | Occupancy proceeded three weeks behind the original date — against an independent estimate that the uncorrected sequencing fault carried a high probability of a full facility outage within the first year |
Part 2 — Frequently Asked Questions: Large Load Interconnection
An electric grid must remain in continuous balance — generation onto the grid must equal consumption from it at every instant. PJM achieves this balance, and prices it, through a layered market architecture. Each layer operates on a different time horizon, and each one touches project economics differently.
| Domain | Key Standards / Codes | What They Govern |
|---|---|---|
| Fire safety | NFPA 855; UL 9540 / UL 9540A | Installation requirements, separation, gas management; system safety listing and thermal-runaway fire testing |
| Grid interconnection | IEEE 1547 (distribution); IEEE 2800 (transmission IBRs) | Ride-through, reactive capability, power quality, and performance at the point of interconnection |
| Power quality | IEEE 519 | Harmonic distortion limits at the PCC |
| Protection & grounding | IEEE 80 / 81 / 142; C37 series | Grounding system design and testing; protective relaying |
| Reliability compliance | NERC standards (incl. PRC ride-through requirements) | Registered-entity obligations for grid-connected storage |
Case Study 2: Protection Channel and Relay Health Monitoring for a Transmission Owner
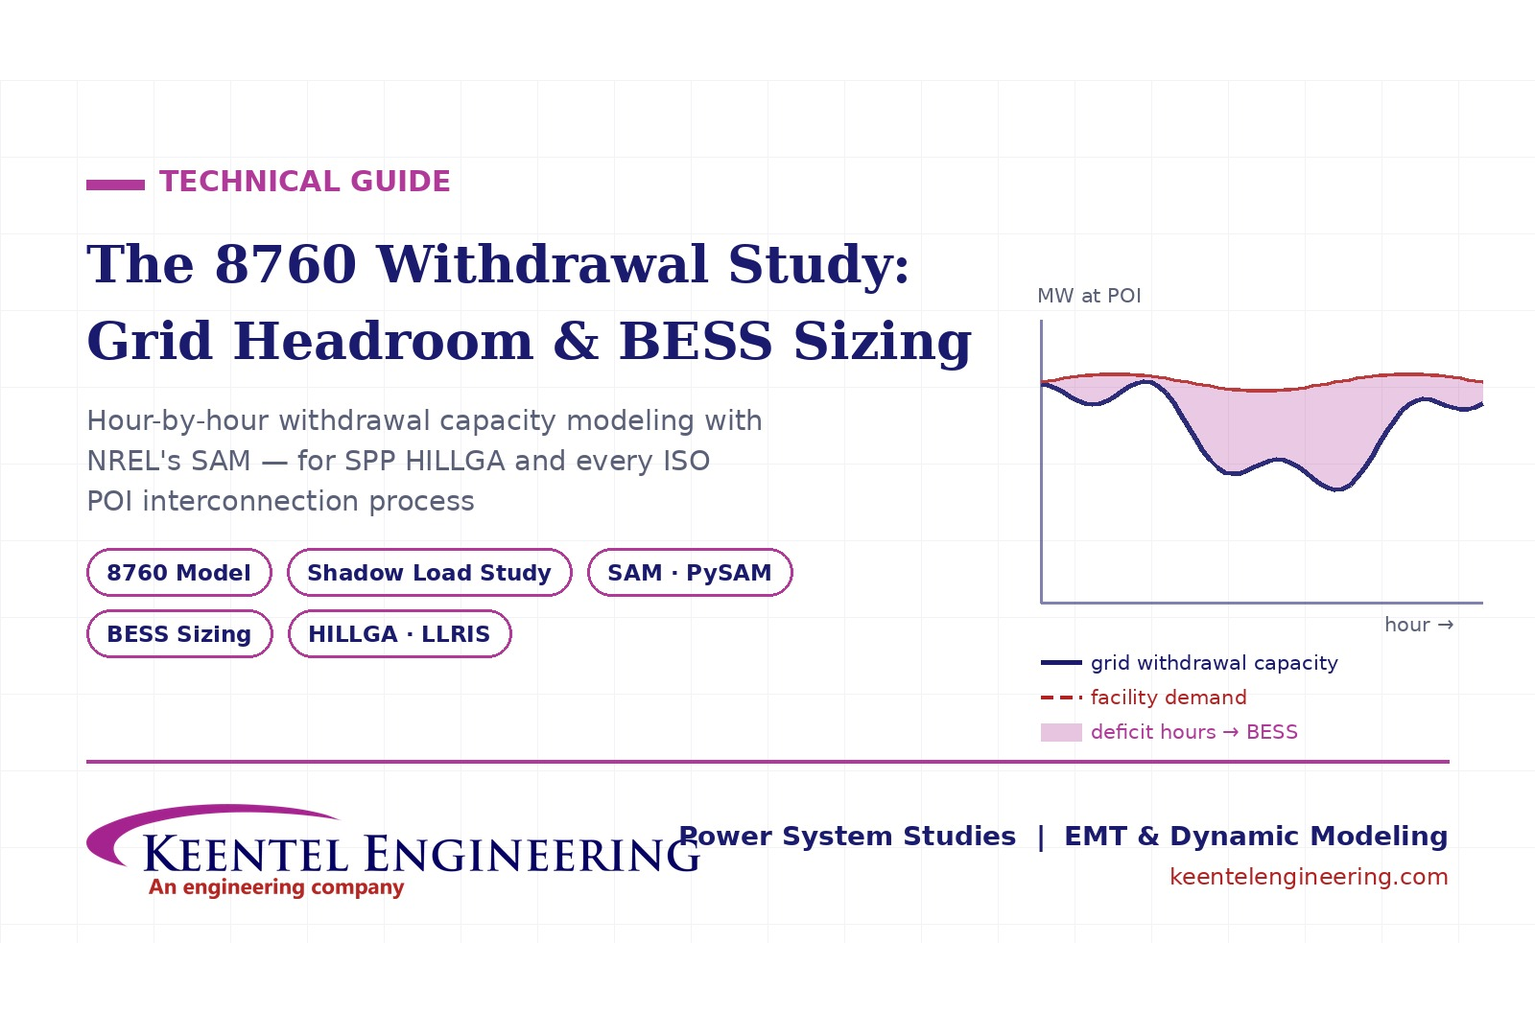
The 8760 Withdrawal Study: How Hourly Grid Headroom Modeling and SAM-Based BESS Sizing Unlock Large Load Interconnection in SPP’s HILLGA and Every Other ISO
Jul 21, 2026 | Blog
By Keentel Engineering — Power System Studies | EMT & Dynamic Modeling | Interconnection Support
Every large load project — every AI data center, crypto campus, electrolyzer, and industrial expansion — eventually collides with the same question, and it is not “will the utility approve us?” It is sharper than that:
How much power can this site actually withdraw from the grid hour by hour, across a real year of system conditions?
That number is not the load’s nameplate. It is not the substation’s transformer rating. It is not a constant. It moves with seasonal facility ratings, system load, generation dispatch, and outages — and at most points of interconnection in America today, it is smaller than developers hope. The gap between what a site wants to draw and what the grid can deliver in its worst hours is precisely why behind-the-meter batteries and on-site generation have become the defining architecture of the AI-era data center.
But you cannot size a battery against a number you do not know. And you should not file an interconnection application around one either.
This article explains the 8760 withdrawal study an hour-by-hour model of grid headroom at your POI — and how Keentel Engineering pairs it with NREL’s System Advisor Model (SAM) to size battery energy storage with national-laboratory-grade rigor. We then walk through how this analysis plugs directly into SPP’s new HILL/HILLGA framework and the interconnection processes of every other major ISO. A detailed FAQ follows.
Part 1: What an 8760 Withdrawal Study Actually Is
“8760” is the number of hours in a year — and an 8760 withdrawal study produces one number for each of them: the maximum MW the site can withdraw from the transmission system in that hour without causing a reliability violation.
Getting there takes three layers of engineering:
Layer 1 — The Shadow Load Study (SLS)
Before anything else, we replicate the analyses the RTO and transmission owner will eventually perform on your application, using the same class of models and methodology they use: AC power flow with thermal and voltage screening at the POI, the applicable NERC TPL-001-aligned contingency set, short circuit review, and system-strength screening (in SPP, consistent with the SCRCCT methodology and its SCR/WSCR/CSCR ≥ 6.0 and CCT ≥ 0.15 s thresholds). The output is foresight: the expected study outcome, the binding constraints, the likely network-upgrade exposure, and the maximum supportable withdrawal by season — known before deposits are paid and the study clock starts.This initial assessment draws on comprehensive power system studies to identify thermal, voltage, stability, and system-strength constraints at the POI.
Layer 2 — The hourly mapping
Grid capability is not one number per season; it is a distribution. We build a representative-state matrix — season × system load level × outage condition × dispatch pattern — solve the withdrawal limit for each state, then map every one of the 8,760 hours of the year to its state using multi-year historical system load, seasonal ratings calendars, outage seasonality, and weather. The result is an hourly withdrawal-capacity time series, with every hour traceable to its governing constraint.
Layer 3 — Deficit analysis
Overlay the facility’s hourly demand profile, and the deficits fall out: which hours the grid comes up short, how deep, how long, how often, and how they cluster. The duration curve and the deficit statistics are the raw material of every design decision that follows — most importantly, the battery.
Part 2: BESS Sizing in SAM Why We Use a National Laboratory’s Tool
Once the deficit hours are known, the battery question sounds simple: big enough to cover them. In practice, naive sizing fails in the details — clustered back-to-back deficit events that a battery cannot recharge between, round-trip losses, degradation over project life, temperature effects, and the subtle trap that recharging the battery is itself grid withdrawal that must fit inside the same hourly headroom.
That is why Keentel performs BESS sizing in NREL’s System Advisor Model (SAM) — the U.S. Department of Energy’s free, open-source techno-economic modeling platform, developed at the National Renewable Energy Laboratory with Sandia, used by more than 130,000 users in 190+ countries, launched somewhere in the world every two minutes, and relied on commercially by utilities and developers including AEP, Southern Company, and EPRI. NREL describes SAM’s battery model as the only publicly available tool of its kind accounting for voltage characteristics and both calendar and cycle degradation — with automated dispatch strategies for behind-the-meter and front-of-meter operation.
Our workflow connects transmission engineering to storage design in one auditable chain:
- PSS®E produces the constraint — the 8760 withdrawal-capacity series from Layers 1–2, built on the RTO’s own models and contingency definitions.
- SAM consumes it — configured as a behind-the-meter battery system: the data center’s hourly demand as the load profile, the on-site PV array modeled from site weather data, the lithium-ion battery with degradation and temperature models enabled, and the withdrawal series applied as the hourly grid import limit. SAM then dispatches the battery through all 8,760 hours: discharging when demand exceeds grid headroom plus PV, recharging from PV surplus and from the grid only within remaining headroom.
- PySAM automates the search — scripted parametric sweeps across battery power and energy candidates, harvesting unmet-load hours, cycling, and end-of-life capacity, to identify the minimum-size frontier that achieves zero unmet load or the client’s chosen reliability target. Weather-year ensembles support probabilistic (P50/P90-style) sizing where the client wants reliability stated statistically.
- Economics ride along for free — with the applicable utility rate structure loaded (from the OpenEI Utility Rate Database or the client’s contract terms), the same simulation quantifies demand-charge and energy-cost impacts of the dispatch, turning a sizing study into an operating pro forma input.
The deliverable is not “we recommend 150 MW / 600 MWh.” It is: here is the hourly headroom at your POI with constraint-level traceability; here is the deficit structure; here is the sizing frontier from a national-lab-validated simulation; here is the recommended size with margin, its sensitivity to weather years and load phasing, and its operating economics. That is a document a lender’s independent engineer can audit — and that an RTO study engineer will recognize as built on their own methodology.
Part 3: How This Unlocks SPP’s HILL and HILLGA Processes
SPP’s High Impact Large Load framework — the HILL Delivery Point Study (HDPS) for loads and the HILLGA generator assessment (Attachment BB) for their dedicated generation — is the newest, fastest large-load pathway in any U.S. RTO. It is also a framework in which the withdrawal study is not merely useful but load-bearing:
It sets the application’s requested MW intelligently. The HDPS clock is 90 days — but only after a complete, validated submittal, and the results are only as good as the MW you request. Oversubscribe a weak POI and the study returns upgrade costs and timelines that kill the pro forma; undersubscribe and you strand capacity. The SLS tells you the answer before SPP does.
It de-risks SCRCCT screening. A 500 MW power-electronic load at a rural POI faces real probability of failing SPP’s system-strength screen, which triggers supplemental EMT studies outside the 90-day window. The withdrawal study’s SCR/WSCR/CSCR and CCT screening quantifies that risk site by site — informing both siting decisions and whether to invest in a submission-ready PSCAD model (which SPP itself recommends providing at application).
It feeds the HILLGA sizing formula and the LLRIS envelope. Under Attachment BB, supporting generation may be sized up to the HILL’s requested MW times the higher of 110% plus the seasonal Planning Reserve Margin or 125% — and once operating, the generator’s injection is tied to the load under Load Limited Resource Interconnection Service. Both the sizing decision and the LLRIS operating envelope are functions of the load’s forecast and the grid’s hourly capability. The 8760 study is, in effect, the quantitative backbone of the HILL ten-year forecast, the generator sizing case, and the BESS that firms the difference.
It converts curtailment-style service into designable numbers. SPP’s conditional pathways trade speed for potential curtailment during system stress. Whether that trade is acceptable is not a philosophy question — it is a deficit-hours question. An hourly headroom model prices the curtailment exposure directly, and sizes the storage that neutralizes it.
For multi-site portfolios, it is the ranking engine. Developers evaluating several candidate sites — increasingly the norm for powered-land strategies — can compare hourly headroom, deficit depth and duration, upgrade exposure, system strength, and required BESS size on one normalized matrix, and put capital where the electrons are.
Part 4: The Same Analysis Travels to Every Other ISO
The tariff names change; the physics does not. Every organized market now confronts the same collision between hyperscale load growth and finite transmission headroom, and each is building processes where hourly withdrawal modeling pays:
ERCOT
The original large flexible load market. ERCOT’s interconnection framework for large loads — with its emphasis on load flexibility, curtailability, and (for co-located configurations) netting arrangements — is fundamentally an hourly-headroom conversation. An 8760 model quantifies exactly how much firm service a site can count on, what a curtailable arrangement is actually worth, and what storage converts flexible access into firm compute capacity. Notably, SPP expressly drew on ERCOT’s large electronic load ride-through philosophy in writing its HILL requirements — experience in one footprint transfers to the other, and Keentel’s large-load practice spans both, from 50 MW to 1 GW engagements.
CAISO and the California utilities
Load interconnects through the distribution/transmission planning processes of the IOUs (Rule 21 territory and wholesale distribution access), where hosting capacity, deliverability, and grid-code compliance dominate. The same headroom-and-storage logic applies at the POI, and California’s rate structures make the SAM economic layer especially valuable — demand charges and TOU spreads materially change optimal BESS dispatch.
PJM and MISO
Both are actively reforming large-load interconnection amid unprecedented data center queues. Load additions flow through transmission-owner load interconnection procedures and RTO planning review; co-located load-at-generation configurations have drawn intense FERC attention in PJM. In either footprint, arriving with an independent withdrawal analysis — built on the RTO’s planning models and TPL-aligned contingencies — collapses study surprise and positions the BESS as a designed mitigation rather than an afterthought.
NYISO and ISO-NE
Smaller footprints, tighter systems, and aggressive state clean-energy overlays make headroom scarcer and the storage case stronger; the methodology is identical.
Across all of them, the through-line is this: the RTO’s study tells you what the grid will give you; the withdrawal study tells you first — and the SAM layer turns the shortfall into a designed, priced, financeable storage solution. Keentel performs this stack with the same disciplines in every market: the RTO’s own models where accessible, TPL-001-aligned contingency frameworks, system-strength screening, and NREL-toolchain storage design, all under the responsible charge of a licensed Professional Engineer.
Part 5: What a Keentel 8760 Withdrawal & BESS Study Includes
- Shadow Load Study report — binding constraints, indicative upgrade exposure, seasonal maximum-withdrawal table, short circuit review, and system-strength screening with supplemental-study risk rating.
- Methodology alignment memo — a mapping of every analysis to the corresponding RTO/TO study element, so results are directly comparable to the official study when it arrives.
- 8760 withdrawal-capacity time series (Excel/CSV) with hour-level traceability to governing constraints, plus duration curves and deficit statistics.
- SAM-based BESS sizing — the feasible-size frontier, recommended power/energy with engineering margin, weather-year and load-phasing sensitivities, degradation-aware end-of-life performance, and dispatch economics under the applicable rate structure.
- Portfolio comparison matrix (multi-site programs) — normalized site ranking for capital allocation.
- Application-ready outputs — the forecast, single-line, and load modeling data (CMLD/PERC1) that flow directly into the interconnection submittal, with PSCAD EMT models available where system-strength screening warrants.
Work With Keentel Engineering
Keentel Engineering provides the complete withdrawal-study stack — Shadow Load Studies, 8760 withdrawal-capacity modeling, SAM-based BESS sizing, and the application, dynamic modeling (CMLD/PERC1), and PSCAD EMT deliverables that follow — for large loads across SPP, ERCOT, CAISO, PJM, and every North American market.
Evaluating sites? Preparing an application? Staring at a study report you didn’t expect? Contact us at contact@keentelengineering.com or 813-389-7871, or visit keentelengineering.com to schedule a technical consultation.
Our Offices: - Head Office – Tampa, FL: 400 N Ashley Dr, STE #2600, Tampa, FL 33602 · (813) 389-7871 - Austin, TX: 5900 Balcones Drive, STE 100, Austin, TX 78731 · (512) 591-0752 - Sacramento, CA: 1401 21st St, Ste R, Sacramento, CA 95811 · (916) 913-4524 - Baltimore, MD: 306 W Redwood St, STE 200, Baltimore, MD 21201 · (410) 225-2181
This article reflects SPP’s HILL/HILLGA framework (RR696/RR720/RR724, Attachment BB, BP 7250/7850)
Frequently Asked Questions
Q1: What exactly does “withdrawal capacity” mean, and how is it different from my interconnection capacity or transformer rating?
Withdrawal capacity is the maximum power your facility can draw from the transmission system in a given hour without causing a criteria violation — a thermal overload, a voltage limit breach, or a stability problem — anywhere on the monitored network under the applicable contingency set. Your transformer rating is a piece of equipment; your contractual interconnection capacity is a legal number; withdrawal capacity is a physics number, and it is the binding one. It varies hour to hour because line ratings change with season (and increasingly with ambient conditions), because the surrounding system’s loading changes with regional demand and dispatch, and because the contingency that binds on a summer peak afternoon may be irrelevant on a mild spring night. An 8760 study makes that variation explicit instead of hiding it behind a single conservative number.
Q2: Why 8,760 hours? Wouldn’t a summer-peak and winter-peak study be enough?
Peak studies answer the RTO’s question — is the system reliable at its stress points? They do not answer the developer’s questions: how much energy can I actually serve across the year, how big must my battery be, and what will my curtailment exposure cost? Those are distribution questions, not point questions. The deficit that sizes your battery’s energy rating may not occur at system peak at all — it may be a shoulder-season evening with a key line out for maintenance. Only an hourly model exposes deficit duration, frequency, and clustering — the parameters that determine whether a 4-hour battery suffices or a 10-hour system is needed, and whether recharge windows exist between events.
Q3: How do you actually build the hourly series — do you run 8,760 power flow studies?
Not naively. We use a representative-conditions methodology: define a matrix of system states (season × load level × outage condition × dispatch pattern — typically 20 to 40 states), solve the maximum-withdrawal limit for each state with an automated bisection search in PSS®E across the full contingency set, then classify each of the year’s 8,760 hours into a state using multi-year historical system load data, seasonal ratings calendars, outage seasonality, and weather. Every hour’s capacity value is traceable to its state and binding constraint. Where a client requires it, full discrete-hour AC contingency simulation is available as an extended scope — but for siting, application, and BESS sizing decisions, the representative-state approach delivers the needed fidelity at a fraction of the cost, and we validate the classifier statistically against the historical record.
Q4: Why SAM for the battery sizing instead of a spreadsheet or a proprietary tool?
Three reasons. Fidelity: SAM’s lithium-ion model captures round-trip efficiency, voltage behavior, temperature, and both calendar and cycle degradation — so the battery that meets year-1 deficits is checked against year-10 capacity, and clustered deficit events are tested against actual state-of-charge trajectories rather than energy arithmetic. Auditability: SAM is free, open-source, NREL/DOE-maintained, and used by 130,000+ practitioners including major utilities — a lender’s independent engineer can download the tool and rerun our files, which is not true of proprietary black boxes or bespoke spreadsheets. Automation: the PySAM interface lets us sweep hundreds of power/energy combinations programmatically and publish the full feasibility frontier, not a single point answer. The one thing SAM does not do is power flow — which is why the transmission layer stays in PSS®E and hands SAM the hourly grid limit as a constraint.
Q5: How does the battery’s recharging get handled? Doesn’t charging the BESS consume the same grid headroom?
Yes — and this is the failure mode of simplistic sizing. A battery that covers Monday’s deficit is useless Tuesday if there was no headroom to recharge it Monday night. In our workflow the 8760 withdrawal series is applied inside SAM as the hourly grid import limit governing total facility draw — load plus charging. The dispatch simulation therefore only recharges when and to the extent surplus headroom exists (or from on-site PV), and any sizing candidate that cannot maintain state of charge through clustered deficit sequences shows up as unmet load and is rejected. Recharge feasibility is enforced by construction, not checked as an afterthought.
Q6: We’re pursuing SPP’s HILLGA for co-located generation. Where does the 8760 study fit?
In at least four places. First, the load’s requested MW — which the withdrawal study right-sizes — anchors everything: the HDPS scope, the ten-year forecast, and the HILLGA generator sizing ceiling (the load’s MW times the higher of 110% plus seasonal Planning Reserve Margin, or 125%, per Attachment BB §3.1.1). Second, under LLRIS the generator’s permitted injection follows the load, so the load’s hourly profile against grid headroom defines the operating regime the generation and storage must serve. Third, the study’s SCRCCT-consistent screening quantifies the probability of triggering supplemental EMT studies — informing whether to submit a PSCAD model with the application, as SPP recommends. Fourth, for the storage itself: SPP’s framework contemplates BESS roles both behind the meter and as market resources, and the deficit analysis is what determines the size and duty cycle either way.
Q7: Does this help even if our configuration is behind-the-meter and non-exporting?
Especially then. A non-exporting BTM PV/BESS configuration exists for one purpose: to firm the facility against the grid’s limitations without triggering generator-export interconnection machinery. Its entire design basis is the hourly gap between facility demand and grid withdrawal capability. Note also that non-exporting configurations raise a threshold jurisdictional question in SPP — whether the equipment falls under the HILLGA/Attachment BB path or the non-jurisdictional generation procedures of Business Practice 7250 (transmission owner notification for units ≥5 MW, potential affected-system agreements, and Market Storage Unit registration decisions for the BESS). Keentel performs that lane determination as a first task, because it changes the application strategy entirely.
Q8: How accurate is a shadow study — will SPP or the TO get the same answer?
We build the SLS to be methodology-aligned, and we document that alignment element by element: same class of planning models (obtained through the RTO’s data processes under executed confidentiality agreements), TPL-001-aligned contingency definitions — in SPP, the transmission owners’ own contingency files and naming conventions where available — and criteria drawn from the RTO’s planning documents and the TO’s zonal criteria. Perfect prediction is not the claim; the official study may use a newer model build or updated assumptions. The claim is that surprises shrink from existential to marginal: a developer who has run the shadow study negotiates details in the study report; one who has not discovers, months and a deposit later, what the site can actually support. In our experience the shadow study’s binding constraints and order-of-magnitude upgrade exposure are what the official study confirms.
Q9: What data do you need from us, and what do you obtain independently?
From the client: the POI or candidate substation(s), target load MW and phasing plan, the facility’s hourly demand profile assumptions, planned PV and BESS parameters (if pre-selected — otherwise sizing is our output, not our input), and any prior utility correspondence. Independently, under the RTO’s confidentiality processes: the planning power flow and dynamics models, short circuit models, and contingency definitions. From public sources: historical hourly system load, ratings calendars, outage patterns, weather, and utility rate structures. A typical single-site study completes in four to six weeks from data availability; multi-site portfolios run in parallel waves on a shared base-case foundation.
Q10: Can the 8760 results be used directly in our interconnection application?
The withdrawal series itself is a planning product, not an application form — but its outputs populate the application everywhere it matters: the requested MW, the ten-year seasonal forecast, the load phasing story, the BESS parameters on the single-line, and (in SPP) the load-behavior detail requested by the Additional HILL Characteristics Form under Business Practice 7850. Just as importantly, it arms the applicant for the scoping call and study-review process: when the TO’s study engineer raises a constraint, your team has already analyzed it. We routinely carry the same engagement forward into application preparation, dynamic load modeling (CMLD and PERC1 — SPP’s preferred model), and PSCAD EMT modeling, so the analysis chain from headroom to submittal is one consistent model set.
Q11: Our load is flexible — we can curtail training workloads. Does that change the analysis?
It changes it from a sizing study into an optimization. Flexibility is a resource with a value: every MW-hour of curtailable load reduces required BESS energy one-for-one during deficit hours, at the cost of lost compute. With the hourly deficit series in hand, that trade is computable — we can quantify how many hours per year flexibility would be called, at what depth, and compare the economics of storage capex against curtailment opportunity cost across sizing candidates. In markets like ERCOT, where flexible-load frameworks are explicit, and in SPP’s conditional service constructs, this analysis is precisely how a developer decides how much firmness to buy versus how much flexibility to sell.
Q12: What makes Keentel qualified to do this work?
The stack requires two disciplines that rarely live in one team: RTO-grade transmission study engineering and storage/renewables system modeling. Keentel’s 32-engineer practice does both. On the transmission side: SPP generation interconnection experience across five projects totaling roughly 950 MW (including a 300 MW project in Nebraska), active SPP HILL-process engagements for data center developers, and large-load modeling work spanning ERCOT, CAISO, and PJM from 50 MW to 1 GW — with deep working command of SPP’s HILL/HILLGA framework, SCRCCT screening, fault ride-through requirements, and BP 7850 load modeling standards. On the design side: NREL-toolchain (SAM/PySAM) storage and PV modeling with degradation-aware, economics-integrated sizing. All work is performed under the responsible charge of a licensed Professional Engineer, with P.E. services available in all 50 states.

About the Author:
Sandip "Sonny" R. Patel, P.E.
IEEE Senior Member · Founder & CEO, Keentel Engineering
In 1995, Sonny Patel earned his Electrical Engineering degree from the University of Illinois. But degrees don't build legacies — action does.
For three decades, he has worked the power industry from every side of the table: 16 years as a utility engineer at Exelon/Commonwealth Edison; generation leadership across hydroelectric, industrial steam turbine, and a 9 GW renewable fleet; NERC Regional Entity Senior Compliance Engineer and Audit Team Lead, auditing some of the nation's largest utilities; and testing and commissioning lead on equipment up to 765 kV — the very top of the North American grid.Utility. Generator. Regulator. Consultant. Few engineers have seen all four seats. Fewer still have sat in them.
His experience spans nuclear, hydro, conventional generation, renewables, oil and gas, mining — and today's data centers, where he is authoring a three-book series on data center design. He is a Licensed Professional Engineer in six states and a Licensed Electrical Contractor in Florida (Unlimited EC) — he doesn't just design the work; he's qualified to stand behind its execution.Today, as Founder and CEO of Keentel Engineering, Sonny leads a nationwide team of engineers delivering substation design, power system studies, NERC compliance, and commissioning — done right, coast to coast.Three decades. Every side of the table. One standard: accountable engineering.
Services

Let's Discuss Your Project
Let's book a call to discuss your electrical engineering project that we can help you with.
About the Author:
Sandip "Sonny" R. Patel, P.E.
IEEE Senior Member · Founder & CEO, Keentel Engineering
In 1995, Sonny Patel earned his Electrical Engineering degree from the University of Illinois. But degrees don't build legacies — action does.
For three decades, he has worked the power industry from every side of the table: 16 years as a utility engineer at Exelon/Commonwealth Edison; generation leadership across hydroelectric, industrial steam turbine, and a 9 GW renewable fleet; NERC Regional Entity Senior Compliance Engineer and Audit Team Lead, auditing some of the nation's largest utilities; and testing and commissioning lead on equipment up to 765 kV — the very top of the North American grid.
Utility. Generator. Regulator. Consultant. Few engineers have seen all four seats. Fewer still have sat in them.
His experience spans nuclear, hydro, conventional generation, renewables, oil and gas, mining — and today's data centers, where he is authoring a three-book series on data center design. He is a Licensed Professional Engineer in six states and a Licensed Electrical Contractor in Florida (Unlimited EC) — he doesn't just design the work; he's qualified to stand behind its execution.
Today, as Founder and CEO of Keentel Engineering, Sonny leads a nationwide team of engineers delivering substation design, power system studies, NERC compliance, and commissioning — done right, coast to coast.Three decades. Every side of the table. One standard: accountable engineering.
Leave a Comment
Thank you for contacting us.
We will get back to you as soon as possible.
We will get back to you as soon as possible.
Oops, there was an error sending your message.
Please try again later.
Please try again later.
Related Posts
By SANDIP R PATEL
•
October 13, 2026
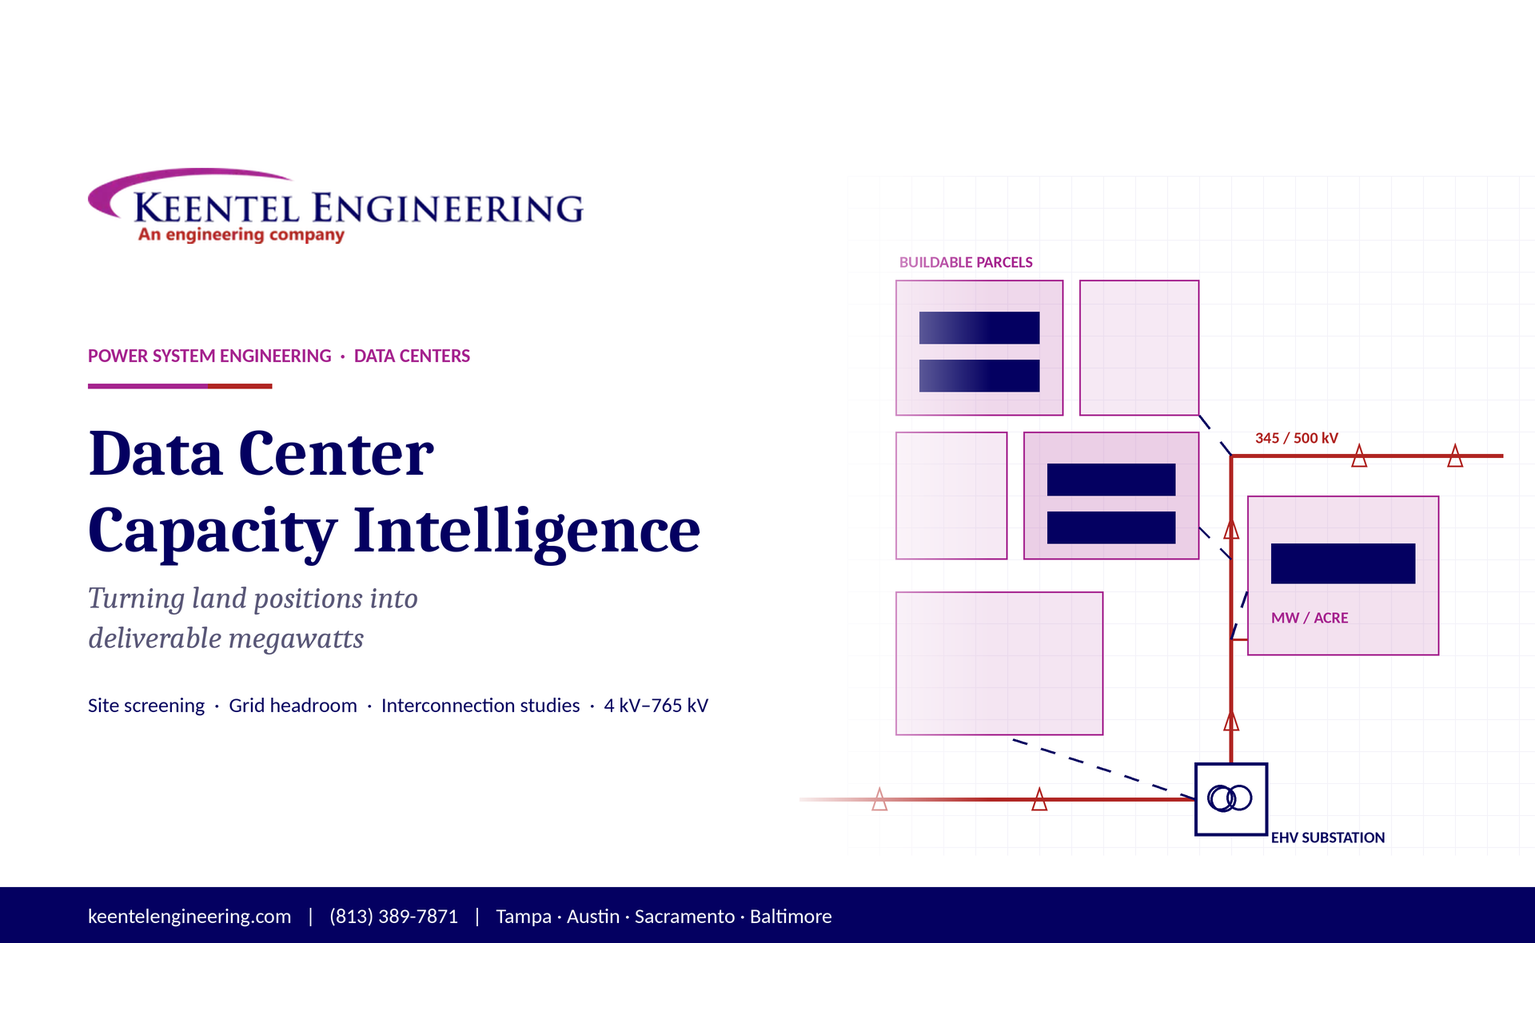
Plan data center capacity with land screening, MW-per-acre estimates, grid power availability and interconnection feasibility studies from Keentel Engineering.
By SANDIP R PATEL
•
October 11, 2026
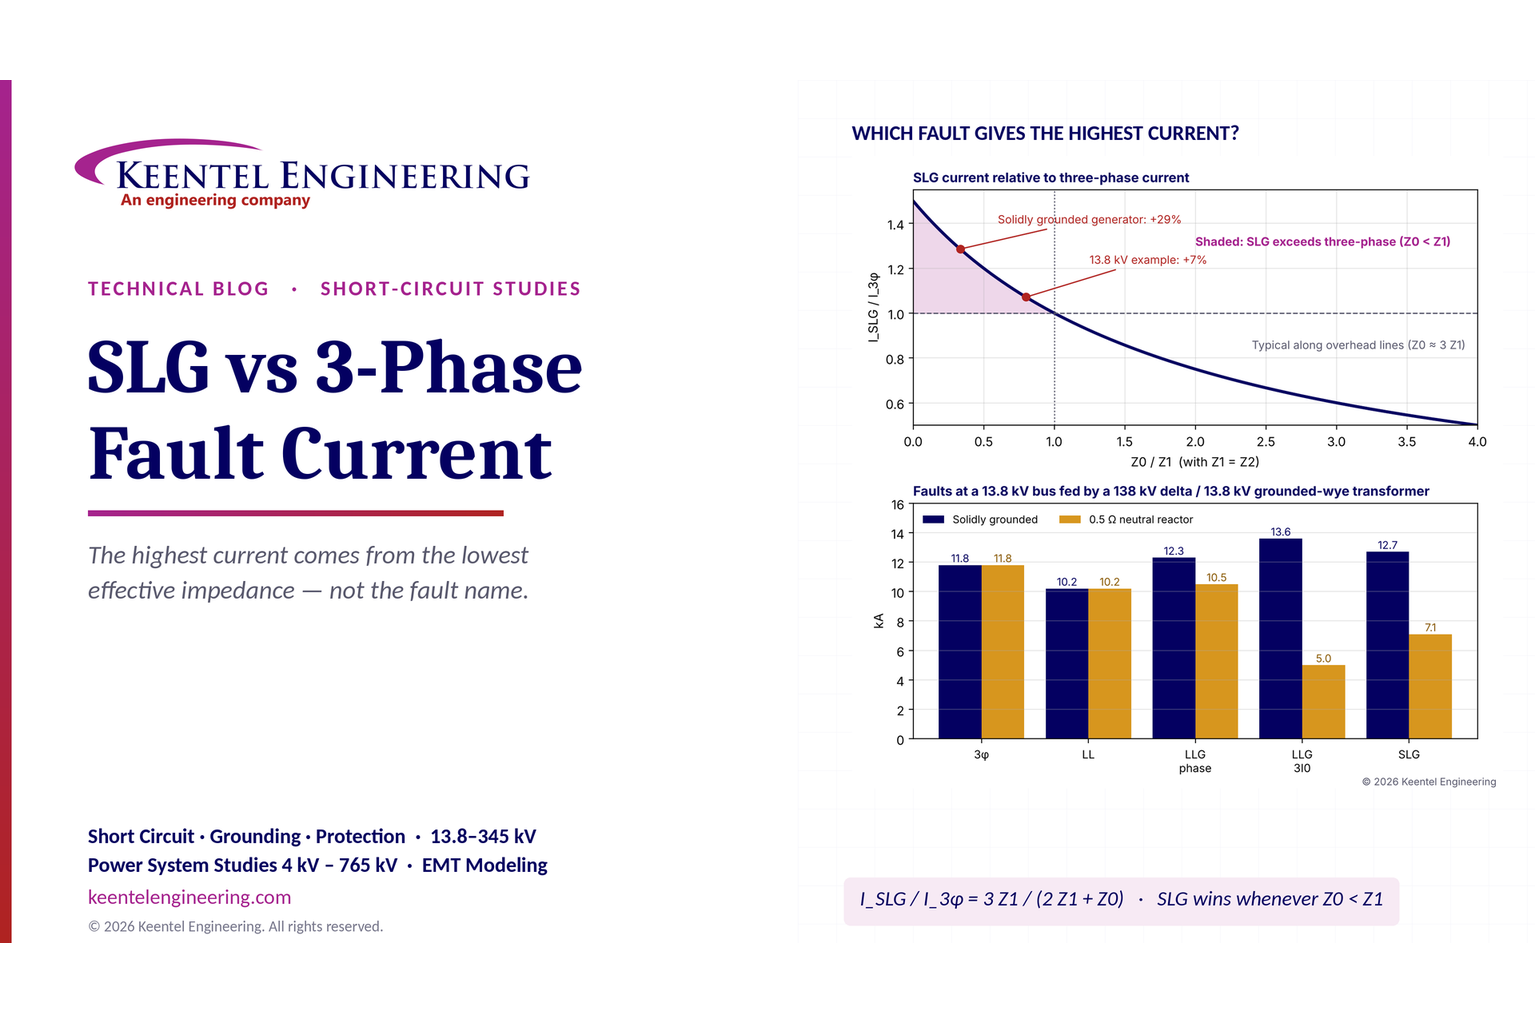
Learn which fault produces the highest current at a bus, why SLG faults can exceed three-phase faults, and how symmetrical components determine fault duty.
By SANDIP R PATEL
•
October 11, 2026
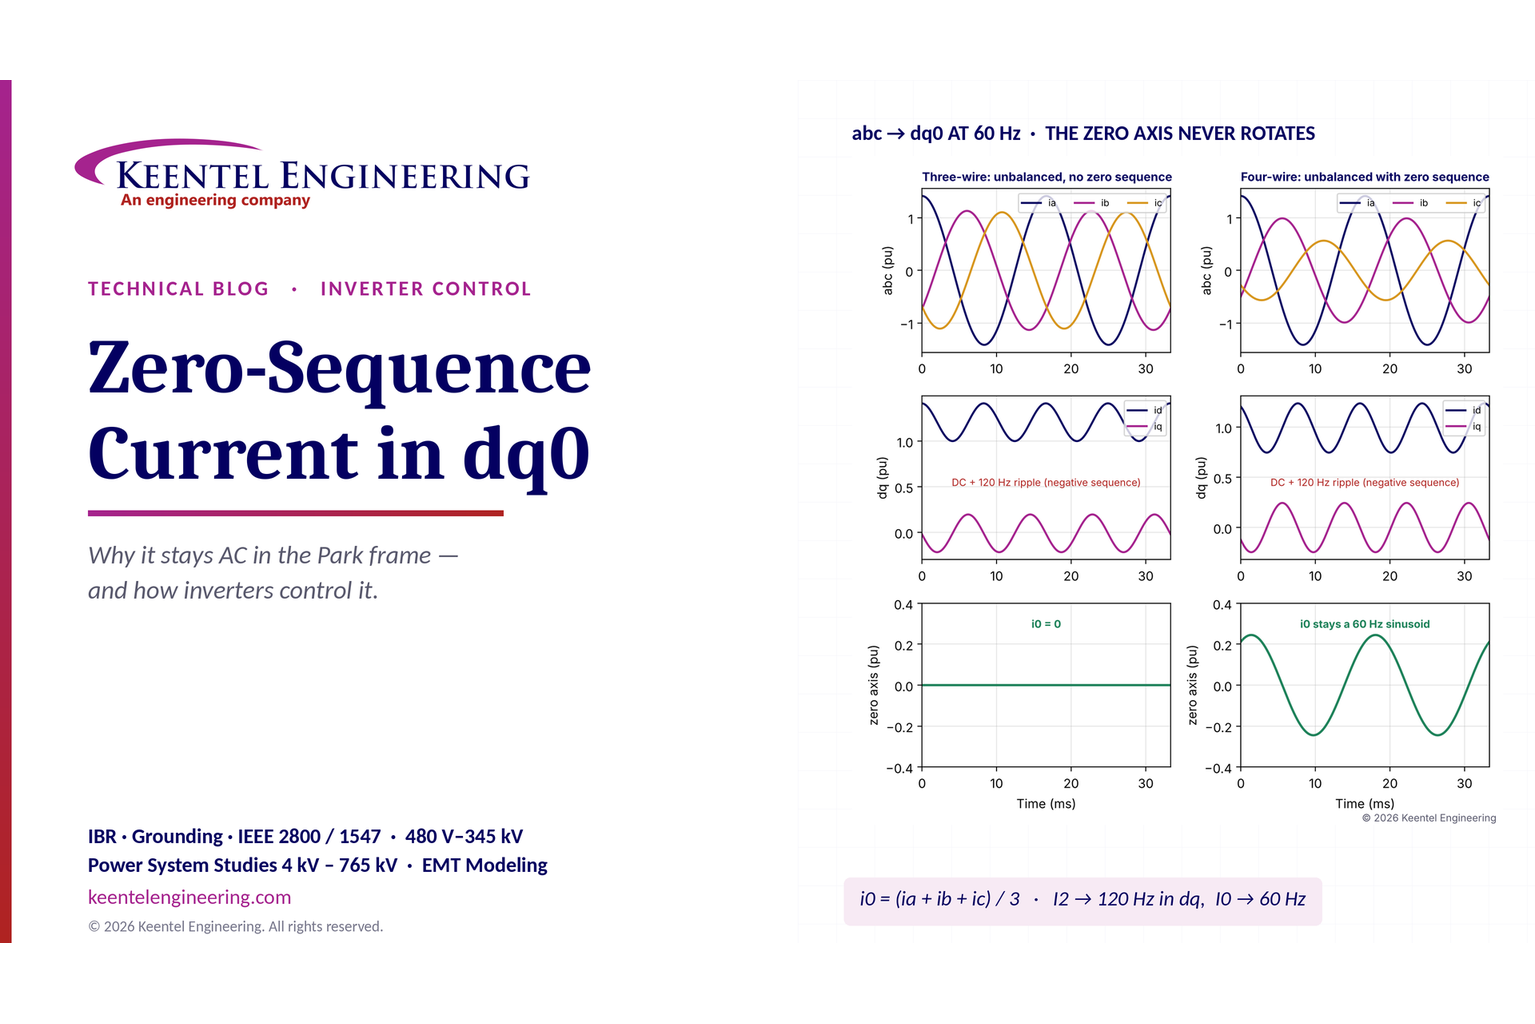
Learn why zero-sequence current pulsates in the dq0 frame, how Park's transformation works, and how inverter controls handle unbalance and ground faults.
By SANDIP R PATEL
•
October 11, 2026
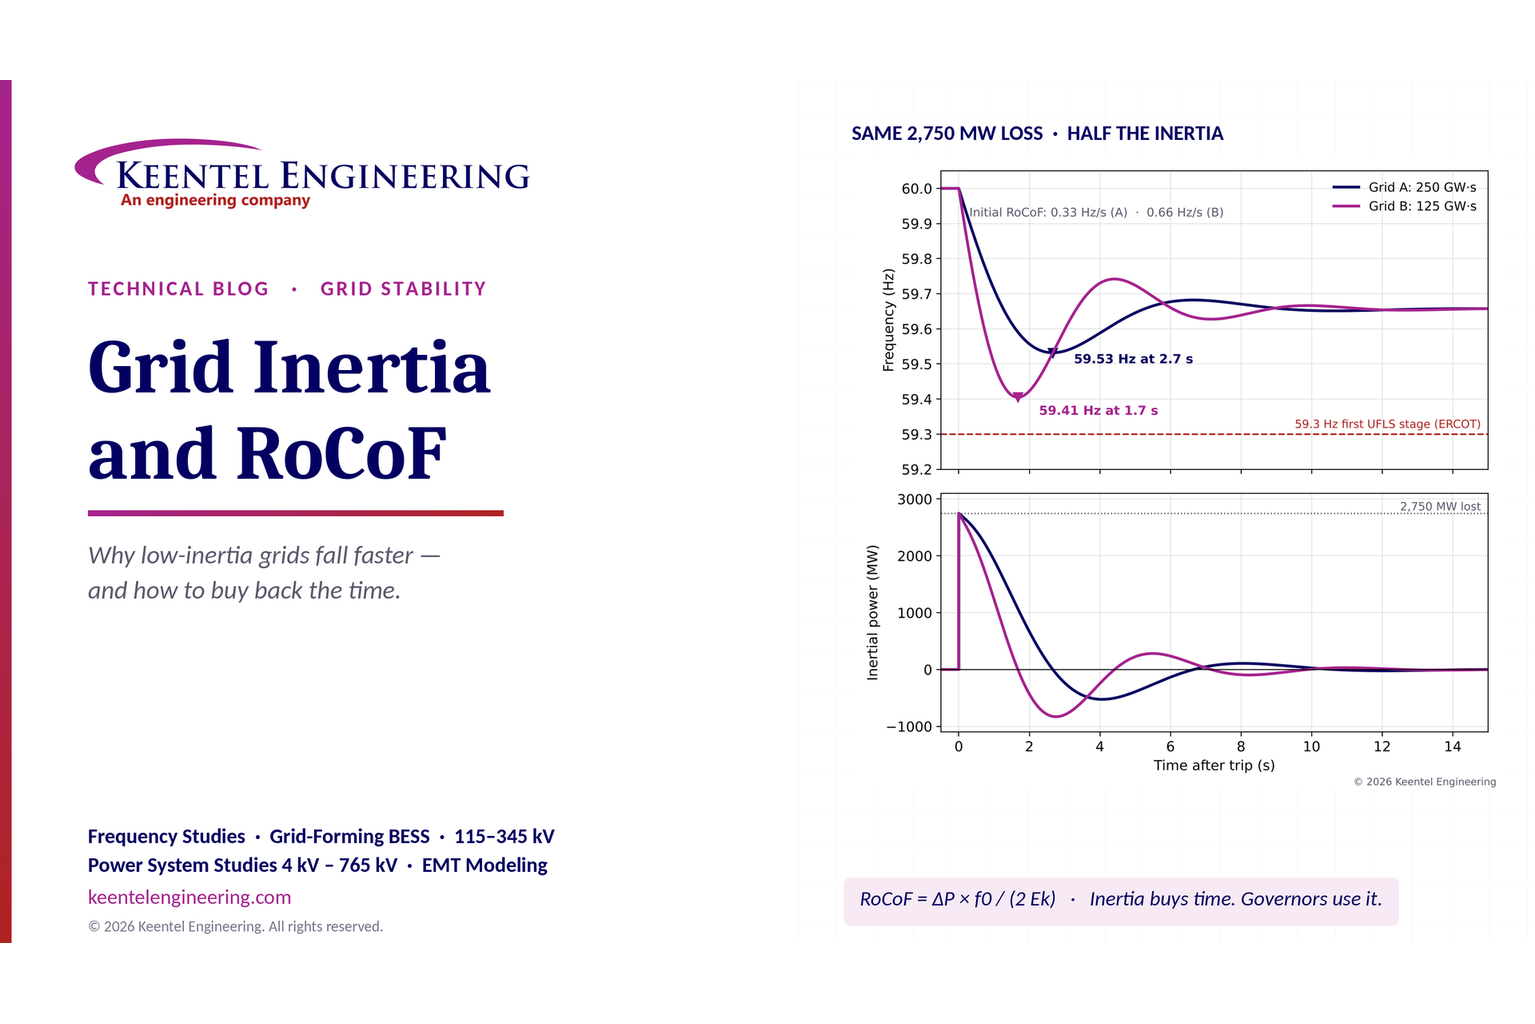
Explore grid inertia, RoCoF and frequency response, with swing equation calculations, frequency nadir analysis and US power system simulation examples.
By SANDIP R PATEL
•
October 11, 2026
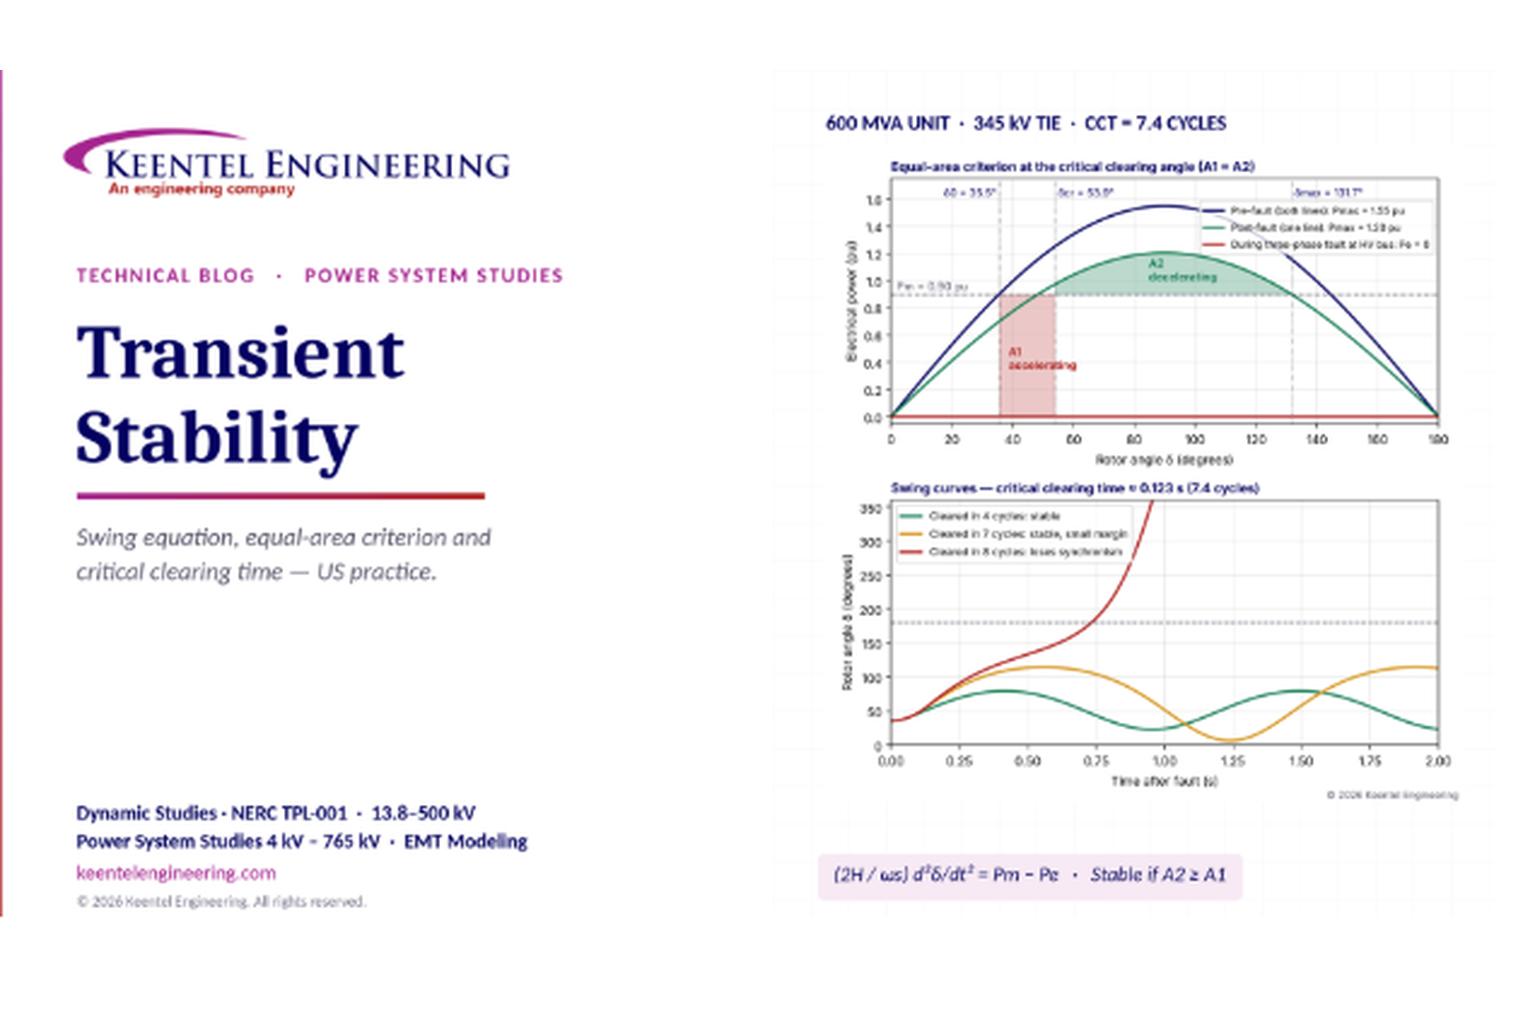
Learn transient stability analysis, swing equation, equal-area criterion and critical clearing time with a 345 kV worked example and NERC TPL-001 guidance.
By SANDIP R PATEL
•
October 11, 2026
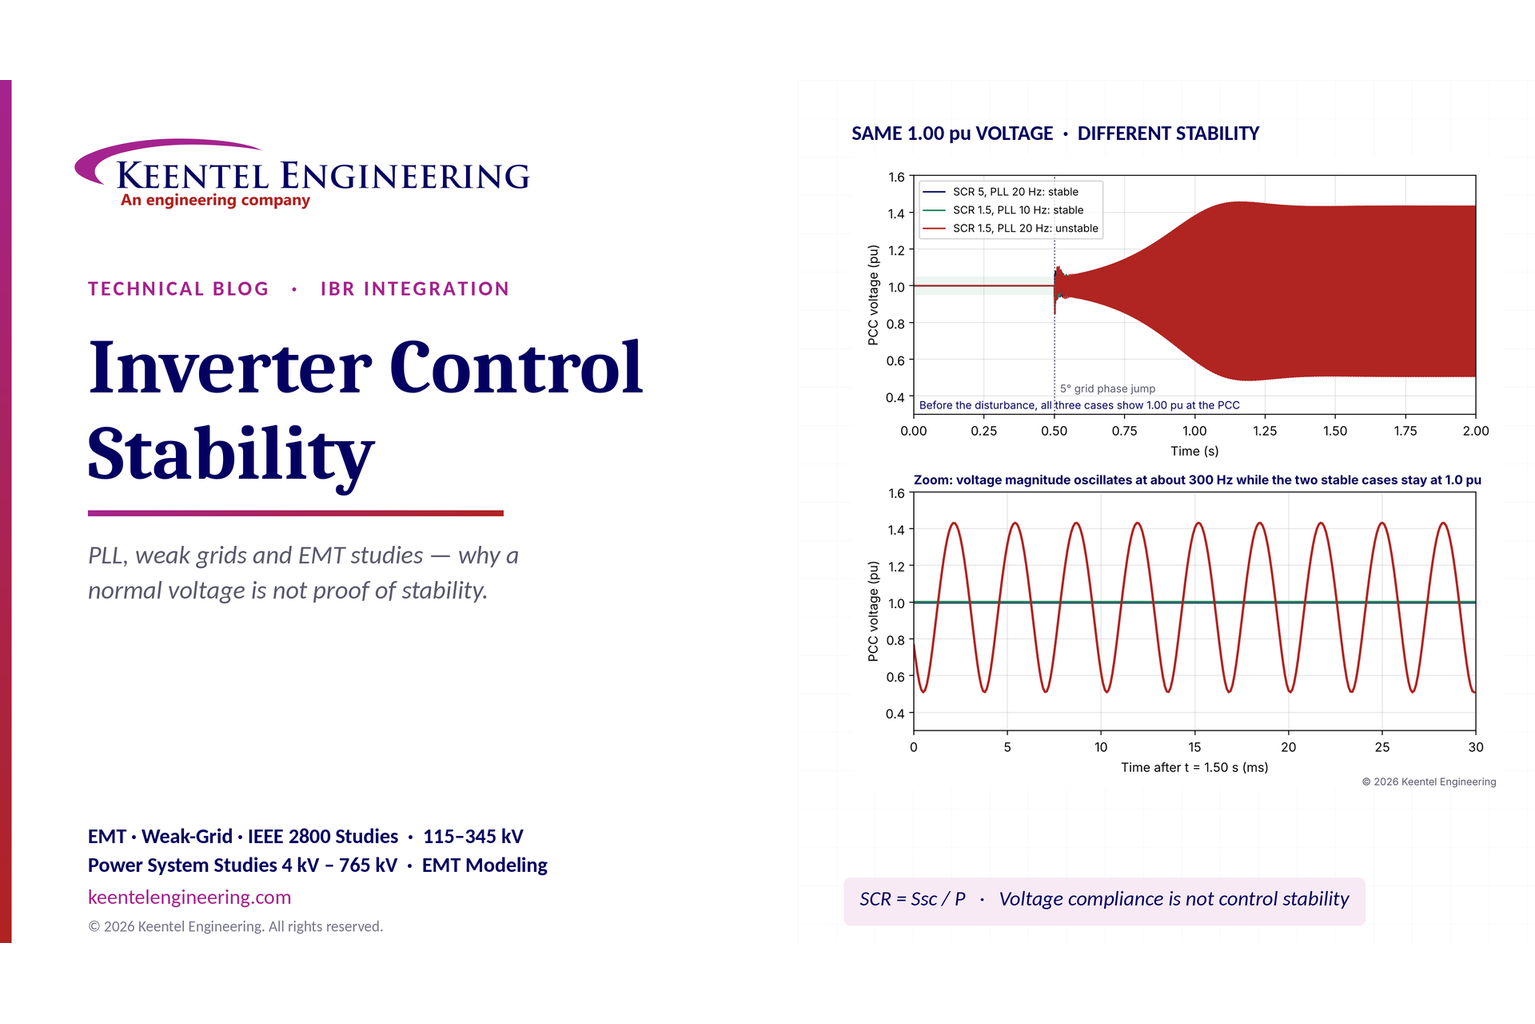
Learn why inverter controls become unstable in weak grids, how PLL bandwidth and SCR affect stability, and how PSCAD EMT studies identify and mitigate oscillations.
By SANDIP R PATEL
•
October 11, 2026
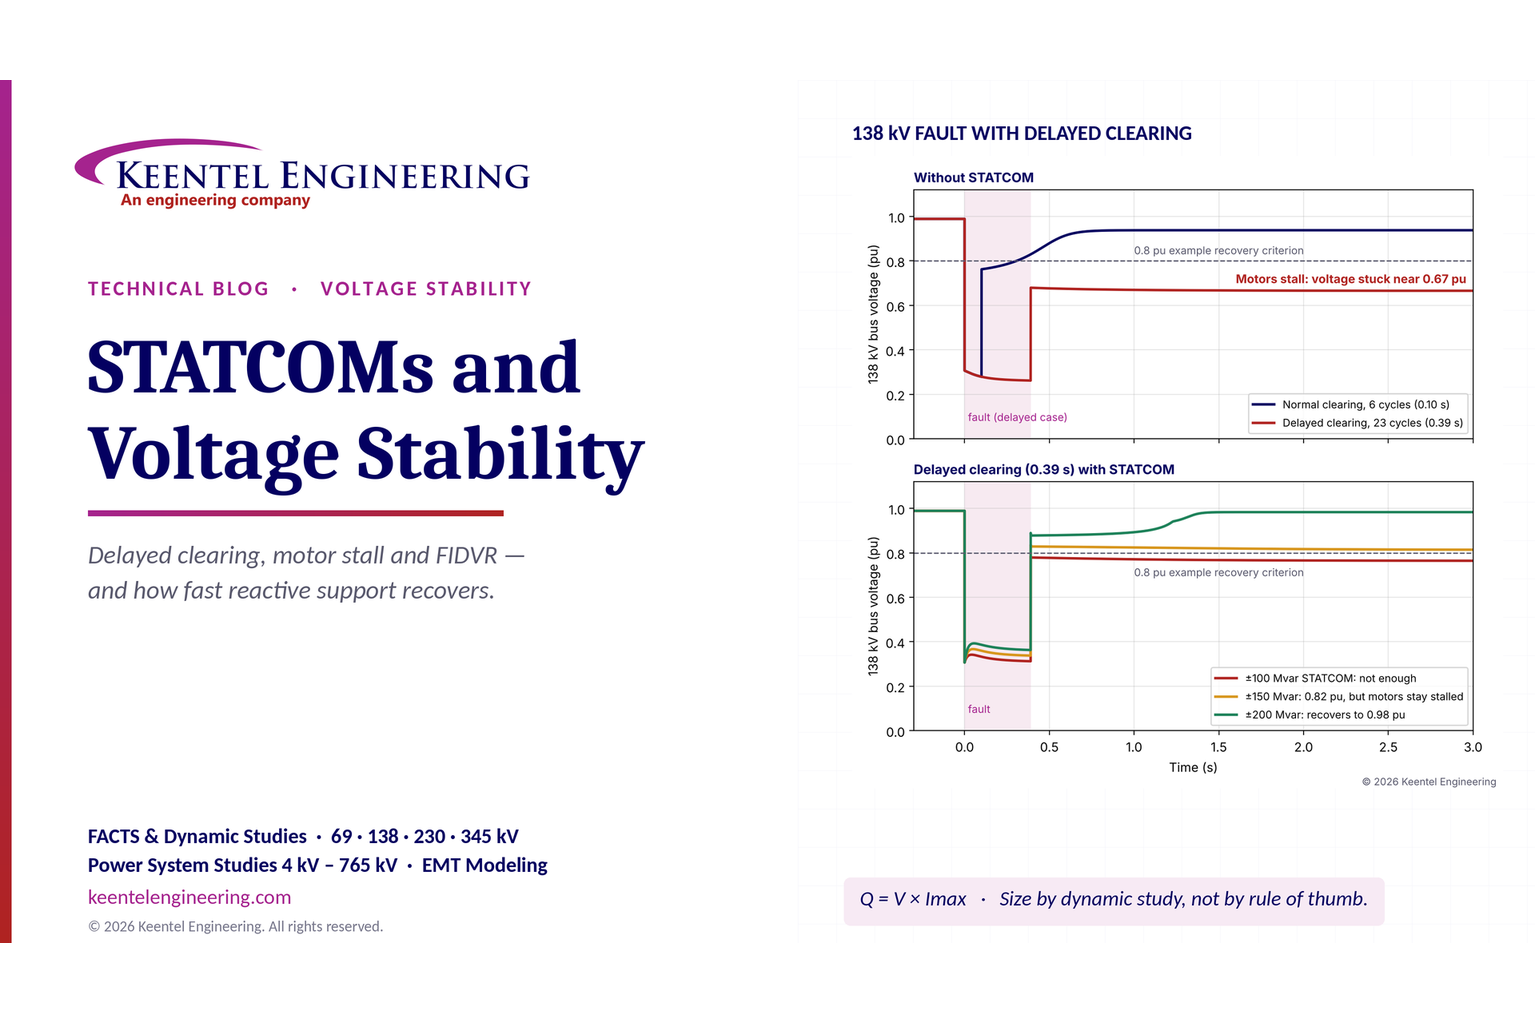
Learn how STATCOMs improve voltage stability and prevent FIDVR. Explore reactive power sizing, delayed fault clearing, NERC criteria and 138 kV simulation results.
By SANDIP R PATEL
•
October 10, 2026
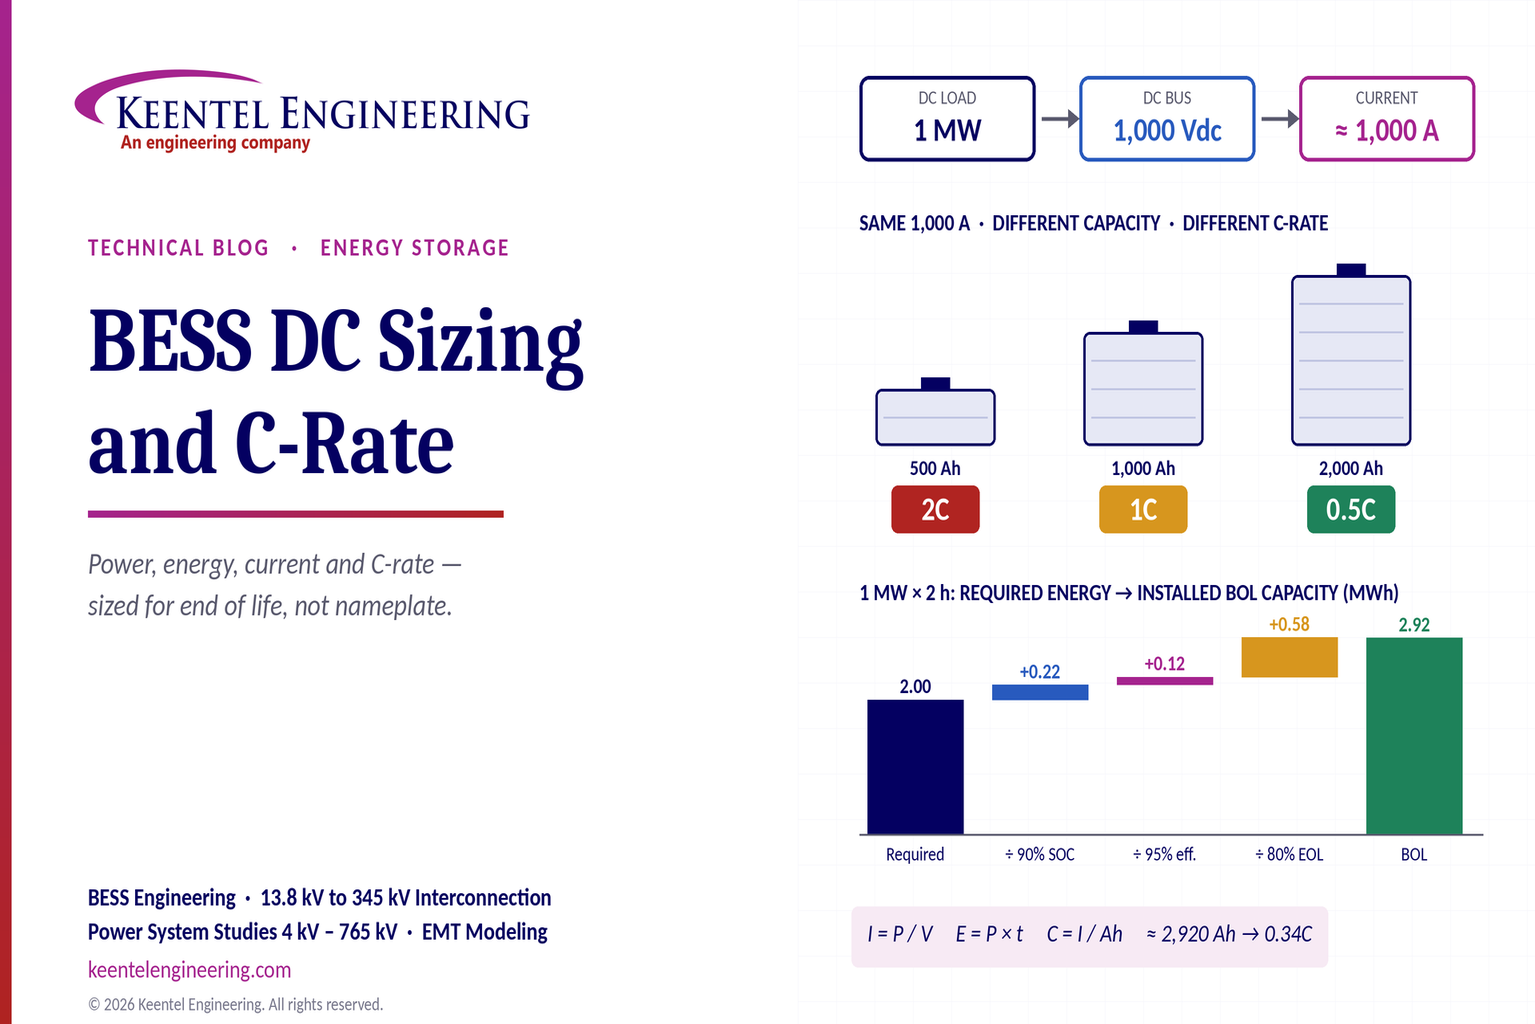
Learn BESS DC sizing with power, energy, current and C-rate calculations, battery losses, degradation and a 100 MW/400 MWh utility-scale example.
By SANDIP R PATEL
•
October 10, 2026
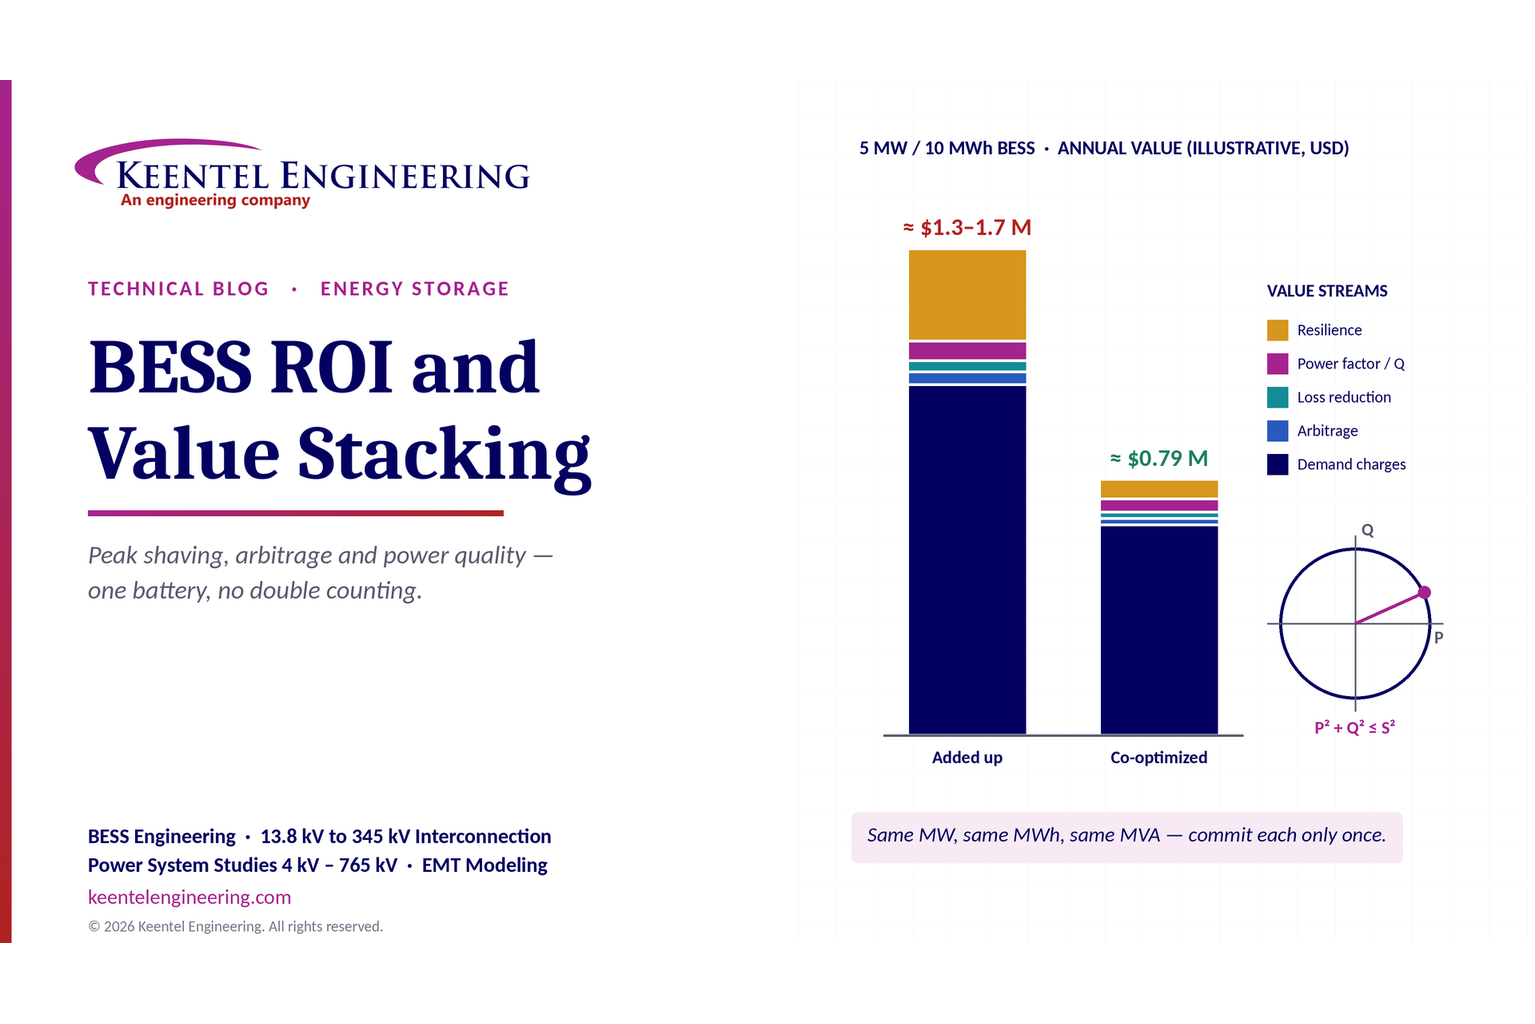
Learn how BESS ROI is calculated using peak shaving, energy arbitrage, power quality and battery storage economics, with a practical 5 MW/10 MWh example.





