1. Executive Summary
The Client, a regional distribution utility operating under a rural electrification mandate, required a new grid supply point for a sparsely populated agricultural region at the far end of a radial 110 kV network. Supply had previously been drawn over very long 33 kV feeders from a distant source substation. Feeder-end voltage fell below 0.88 pu at peak, agricultural pumping load was routinely shed, and reliability indices were among the poorest on the host utility network. Distributed solar installations were beginning to cause reverse power flow and midday overvoltage on the same feeders that sagged at peak.
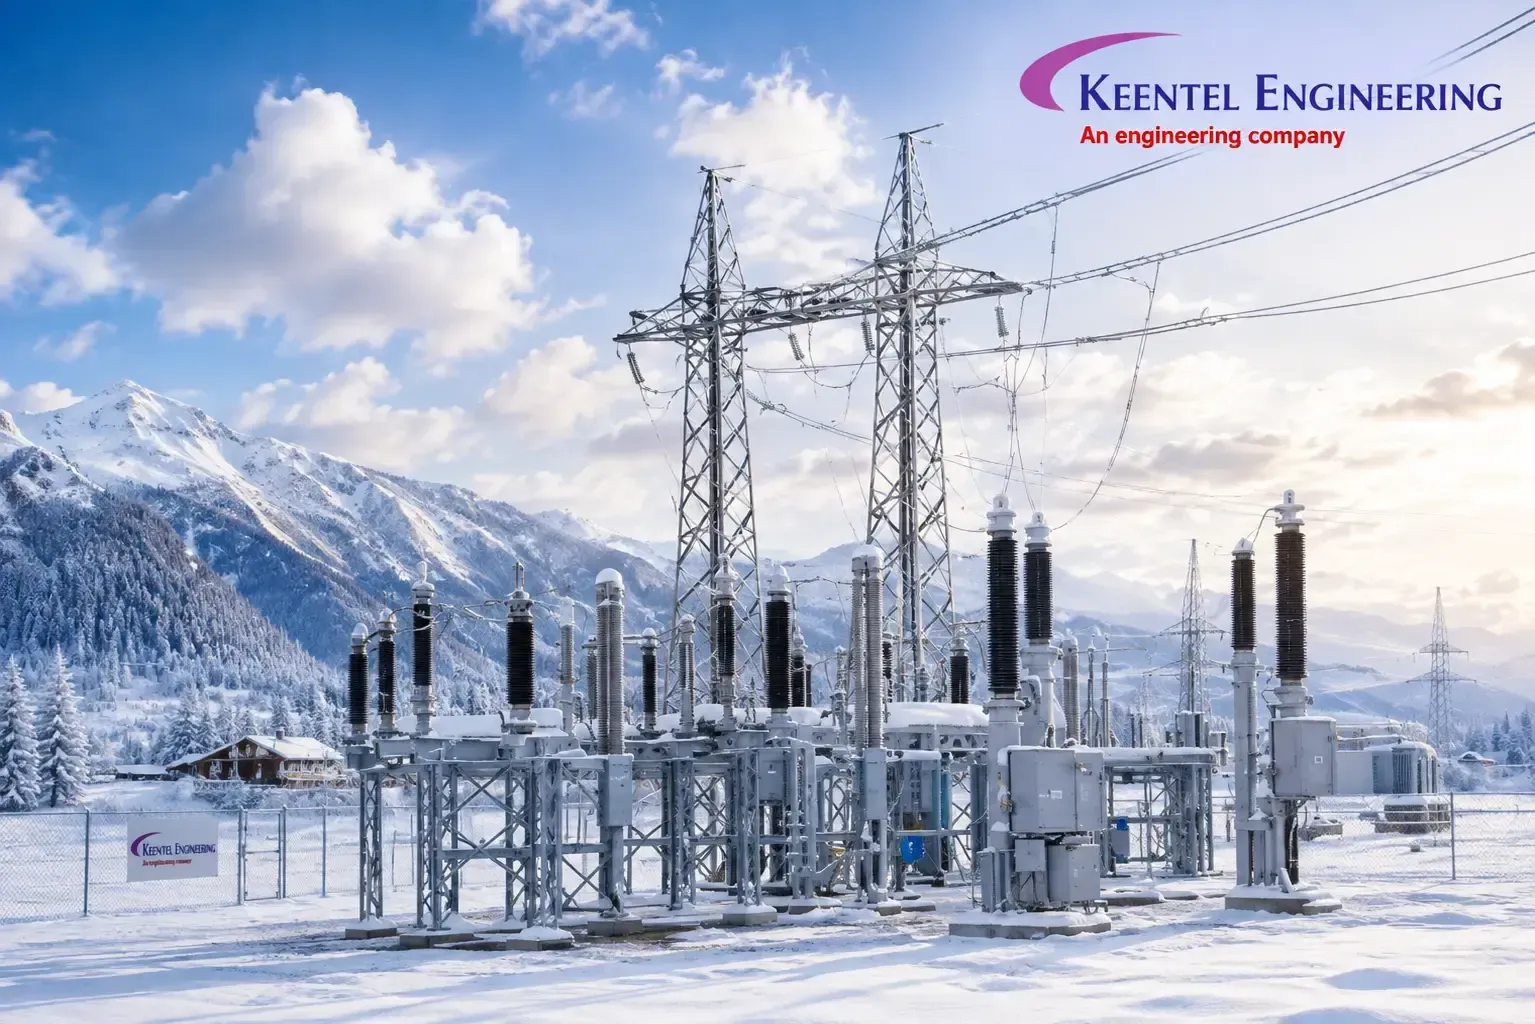
Keentel Engineering Solutions acted as owner's engineer and design authority for a greenfield outdoor air-insulated substation (AIS): a 110 kV single busbar with sectionalizer, two 25/31.5 MVA ONAN/ONAF 110/33 kV transformers with on-load tap changers, 33 kV double-busbar switchgear, and 11 kV distribution through 33/11 kV package units. Scope covered the design basis, all system studies, protection and automation philosophy, physical design interfaces, procurement specifications, and construction and energization support.
The challenge lay not in the substation but in the weakness of the network behind it. The 110 kV fault level is low and the source impedance line-dominated with a low X/R ratio. Energizing a 25 MVA transformer produced a voltage depression exceeding the utility step-voltage limit. Reactive compensation was needed to hold voltage at peak, but the same compensation created a parallel resonance close to the fifth harmonic once distributed photovoltaic generation was modelled. The design had to reconcile voltage support, harmonic performance, switching transients and distributed generation hosting in one solution.
Figures presented are representative of the delivered design and have been generalized to protect client confidentiality.
The delivered design lifted feeder-end voltage from approximately 0.87 pu to 0.985 pu at peak, established 31.5 MVA of firm N-1 capacity where none existed, raised distributed generation hosting capacity from about 4.5 MW to 14.5 MW, and reduced modelled technical losses by roughly 18 percent. It was delivered at an estimated 38 percent of the capital cost of the alternative the Client had considered, a second 110 kV line build into the region.
Project at a Glance
| Attribute | Detail |
|---|---|
| Asset type | Greenfield outdoor AIS grid supply point |
| Voltage levels | 110 kV / 33 kV / 11 kV |
| Transformation | 2 x 25/31.5 MVA ONAN/ONAF, 110/33 kV, OLTC |
| Bus schemes | 110 kV single bus with sectionalizer; 33 kV double bus |
| Reactive support | 4 x 2.4 MVAr detuned shunt capacitor banks at 33 kV |
| Keentel scope | Design basis, system studies, protection philosophy, specifications, commissioning support |
| Headline outcome | Feeder-end voltage 0.87 to 0.985 pu; DG hosting 4.5 to 14.5 MW |
2. Project Context and Business Drivers
The region is agricultural and sparsely populated, with load centres separated by tens of kilometres and fed by 33 kV feeders sized for a load profile established decades earlier. Growth had since been driven by three things the network was never designed for: an electrification programme connecting previously unserved households, mechanized irrigation with large populations of induction-motor pumping load, and emerging distributed solar.
The symptoms were characteristic of a network past its voltage-regulation limit. At peak, feeder-end voltage fell to about 0.87 pu, pump starting produced deep repeated dips, and customer under-voltage relays tripped frequently. SAIDI was of the order of 2,180 minutes per customer per year and SAIFI about 42 interruptions. Photovoltaic installations were meanwhile connecting at the feeder ends, where the network was weakest, so feeders that sagged to 0.87 pu at peak rose above 1.06 pu at midday, and the utility had begun refusing connection applications for want of a defensible basis for accepting them.
Two options were evaluated: a second 110 kV line while retaining the long feeders, or a new grid supply point close to the load. The first addressed only source strength; the second addressed voltage regulation, losses, reliability and hosting capacity together, and was selected. Three constraints then shaped the design. Unsealed-road access imposed axle-load and vehicle-length limits that ruled out the largest mobile cranes. Long lead times meant 110 kV specifications had to be frozen before the studies closed. And the local labour pool had limited high-voltage experience, making constructability and skills transfer an engineering deliverable.
3. Design Basis and Technical Requirements
The design basis was issued in the first six weeks as a controlled document referenced by every subsequent study and drawing.
Site and Environmental Design Criteria
| Parameter | Design value |
|---|---|
| Maximum ambient air temperature | 45 °C (40 °C maximum daily average) |
| Minimum ambient air temperature | -5 °C |
| Altitude | 620 m above sea level |
| Design wind speed (3 s gust) | 44 m/s |
| Seismic design acceleration | 0.16 g horizontal |
| Pollution severity | Medium per IEC 60815, uplifted for agricultural dust and fertilizer |
| Soil resistivity | 180 Ω·m upper layer to 2.5 m depth; 420 Ω·m lower layer |
| Isokeraunic level | 42 thunderstorm days per year |
The 620 m altitude falls below the 1,000 m threshold at which IEC 62271-1 requires dielectric correction, so standard withstand values apply without derating. The pollution assessment mattered more, since the site sees windblown soil and airborne fertilizer during two planting seasons, both hygroscopic. IEC 60815 medium pollution corresponds to 20 mm/kV specific creepage referred to the highest system voltage; Keentel specified 25 mm/kV, giving 3,075 mm at 110 kV and 900 mm at 33 kV, because live washing at a remote site is expensive and disruptive.
Standards Register
| Standard | Application |
|---|---|
| IEC 60071-1 / -2 | Insulation coordination, procedure and application guide |
| IEC 60909-0 | Short-circuit current calculation in three-phase AC systems |
| ANSI/IEEE C37.010 | AC high-voltage circuit breaker application, comparison basis |
| IEEE Std 80 | Safety in AC substation grounding |
| IEEE Std 998 | Direct lightning stroke shielding of substations |
| IEEE Std 1584 | Arc-flash hazard calculation |
| IEEE Std 485 | Sizing lead-acid batteries for stationary applications |
| IEC 61936-1 | Power installations exceeding 1 kV AC, clearances and safety |
| IEC 60076 series | Power transformers, rating, losses, temperature rise, tap changers |
| IEEE Std 519 | Harmonic control in electric power systems |
| IEEE Std C37.012 | Application of capacitance current switching for circuit breakers |
| IEEE Std C57.13 | Instrument transformers |
The Owner's functional requirements set the framework: firm N-1 capacity at the 33 kV bus with one transformer out, provision for a third transformer bay without a station outage, full remote operability, eight-hour DC autonomy, and a documented basis for granting distributed generation connections to a defined limit.
4. Substation Configuration and Single-Line Architecture
4.1 110 kV bus scheme selection
The 110 kV switchyard is a single busbar with a motorized sectionalizer, arranged as two sections each carrying one line bay and one transformer bay, plus a spare bay for the third transformer.
| Criterion | Single bus with sectionalizer | Main and transfer | Double busbar |
|---|---|---|---|
| Relative capital cost | Baseline | +18 to 22 percent | +45 to 55 percent |
| Land area required | Baseline | +15 percent | +40 percent |
| Bus fault consequence | Loses one section only | Loses whole bus | Loses one bus only |
| Breaker maintenance without load loss | No | Yes, via transfer bus | Only if bay transferred |
| Operating complexity | Low | Moderate | High, discipline-dependent |
Consequence and complexity decided it. With a sectionalizer, a bus fault removes one transformer and one line, leaving the surviving section to carry the whole station load within the second transformer's ONAF rating, satisfying N-1 without a second bus. Main-and-transfer buys breaker maintenance flexibility, but at a remote unattended site the transfer-bay switching sequence and its protection changeover carry a risk of operator error that outweighs the gain.
4.2 Transformation and 33 kV architecture
Two 25/31.5 MVA ONAN/ONAF transformers were selected, connected YNyn0 with a buried delta stabilizing winding. Star-star preserves the phase relationship of the existing 33 kV network and permits restricted earth fault protection on both windings, while the stabilizing winding provides a stable zero-sequence path. The 33 kV neutral is earthed through a resistor limiting earth fault current to 1,000 A, matching the Client's fleet standard for rural networks.
Initial coincident peak demand is 22 MW at 0.88 power factor lagging, against a ten-year forecast of 34 MW. Firm capacity with one transformer out is 31.5 MVA, or 29.9 MW at the compensated power factor of 0.95, so the forecast exhausts firm capacity at about year eight. That is the basis for the third transformer bay, and the provision is real: the 110 kV bus is terminated at the spare bay, the 33 kV switchboard has a fully equipped spare incomer cubicle, the DC system was sized for three units, and the earth grid and trenching extend into the future footprint.
The 33 kV switchgear is a double busbar with bus coupler, housed indoors against dust and fertilizer aerosol, with two transformer incomers, a coupler, four capacitor bank feeders, eight distribution feeders and two feeders to on-site package units. Double busbar was justified here where it was not at 110 kV, because moving feeders between sections without interruption lets the Client balance load and manage distributed generation groupings.
5. System Studies and Analysis
5.1 Modelling basis
All studies used one frozen set of source data. The positive-sequence model was built in PSS®E and mirrored in ETAP for distribution-level load flow, short circuit, arc flash and coordination. Transient work was performed in PSCAD/EMTDC, and coordination was verified independently in DIgSILENT PowerFactory.
The Thévenin equivalent at the 110 kV point of supply, including the incoming radial line, is Z1 = 1.95 + j9.15 Ω and Z0 = 3.60 + j13.10 Ω. An X/R of about 4.7 is low for a 110 kV bus and is the signature of a line-dominated source. High impedance with low X/R means poor voltage regulation, deep depressions on transformer energization, and a low short-circuit ratio for distributed generation.
5.2 Load flow and voltage profile
Load flow covered summer peak, winter peak, and minimum load with maximum solar, against criteria of 0.95 to 1.05 pu at all 33 kV and 11 kV busbars, no equipment above 90 percent of continuous rating, and no switching step above 3 percent.
| Condition | Pre-project | Post-project | Criterion |
|---|---|---|---|
| 33 kV bus voltage at system peak | 0.912 pu | 1.008 pu | 0.95 to 1.05 pu |
| Worst feeder-end voltage at peak | 0.870 pu | 0.985 pu | 0.95 pu minimum |
| Worst feeder-end voltage, min load max PV | 1.062 pu | 1.031 pu | 1.05 pu maximum |
| Modelled network technical losses | Baseline | 18.2 percent reduction | Informative |
| Heaviest 33 kV feeder loading at peak | 104 percent | 61 percent | 90 percent maximum |
Three mechanisms produce the improvement. Shortening the electrical distance removes most of the series voltage drop. The OLTC regulates the 33 kV bus over plus or minus 15 percent in 21 steps, wider than a typical urban application because the source voltage itself moves with loading. Switched capacitors supply reactive power locally. Ferranti rise on the lightly loaded incoming line adds only about 0.5 percent alone, but is additive with unswitched banks and midday reverse flow.
Line drop compensation needed care, since conventional LDC raises regulated voltage with load current and midday reverse flow therefore drives the tap the wrong way. Keentel specified a bidirectional, co-generation-compensated characteristic in which the LDC contribution reverses in sign rather than being blocked, with reverse-power detection delayed 30 seconds against cloud edges.
5.3 N-1 contingency analysis
Contingency analysis tested loss of each transformer, bus section and capacitor bank, at current and year-eight load, with and without distributed generation.
| Contingency | Loaded element | Result | Outcome |
|---|---|---|---|
| Loss of one 110/33 kV transformer | Remaining unit | 30.1 MVA on 31.5 MVA ONAF | Pass, no load shed |
| Loss of one 110 kV bus section | Remaining section | 30.1 MVA transfer | Pass, after isolation |
| Loss of both banks on one bus | 33 kV bus voltage | 0.961 pu | Pass, OLTC absorbs |
| Loss of 110 kV supply | Whole station | Total loss of supply | Accepted residual risk |
| Transformer loss with DG at zero | Remaining unit | Top-oil rise within limits | Pass |
The single-supply contingency was accepted by the Client, since a second 110 kV source was the alternative the project was chosen over.
5.4 Short-circuit study
Calculations were performed to IEC 60909-0 for equipment rating and repeated to ANSI/IEEE C37.010, because the Client's fleet specifications referenced ANSI duties while procurement ran against IEC-rated plant.
| Location | Three-phase (kA rms sym) | Line-to-ground (kA) | Selected rating |
|---|---|---|---|
| 110 kV busbar | 6.79 | 5.90 | 31.5 kA, 3 s |
| 33 kV bus, two transformers, coupler closed | 5.35 | 1.00 limited by NER | 25 kA, 3 s |
| 33 kV bus, one transformer | 3.03 | 1.00 limited by NER | 25 kA, 3 s |
| 11 kV package unit busbar | 2.87 | 2.10 | 20 kA, 3 s |
IEC 60909 gave a 110 kV peak of 16.8 kA against the ANSI first-cycle value of 11.5 kA rms asymmetrical, agreeing within 6 percent once normalized. The 31.5 kA rating carries large margin under either, retained because fault level will rise if the second line is ever built. The low fault level is itself a constraint: 6.79 kA is roughly 1,290 MVA, and at the far end of the longest 33 kV feeder it falls to about 45 MVA, where hosting capacity, protection sensitivity and flicker performance all become difficult at once.
5.5 Transformer energization and sympathetic inrush
Energization was modelled in PSCAD/EMTDC with a saturable transformer representation fitted to the specified no-load loss and excitation current, and residual flux swept across its full range. Uncontrolled energization at the worst point on wave gave a first-peak inrush of approximately 1,050 A at the 110 kV terminals against a rated peak of 185 A, and a bus voltage depression of 9.5 percent decaying with a time constant of about 0.6 s, exceeding the Client's 5 percent step-voltage limit.
Sympathetic inrush was the subtler finding. Energizing the second transformer with the first in service produced a prolonged asymmetric current in the in-service unit, sustained by DC offset circulating through the shared source impedance and lasting more than three seconds. Its differential protection therefore sees current it did not cause, so second-harmonic restraint with cross-blocking between phases was specified. Controlled point-on-wave closing with residual flux measurement on both 110 kV transformer breakers cut modelled first-peak inrush to about 230 A and the depression to 2.8 percent.
5.6 Capacitor bank switching transients and restrike
Four 2.4 MVAr banks were installed, two per 33 kV bus section, each with a 6 percent series detuning reactor tuning the bank to about the 4.1st harmonic, keeping it inductive at every characteristic harmonic order.
First-bank energization produced a bus overvoltage of 1.42 pu, within the 170 kV withstand level. Back-to-back energization is more severe: without detuning reactors the modelled inrush reached 11.6 kA at 3.9 kHz, close to the 20 kA and 4.25 kHz limits of IEEE C37.012, whereas with the reactors it fell to 1.8 kA at 1.2 kHz. Restrike matters because vacuum interrupters can restrike after current zero; class C2 breakers were specified and verified at FAT, arresters added at the bank terminals, and the worst-case modelled restrike overvoltage of 2.6 pu was within arrester rating.
5.7 Harmonic resonance scan with distributed photovoltaic generation
A frequency scan was run at the 33 kV bus for every combination of bank switching state, transformer configuration and load level. Parallel resonance order is approximately the square root of short-circuit MVA divided by bank MVAr, so 9.6 MVAr against 305 MVA puts resonance near the 5.6th order, between the fifth and seventh harmonics that inverters produce most strongly.
| Case | Parallel resonance order | Worst bus THD | IEEE 519 limit |
|---|---|---|---|
| No banks in service | Not applicable | 1.6 percent | 5 percent |
| Two banks, no detuning reactor | 7.9 | 6.8 percent | 5 percent |
| Four banks, no detuning reactor | 5.6 | 9.1 percent | 5 percent |
| Four banks, 6 percent detuning reactors | 3.9 | 2.4 percent | 5 percent |
| Four banks, detuned, one transformer out | 3.4 | 3.1 percent | 5 percent |
The reactors move resonance below the fifth harmonic, where injected harmonic current is small, and residual amplification near the fourth order is not significantly excited because the delta stabilizing winding gives triplen harmonics a circulating path. Voltage THD stays within the IEEE 519 planning level of 5 percent in every switching combination.
5.8 Insulation coordination and surge studies
Insulation coordination followed IEC 60071-1 and -2, statistical for lightning and deterministic for switching and temporary overvoltage, using a frequency-dependent line model, distributed tower footing resistance, and a 1.2/50 µs stroke applied at the first three towers plus a shielding-failure stroke direct to the phase conductor.
At 110 kV, arresters have a rated voltage of 96 kV and continuous operating voltage of 77 kV, suited to an effectively earthed system where temporary overvoltage on healthy phases reaches about 1.4 times nominal phase-to-earth voltage; residual voltage at 10 kA is 249 kV, a protective margin of 121 percent against the 550 kV withstand level. At 33 kV the neutral earthing resistor makes the system non-effectively earthed, so arresters are rated 39 kV with 31.5 kV continuous operating voltage, the 101 kV residual giving a 68 percent margin against 170 kV. Shielding follows IEEE Std 998 by the rolling sphere method with a 32 m radius, using two 18 m masts and two shield wires for a failure rate below 0.05 strokes per year; back-flashover required tower footing resistance on the first three towers to be reduced below 12 Ω.
5.9 Arc-flash assessment
Incident energy was calculated to IEEE Std 1584-2018 for the 11 kV switchgear and 400 V boards, and by the Lee method for the 33 kV switchgear, which lies above the 15 kV upper bound of the IEEE 1584 empirical model. At the 11 kV switchboard, with 2.87 kA available and 0.35 s clearing from the upstream 33 kV relay, incident energy at 455 mm working distance was 9.6 cal/cm²; a maintenance mode switching that relay to an instantaneous element cut clearing to 0.09 s and incident energy to 4.1 cal/cm². At 33 kV the arc-resistant board construction, type-tested to IAC AFLR 25 kA 1 s, is the primary measure.
5.10 Grounding grid design
The grounding study followed IEEE Std 80 using a two-layer soil model from Wenner four-pin measurements at spacings from 1 m to 32 m, giving an upper layer of 180 Ω·m to 2.5 m over a lower layer of 420 Ω·m. The positive reflection coefficient between layers pushes current back toward the surface, raising grid resistance and surface potentials, so a uniform model would have been optimistic and unsafe.
The design fault current is the 110 kV line-to-ground value of 5.90 kA; a split factor of 0.45 gives 2.66 kA into the grid, uplifted to 2.75 kA after the decrement factor. Shock duration was taken as 0.5 s, covering Zone 1 clearance plus breaker-fail operation.
| Parameter | Calculated | Criterion | Status |
|---|---|---|---|
| Grid resistance | 0.71 Ω | 1.0 Ω target | Pass |
| Ground potential rise | 1,953 V | Informative | Noted |
| Mesh (touch) voltage | 512 V | 687 V permissible | Pass |
| Step voltage | 389 V | 2,254 V permissible | Pass |
| Grid conductor | 120 mm² copper | 46 mm² minimum | Pass |
Permissible values assume a 50 kg body criterion, 0.5 s shock duration and a 100 mm crushed-rock surface layer of 3,000 Ω·m, giving a derating factor of 0.708. The grid is a 6 m by 6 m mesh with 32 driven rods of 3 m concentrated at the perimeter and at operating positions. Because the 1,953 V ground potential rise exceeds the 430 V threshold above which telecommunication circuits need special protection, all copper communication circuits leaving the site were replaced with fibre.
5.11 Protection coordination study
Coordination was established in ETAP from 110 kV line protection through the transformer, 33 kV feeder relays, reclosers and fuses, and checked in DIgSILENT PowerFactory, with grading margins of 300 ms between numerical relays and 400 ms where a fuse appeared. Fuse saving requires the recloser fast curve to operate before the lateral fuse damage curve, but at the far end of a 60 km feeder the fault current approaches load current and the fast curve loses selectivity, so it was graded over the first two thirds of the feeder only. Distributed generation also contributes fault current from the load side, causing sympathetic tripping; directional earth fault elements on all 33 kV feeders resolve this, and inverter contribution was modelled at 1.2 times rated current with a controlled current angle.
6. Protection, Automation and Control Philosophy
The 110 kV line and transformer protection is duplicated as Main 1 and Main 2 on separate relays, separate DC supplies from different battery sections, and separate trip coils.
The automation architecture uses IEC 61850 as the station bus, with MMS reporting to the gateway and GOOSE for interlocking, fast bus trip and breaker-fail backtripping, on a redundant RSTP ring. Reporting to the control centre is DNP3 Level 3 over TCP/IP on a satellite link with cellular backup. All 33 kV feeder relays report fault passage indication, removing the patrol time previously needed to locate a fault on a long feeder.
| Zone | Main 1 functions | Main 2 / backup functions |
|---|---|---|
| 110 kV line | 21/21N distance, 85 POTT teleprotection | 67N directional earth fault, 50/51, 50N/51N |
| 110/33 kV transformer | 87T differential, 2nd harmonic restraint | 51/51N, 49 thermal, 64REF both windings |
| Transformer mechanical | 63 Buchholz, 26 winding temperature | 71 oil level, 63 pressure relief, OLTC surge |
| 110 kV busbar | Fast bus trip via feeder starter blocking | 51 on transformer LV as time-graded backup |
| 33 kV feeder | 50/51, 50N/51N, 67N, 79 auto-reclose | 51SEF sensitive earth fault, 27/59, 81U/81R |
| Capacitor bank | 50/51, 51N, 59 overvoltage | 60 neutral unbalance, 37 undercurrent |
| Breaker failure | 50BF on all 110 kV and 33 kV breakers | 200 ms backtrip to bus section |
Distance protection was chosen over line differential because the fibre route to the source substation follows the line on OPGW and is exposed to the same faults that take the line out. A permissive overreach transfer trip scheme gives high-speed clearance when the channel is available and degrades to stepped distance when it is not. Zone 1 is set to 80 percent of line impedance with instantaneous operation and about 60 ms total clearance, Zone 2 to 120 percent at 400 ms.
Full busbar differential at 110 kV was evaluated and not adopted. With two bus sections, four bays and a sectionalizer, a dedicated 87B scheme with its own current transformer cores cost more than it was worth against a fast bus-trip scheme in IEC 61850 GOOSE: each feeder relay detecting forward fault current blocks the incomer relay, and absent any blocking signal the incomer trips its section in about 90 ms.
Under-frequency and under-voltage load shedding runs at the 33 kV feeder relays in four stages coordinated with the Client's system-wide scheme, so feeders serving critical facilities and the highest customer density are shed last and restored first.
7. Primary Plant, Insulation Coordination and Physical Design
7.1 Equipment ratings
| Equipment | Rating | Notes |
|---|---|---|
| 110 kV circuit breaker | 123 kV, 1250 A, 31.5 kA / 3 s | Independent pole operation, controlled switching |
| 110 kV disconnector | 123 kV, 1250 A, 31.5 kA / 3 s | Motorized, with earth switch and interlocking |
| 110 kV current transformer | 300/1 A, 5P20 and 0.2S cores | Separate cores for Main 1, Main 2, metering |
| Power transformer | 25/31.5 MVA, 110/33 kV, YNyn0d | 12.5 percent on 25 MVA base, OLTC plus/minus 15 percent |
| 33 kV switchgear | 36 kV, 2000 A bus, 25 kA / 3 s | Indoor, arc-resistant IAC AFLR 25 kA 1 s |
| 33 kV capacitor bank | 2.4 MVAr with 6 percent detuning reactor | Four banks, two per bus section |
| 33/11 kV package unit | 5 MVA, 7.5 percent impedance | Two units, factory assembled |
The 12.5 percent transformer impedance balances two competing requirements. Lower impedance improves voltage regulation on an already weak network but raises the 33 kV fault level and the through-fault duty downstream; higher impedance suppresses fault level but worsens the regulation the project existed to fix. At 12.5 percent the 33 kV fault level of 5.35 kA sits within a standard 25 kA switchgear rating while the OLTC holds bus voltage across the load cycle.
7.2 Insulation coordination summary
| Parameter | 110 kV system | 33 kV system | 11 kV system |
|---|---|---|---|
| Highest voltage for equipment | 123 kV | 36 kV | 12 kV |
| Lightning impulse withstand | 550 kV | 170 kV | 95 kV |
| Power frequency withstand, 1 min | 230 kV | 70 kV | 28 kV |
| Specific creepage applied | 25 mm/kV, 3,075 mm | 25 mm/kV, 900 mm | 25 mm/kV, 300 mm |
| Surge arrester rating | 96 kV, Uc 77 kV | 39 kV, Uc 31.5 kV | 12 kV, Uc 9.6 kV |
Minimum clearances follow IEC 61936-1: 1,100 mm phase-to-earth and 1,300 mm phase-to-phase at 110 kV, with minimum height to live parts of 3,700 mm where personnel have access.
7.3 Layout and constructability in a remote location
Layout was driven as much by construction logistics as by electrical requirements, because road access limits excluded the mobile cranes normally used to erect 110 kV gantries and place a 25 MVA transformer. The gantries were therefore specified as bolted lattice sections assembled at ground level and raised in stages with a smaller crane, removing the largest crane from the critical path. Temporary construction power came from a diesel generator sized for the oil processing plant and welding load, with changeover to station service only after the 33 kV board was proven.
The transformers were specified for de-tanked delivery, with oil, radiators, conservator and bushings shipped separately and assembled, vacuum-treated and oil-filled on site. This cut the heaviest transport unit by about 35 percent, at a cost of roughly three weeks per unit plus a temporary enclosure and oil processing plant, both in the contractor scope from the outset. Plinths, the oil bund and the rail track were positioned so a unit can be moved from the delivery hardstand to any of the three transformer positions on rails without craneage, which makes the third bay a genuine provision.
Local labour skill development was written into the construction specification, requiring defined trade positions to be staffed with locally recruited personnel under supervision, with a structured competency programme covering earthing installation, cable termination and switchgear assembly.
8. Auxiliary Systems
AC station service comes from two 200 kVA 33/0.4 kV auxiliary transformers, one per 33 kV bus section, with automatic transfer and provision for a mobile generator connection. A permanent standby generator was not installed, because the station load is small, the DC system gives eight hours of autonomy, and a mobile generator can reach the site within that window. The DC system is 110 V nominal with two fully independent lead-acid banks, two chargers and two distribution boards, sized to IEEE Std 485 for an eight-hour duty with a one-minute high-rate ending period covering simultaneous breaker tripping.
Battery Sizing Summary
| Parameter | Value |
|---|---|
| System voltage and cells | 110 V nominal, 54 cells at 2.05 V/cell |
| End-of-discharge voltage | 94.5 V, 1.75 V per cell |
| Continuous load | 11.5 A over 8 h duty |
| One-minute ending load | 45 A, simultaneous trip and close |
| Selected capacity and charger | 250 Ah at 8 h rate; 40 A charger per bank |
Charger sizing follows continuous load plus the current needed to recharge within twelve hours, giving 34.4 A and a selected 40 A rating.
Fire detection uses aspirating smoke detection in the control building, switchroom and cable trenches, chosen over point detectors because of the dust. Transformer fire protection is by separation and fire walls rather than deluge, since a remote site with no permanent water supply cannot sustain one. Each transformer sits over a bund containing 110 percent of oil volume plus one hour of design rainfall, draining through an oil-water separator to a monitored sump. Security comprises a palisade fence with intruder detection, CCTV over the SCADA link, and access control integrated with the Client's permit-to-work system.
9. Construction, Commissioning and Energization Support
Construction ran from Month 0 to Month 22, with Keentel providing design authority, technical query resolution, FAT witnessing and commissioning oversight. On a greenfield site the outage complexity lay in the 110 kV line turn-in and the 33 kV feeder cutover. The turn-in was executed under one planned outage in which the existing through line was cut and terminated into the new gantry, sequenced so the total interruption was 14 hours against an 18-hour window.
Factory acceptance testing covered the transformers, switchgear and protection panels. The protection panel FAT was run as an end-to-end simulation using secondary injection driven by the PSCAD-derived fault waveforms, demonstrating differential stability under sympathetic inrush before the panels left the works; two settings errors and one current transformer polarity error were found there. Site testing then covered equipment tests, zone-by-zone primary injection proving the current path from primary conductor to relay, functional testing of every trip and interlock path, and SCADA verification.
Energization followed a defined sequence. The 110 kV bus was energized and held 24 hours under observation. The first transformer was then energized on no load using the controlled switching device, and the recorded first peak of 265 A against the modelled 230 A validated the PSCAD model within 15 percent. After a further 24 hours the 33 kV bus was energized and load transferred feeder by feeder over four days, with capacitor banks commissioned last once load history confirmed the reactive requirement. Of 41 punch-list items, 3 were Category A preventing energization and all were closed beforehand.
10. Results and Value Delivered
| Metric | Before | After | Change |
|---|---|---|---|
| Worst feeder-end voltage at peak | 0.870 pu | 0.985 pu | +11.5 points |
| Firm N-1 capacity at 33 kV | None | 31.5 MVA | New capability |
| Network technical losses | Baseline | 18.2 percent lower | Loss reduction |
| Distributed generation hosting capacity | 4.5 MW | 14.5 MW | +222 percent |
| SAIDI | 2,180 min/customer/yr | 640 min/customer/yr | -71 percent |
| SAIFI | 42 interruptions/yr | 13 interruptions/yr | -69 percent |
| Capital cost against line-build option | 100 percent baseline | 38 percent | 62 percent avoided |
The voltage improvement is what the Client notices most directly, but the hosting capacity result has the longest commercial life. The delivered studies give a documented hosting limit and a repeatable assessment method, converting a source of customer dispute into an administrable process.
The reliability gain splits roughly 40 percent to shorter feeders, 35 percent to fault passage indication and distribution automation, and 25 percent to auto-reclose converting transient faults into momentary interruptions.
11. Challenges and Engineering Lessons Learned
The weak source was the design driver, not the load. The instinct on a rural electrification project is to size for load growth. Here every difficult decision — controlled switching, detuned capacitors, OLTC range, the LDC characteristic, the hosting limit — traced back to the source impedance at the 110 kV bus.
Sympathetic inrush is under-appreciated on weak sources. Energizing the second transformer with one unit already in service produced a prolonged asymmetric current that would have caused a differential maloperation under per-phase second-harmonic restraint. Cross-blocked restraint should be the default for parallel transformers on a weak source.
Distributed generation broke assumptions that were never written down. Line drop compensation, fuse saving and directional overcurrent grading all embed an assumption of unidirectional power flow. The practice adopted since is to run every protection and voltage-control setting through an explicit reverse-flow test case.
Freezing procurement before the studies close is survivable if the design basis is conservative. Lead times forced the 110 kV specification out before the transient studies finished. The team specified deliberate margin, such as 31.5 kA breakers on a 6.8 kA bus and 25 mm/kV creepage against a 20 mm/kV requirement, and wrote controlled switching into the breaker specification as an option to be confirmed.
Two-layer soil modelling was not optional. A uniform interpretation of the shallow resistivity data would have predicted grid resistance about 40 percent lower and touch voltages with apparently comfortable margin. The two-layer model showed the real margin was much narrower and drove the crushed-rock surface layer and the perimeter rod concentration.
Constructability constraints belong in the design, not in tender clarifications. The road access limits were known from the first site visit, but the de-tanked delivery, rail transfer and sectional gantry erection method were only developed after early contractor engagement.
12. Keentel Capability Summary
- Options analysis and design basis development for network reinforcement alternatives
- Load flow, voltage profile and N-1 contingency analysis in PSS®E and ETAP
- Short-circuit analysis to IEC 60909 with comparative ANSI/IEEE C37.010 verification
- PSCAD/EMTDC transient studies covering transformer energization, sympathetic inrush, capacitor switching, restrike and lightning surge
- Harmonic penetration and frequency scan analysis with inverter-based resources
- Insulation coordination, surge arrester selection and lightning shielding to IEC 60071 and IEEE Std 998
- Substation grounding to IEEE Std 80 with multi-layer soil interpretation
- Arc-flash assessment to IEEE Std 1584 and by the Lee method above 15 kV
- Protection philosophy, setting calculation and coordination in ETAP and DIgSILENT PowerFactory
- IEC 61850 automation architecture and DNP3 control centre integration design
- Distributed generation hosting capacity assessment and interconnection screening methodology
- Auxiliary AC and DC system design and battery sizing to IEEE Std 485
- Procurement specification, technical bid evaluation, FAT witnessing and energization planning
13. Frequently Asked Questions
A double busbar lets any bay transfer between buses, which is valuable with many bays or frequent planned bus outages. Here there are four bays and one future bay. A sectionalized single bus already limits a bus fault to half the station, satisfying N-1 because the surviving transformer carries the whole load within its ONAF rating. Double busbar would have added 45 to 55 percent to switchyard cost and 40 percent to land, plus more interlocking and more operator decisions at a site with a small operations team. The layout preserves room to convert if the station grows.
Three indicators together give a reliable picture. First is the short-circuit ratio at the point of connection, available fault MVA divided by connected plant rating; below about 10 is clearly weak and below 20 deserves scrutiny. Second is the X/R ratio of the source impedance, where a value below about 6 indicates a line-dominated source and therefore poor voltage regulation. Third is the ratio of the largest switching operation to available fault level, which predicts the voltage step directly. Here the fault level was 1,290 MVA, X/R was 4.7, and a 25 MVA energization produced a 9.5 percent depression.
Transformer impedance is a two-sided choice. Lower impedance improves regulation but raises the downstream fault level proportionally, affecting the 33 kV switchgear rating, through-fault duty on every 33/11 kV unit, arc-flash incident energy at every board, and mechanical duty on a large population of pole-mounted equipment. At 12.5 percent the 33 kV bus sits at 5.35 kA, within standard 25 kA switchgear and within the ratings of existing plant. Dropping to 9 percent would raise fault level by a quarter for a regulation benefit the OLTC and capacitor banks already deliver more cheaply.
Validation happens at three levels. At component level each model is checked against manufacturer test data: transformer saturation fitted to measured no-load loss and excitation current, arrester characteristics to the published V-I curve, line parameters to conductor geometry and measured resistivity. At network level the equivalent source is tuned until its steady-state fault current and X/R match the validated short-circuit study. At behavioural level, results are checked against closed-form expectations, such as capacitor inrush frequency matching the calculated loop resonance. The model is then confirmed at commissioning: the recorded inrush first peak was 265 A against a modelled 230 A.
Hosting capacity is the maximum distributed generation connectable without violating a technical limit or requiring reinforcement. It is the lowest of several limits assessed together: steady-state overvoltage at light load, rapid voltage change on generation trip or cloud transient, thermal loading under reverse flow, protection desensitization, and fault level headroom. The method is to run the network at minimum load with maximum generation, raise generation in steps, and record which limit binds first. Before this project the binding constraint was feeder-end overvoltage, capping hosting near 4.5 MW; afterwards it became rapid voltage change, at 14.5 MW.
A plain shunt bank creates a parallel resonance with the source inductance at an order roughly equal to the square root of short-circuit MVA divided by bank MVAr. Here that placed resonance at 5.6 with all four banks in service, between the fifth and seventh harmonics that inverter-based generation produces most strongly. The frequency scan showed bus distortion reaching 9.1 percent against a 5 percent planning level. A 6 percent series reactor makes each bank inductive above the fourth order, moving resonance out of the region where significant harmonic current exists, and it also limits back-to-back energization inrush.
It depends almost entirely on source strength. On a strong network a 25 MVA energization causes a dip of one or two percent that nobody notices. On this network the same energization produced a 9.5 percent depression lasting several hundred milliseconds, exceeding the utility step-voltage limit and enough to risk dropping out motor contactors on irrigation load. Controlled switching with residual flux measurement reduced it to 2.8 percent for a small percentage of the transformer bay cost, and also reduced the sympathetic inrush interaction between the two units. Model the uncontrolled dip first and let the result decide.
For a substation of this size the analytical package typically runs 14 to 20 weeks from receipt of validated source data to issued final reports, with studies proceeding in parallel where dependencies allow. The critical path is almost never modelling effort; it is data. Source impedance from the transmission owner, measured soil resistivity, an agreed load forecast and downstream protection device parameters are the items that most often delay a package. Here the resistivity survey and the transmission owner's equivalent were commissioned in the first two weeks specifically to protect the programme.
The two methods answer the same question with different conventions, and equipment is type-tested to one or the other. IEC 60909 applies a voltage factor to nominal voltage, ignores pre-fault load flow, and derives peak current from an equivalent-frequency treatment of network X/R. ANSI/IEEE C37.010 applies multiplying factors to a symmetrical current to derive interrupting duty at defined contact parting times. Where fleet standards reference ANSI duties but procurement runs against IEC-rated plant, using one method alone risks a comparison that is not like-for-like. Here the two agreed within 6 percent once normalized.
Three things change. A low grid resistance becomes difficult and often uneconomic, so the objective shifts from a resistance target to touch and step voltage compliance, which is what IEEE Std 80 actually requires; a grid at 0.71 Ω with compliant touch voltages is safe, while one at 0.3 Ω with non-compliant touch voltages is not. Ground potential rise becomes large, triggering requirements to protect metallic circuits leaving the site, and the 1,953 V GPR here meant converting all site communications to fibre. A resistive lower layer also reflects current toward the surface, so measurements must probe that layer.
This is the fundamental limitation of overcurrent protection on long feeders and it cannot be solved by settings alone. Sensitive earth fault protection with low pickup and a long definite time detects high-impedance and downed-conductor faults that ordinary elements miss. Directional earth fault elements maintain discrimination when distributed generation contributes from the load side. Fuse saving is graded only over the portion of the feeder where the fast curve retains selectivity. Mid-line reclosers subdivide the feeder so each device covers a manageable fault current range. The intent is to accept a defined loss of sensitivity at the extreme end.
Yes, with a defined adaptation step. The analytical methods — load flow, contingency, short circuit, transient simulation, harmonic scanning, grounding, arc flash and coordination — are physics-based and jurisdiction-independent. What changes is the acceptance criteria: permissible voltage range, step voltage limits, harmonic planning levels, touch voltage body-weight assumptions, the fault duration used for shock calculations, and the interconnection requirements for distributed generation. Our practice is to build the standards register and acceptance criteria table as the first deliverable, agreed before any study runs. A different standards basis changes those numbers but not the structure of the work.
14. Glossary of Terms and Abbreviations
| Term | Definition |
|---|---|
| AIS | Air-insulated switchgear, using atmospheric air as the primary insulating medium |
| BIL | Basic lightning impulse insulation level, rated withstand for a 1.2/50 µs impulse |
| Creepage distance | Shortest path along an insulator surface between conductive parts |
| DER | Distributed energy resource, generation or storage connected at distribution voltage |
| DNP3 | Distributed Network Protocol version 3, a SCADA communication protocol |
| Ferranti effect | Voltage rise at the receiving end of a lightly loaded line due to charging current |
| GOOSE | Generic Object Oriented Substation Event, the IEC 61850 fast peer-to-peer message service |
| GPR | Ground potential rise, grid voltage relative to remote earth during a fault |
| Hosting capacity | Maximum distributed generation connectable without violating a defined technical limit |
| IAC | Internal arc classification, the type-test rating of arc-resistant switchgear |
| LDC | Line drop compensation, an AVR function raising regulated voltage with load current |
| Mesh voltage | Worst-case touch voltage within a grounding grid mesh, per IEEE Std 80 |
| NER | Neutral earthing resistor, limiting earth fault current on a star-connected winding |
| OLTC | On-load tap changer, allowing ratio adjustment without interrupting load |
| ONAN / ONAF | Oil natural air natural / oil natural air forced transformer cooling classes |
| OPGW | Optical ground wire, a shield wire incorporating optical fibres |
| POTT | Permissive overreach transfer trip, a teleprotection scheme for distance protection |
| PRP / RSTP | Parallel redundancy protocol / rapid spanning tree protocol, Ethernet redundancy methods |
| REF (64REF) | Restricted earth fault, a sensitive differential scheme for one transformer winding |
| SAIDI / SAIFI | System average interruption duration index / frequency index, reliability measures |
| SCR | Short-circuit ratio, available fault MVA divided by connected plant rating |
| Split factor | Fraction of earth fault current returning through the grid rather than shield wires |
| Sympathetic inrush | Prolonged asymmetric current in an energized transformer caused by energizing a parallel unit |
| THD | Total harmonic distortion, ratio of harmonic content to fundamental |
| X/R ratio | Ratio of reactance to resistance of source impedance, governing DC decrement and voltage sensitivity |
15. Confidentiality and Use Statement
This case study has been prepared for informational purposes. All client identities, project locations, contract details, and proprietary data have been withheld or generalized. Technical parameters, study results, and figures presented are representative of work performed by Keentel Engineering Solutions and have been adapted so that no individual project, owner, or facility can be identified. Nothing in this document constitutes a design recommendation for any specific installation. Any reuse of the methodologies described requires project-specific engineering analysis by a qualified professional engineer.